Research Article 
![]() Creative Commons, CC-BY
Creative Commons, CC-BY
Airflow In Paranasal Sinuses
*Corresponding author: M Gamerra, ENT Department, S Leonardo Hospital, Castellammare di Stabia, Italy.
Received: February 24, 2019; Published: March 07, 2019
DOI: 10.34297/AJBSR.2019.01.000543
Abstract
The function of paranasal sinuses has been investigated by considering a time-dependent gauge-pressure expression for airflow in the nose. Depending on the type of inhalation pattern by the same individual, it is shown that air flowing through the nasal cavity determines a more or less effective translation of the molecules of air coming from the paranasal sinuses.
A functional manometric survey of the middle meatus was carried out on a homogeneous group of 50 Caucasian individuals. The nose & sinus manometer MG1 performed the manometry. This device allowed us to record two pressure peak values in two different close nose-sinus places at the same time: the maxillary ostium (point 2) and a nasal point close to the maxillary ostium (point 1). A steel probe with two endings was built on for this specific purpose. We called “differential pressure” the algebraically difference between these two values. Venturi effect has been considered as a modulator of nose and sinus airflow. Venturi effect acts in such a way that a non-turbulent flow can be maintained even for deep breath. Furthermore, the function of paranasal sinuses as thermal regulators is highlighted.
Keywords: Paranasal sinus airflow; Paranasal sinus ventilation; Venturi effect; Nose-sinus manometry; Nose & Sinus manometer
Introduction
A correct respiration act occurs by inhaling air from the nose. When air passes through the nasal cavity (N), ventilation of the paranasal sinuses is made possible by the Venturi effect [1]. In the ostio-meatal complex “cold” air particles (see blue dots in Figure 1) flowing close to the infundibulum ethmoidalis drives out “warm” air molecules (red dots in Figure 1) from the maxillary sinus (M). Past the ostio-meatal complex, the cold and the warm molecules mix together, giving an increase of particle density and temperature. In this way, the flow of air particles, inhaled through the nose, can be considered as a forcing flux flow sustained by pulmonary action. The flow of air particles coming from the maxillary sinus is thus induced by the Venturi effect [2]. In fact, when air passes through the nasal cavity at velocity V1, it locally reduces the pressure, because of Bernoulli’s equation, by the following quantity
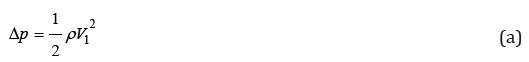
Where ρ is the local air density value. In order to give an estimate of the pressure gradient Δp , we take a peak velocity V1 and air density ρ equal to 10.0m/s and 1.2 kg/m3, respectively. In this way, the value of Δp is about 0.6mbar. These gauge-pressure values can be measured by means of a nose and sinus manometer [3,4].

Figure 1: Air flow near the maxillary sinus ostium. The blue air particles come from outside through the vestibulum nasi (N). The red particles come from the maxillary sinus (M).
Therefore, the time dependence of the velocity V1 can be measured by means of gauge-pressure data inside the nose. A typical experimental curve for Δp for patients taking a deep breath is shown in Figure 2a [5]. In Figure 2b, on the other hand, typical time dependence of the velocity V1 is shown, as derived from Eq. (a), taking ρ = 1.2 kg/m3 at a temperature of 20°C. From these curves we notice that the turbulent regime is fully present for values of V1 greater than V0, determined by the following condition:
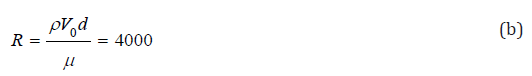

Figure 2: (a) Time dependence of the gauge-pressure Δp> during inhalation. (b) Velocity of air V1 inside the nose.
Where R is the Reynolds number, μ = 1.98×10⁻⁵ Pa s is the dynamic viscosity of air at 20°C, and d is a characteristic dimension of the nasal cavity (diameter of the equivalent circular section of the cavity). Taking, d=3.0mm, we have V0 ≈ 22m/s. Referring back to Figure 2b, we notice that only the upper portion of the curve attains velocities falling the range of fully turbulent regime.
This schematic description allows us to determine the value of the velocity V2 by means of a gauge pressure value close to the infundibulum ethmoidalis. The same type of effects can be detected in other paranasal sinuses, as the frontal and the sphenoidal sinuses. In the present work we shall thus give an account of these types of effects. Therefore, besides the well-known functions of the paranasal sinuses, we suggest an additional “fluid-dynamics function” [6,7].
Some of the still debated physiological functions of the paranasal sinuses may be considered to be the following: to lighten the weight of the skull; to give resonance to the voice; to reduce the traumatic effects on the face; to stabilize the temperature of internal sensitive structures, such as dental roots; to humidify and warm up inhaled air [8]. These functions may only constitute a partial list, since there could probably exist more refined functions. In order to see this, let us consider the inner nasal structure as a sequence of tubes as schematically depicted in Figure 3. Under stationary conditions and ideal fluid flow, conservation of energy can be applied. In the schematic description given in Figure 3 for the left side, air flows inside the nose encountering the lower turbinate (LT) and splits in two main streams: a lower one along the floor of the nasal cavity, the other going up toward the sphenoidal recess and the middle meatus. In this last structure, air is taken to flow at a velocity equal to V1 as also shown in Figure 1. Therefore, because of this flow pattern, the maxillary sinus, the frontal sinus (F), and the sphenoidal sinus (not shown in Figure 3) are able to ventilate.

Figure 3: Velocity distribution inside the nasal cavity. Notice that the velocities V2 and V3 of air coming out from the paranasal sinuses are affected by the air flow through the middle meatus.
Under the hypothesis of applicability of Bernoulli’s equation [9], single air particles describe laminar trajectories with no energy loss. Even though this could be a valid approximation for air flowing away from the ducts, viscous effect should be considered in the vicinities of the walls of the nasal cavity. In order to do this, one could still assume validity of Bernoulli’s equation in the central part of the duct where the gradient of the velocity profile can be neglected. Here we shall assume laminar and non-viscous flow throughout.
Nose Respiration Patterns
Depending on the inhalation pattern, we may consider three (or more) different types of gauge-pressure vs. time curves, as shown in Figure 4. In this figure, the time dependence of the absolute value of the gauge pressure | ΔpN| , measured in the vestibulum nasi and normalized to a typical value | ΔpN0 |, is represented for three different breathing modalities. The amount of air inhaled from a single nostril is assumed to be the same in all curves represented in Figure 4. The first inhalation pattern (dashed line) is very long in time and presents rather low values of the gauge pressure and of the velocities, as one can see from Eq. (a). In this way, this respiration act could be inefficacious, as far as the ventilation of the paranasal sinuses are concerned, as we shall see later. The second respiration pattern (dotted line) could be considered as regular: it lasts about 4 seconds and the generated gauge-pressure peaks are not too high, so that turbulent air flow inside the nose can be avoided. In the third respiration act (full line), on the other hand, high gaugepressure peaks are present in a rather short time interval, so that velocities are rather high and turbulent airflow may be generated.

Figure 4: Time dependence of the absolute value of the gauge pressure | ΔpN| normalized to a typical value | ΔpN0 | . Notice that curves with higher peaks tend to decay to zero in a shorter time interval. The amount of air inhaled from a single nostril is assumed to be the same for all curves.
Ventilation of Paranasal Sinuses
Let us now discuss the way ventilation of paranasal sinuses occurs. By referring to Figure 1, we consider the blue dots as “cold” air particles, while the red dots represent warm air in the maxillary sinus. Therefore, the blue particles flowing through the nose generate a sucking Venturi effect when passing close to the osteomeatal complex. In this way, air coming from the maxillary sinus (red dots) mixes with blue air particles. For mass conservation, we may thus write:
Δm1 + Δm2 = ΔmT & &(c)
Where Δm1 is the mass of the colder air molecules directed toward the osteo-meatal complex (see Figure 3), Δm2 is the mass of warm air molecules coming from the maxillary sinus, and ΔmT is the resulting mass of all molecules present after the mixing of the two flows. Because of the definition of the masses Δmk in terms of the densities ρk and of the volumes Δτk(𝒦=1,2), we may rewrite Eq. (c) as follows:
ρ1Δτ1 + ρ2Δτ2 = ρTΔτT &&(d)
Where ρT and ΔτT are the density and the volume of all molecules present after the mixing of the two flows. We can now compare these densities with the density of air coming inside the nasal cavity, taken to be equal to ρa. Therefore we write:

Where η and ∈ are small quantities (∈,η ≪ 1) . The relations in Eq. (e) can be justified by noticing that the density ρ2 of the warm air molecules coming from the maxillary sinus may be slightly less that the density ρa of colder air flowing in the nose, while the density ρT must be slightly higher than ρa, because more particles are present in the anatomical region past the infundibulum of the meatal complex. For example, in order to estimate the parameter ∈, we can refer to Eq. (e) to write the following expression:
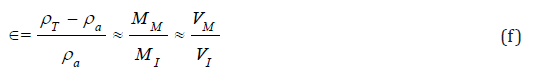
Where MM and MI are the masses of air initially at rest in the maxillary sinus and the mass of the inhaled air, respectively, and where VM and VI are the corresponding volumes of air. As it appears from Eq. (f), the parameter can be considered as a relative density variation of the resulting fluid (red and blue particles). By taking VM=15cm3 and VI=250cm3, we have that ∈≈ 0.06 .
By the same token, we can define
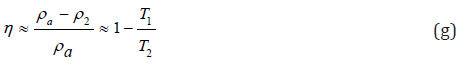
Where T1 and T2 are the absolute temperature of the incoming fluid (blue dots) and of the air particles within the maxillary sinus (red dots), respectively. Here we have made use of the perfect gas equation, in order to relate the densities to the absolute temperatures T,sub>1
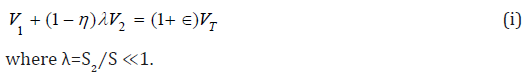
and T2. For instance, if the outside temperature is 10°C (283K), we set T1 ≈ 283K and T2 ≈ 309K (body temperature) so that η≈0.08.Let us now set Δτ1 = ЅΔ𝓍2 , Δτ2 = Ѕ2Δ𝓍2 , ΔτT = ЅΔ𝓍T , where Ѕ is the cross-sectional areas of the nasal cavity before and after the intake of air from the maxillary sinus, and where Ѕ2 is the crosssectional area of the infundibulum of the osteo-meatal complex. By substituting these expressions in Eq. (d) and by taking into account Eq. (e), we have:

Dividing by a small time Δt interval all addenda in Eq. (h) we finally get:
We here neglect the effect of external forcing terms on the short distance passing through the osteo-meatal complex. Therefore, having assumed laminar flow, we can invoke energy conservation for the confluent flows of air particles. In this case, by neglected pressure gradients in the vicinity of the confluence region, we may assume that the incoming air particles generate the flux flow of the warm particles from the maxillary sinus, initially in static equilibrium. Therefore, the energy spent for this process must result in a slowing down of the overall flow. In fact, by conservation of energy, we may write:
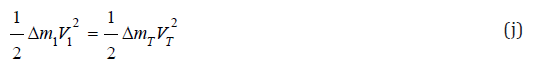
Therefore, by the definition of Δm1 and ΔmT given above and by Eq. (e), we have:

By now considering Δτ1 = ЅΔ𝓍1 and ΔτT = ЅΔ𝓍T and dividing by a small time Δt, we finally obtain:

This relation immediately signifies that the flow velocity past the confluence region is slightly slowed down, since by Eq. (l) we may write:
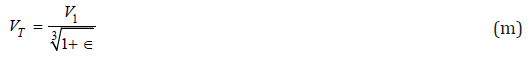
With the above result we may now see that Eq. (i) can be written as follows:
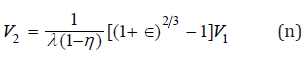
which gives the value of the velocity V2 of the air molecules inside the infundibulum of the osteo-meatal complex as a function of the parameters of the model and of the dragging velocity V1 We notice that, according to our model, there exists a direct proportionality between the velocity V1 of the air molecules generating the flow of warm air from the maxillary sinus M, and the velocity V2 of the particles coming from M. In order to evaluate the constant of proportionality, by taking ∈≈ 0.06 , η≈0.08, as estimated before, and by considering λ≈0.10, we have V2=0.43V1. Furthermore, by Eq. (m), we can notice that VT=0.96V1, giving a reduction factor for the velocity V1. Therefore, the more intense the breathing pattern is, the higher the velocity V2 of the “sucked” particles and the velocity VT become.
Paranasal Sinuses as Air Thermal Regulators
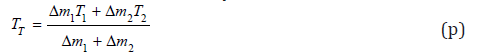
Paranasal Sinuses as Air Thermal Regulators By again referring to Figure 1, we can notice that a mixture of two confluent streams of air (red and blue dots) at different temperatures, T1 and T2, should give a resultant flow of air at temperature TT. We take T1 and T2 as the temperatures of the incoming air particles (blue dots) and of the air molecules inside the maxillary sinus (red dots), respectively. By assuming null net thermal exchange between the two fluids, we write:

where CA is the specific heat of air, which drops from the above equation, if we neglect, for simplicity, its variation with temperature and humidity. By solving for TT, we write:
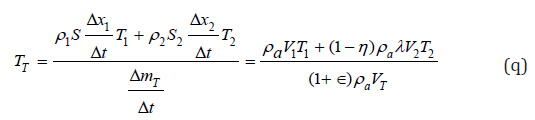
Let us now consider the definition of mass in terms of the density, as done in Eq. (d). By setting Δτ1 = ЅΔ𝒳1 and Δτ2 = Ѕ2Δ𝒳2 , and dividing by a small time Δt numerator and denominator in Eq. (p), we obtain:
By now dropping out the density of air and by considering Eq. (m) and (n), we have:
In order to see how the thermal exchange between the two fluids works, we may consider the parameter ∈ to be very small, as already specified in the previous section. Therefore, to first order in the parameter ∈, Eq. (r) can be written as follows:
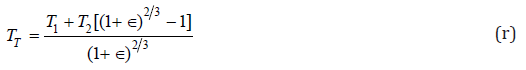
In this way, if T1 > T2 we have an overall temperature increase ΔT+ with respect to T1; i. e. T+ = TT - T1 > 0 . Therefore, cold incoming air (in winter time) is warmed. On the other hand, if T2 < T1, an overall temperature decrease ΔT- with respect to T1 is obtained; i. e. T_ = TT - T1 < 0 . In this way, in extremely hot summer days, incoming air could be slightly cooled down.
Materials and Methods

Figure 5: A) The laptop and the manometer MG1 linked to the rubber tube and the steel probe with two endings. B) The manometer positive and negative input. C) Drawing of the maxillary ostium: the knee ending of the probe is positioned in the maxillary ostium, sign + of point 2), and the straight ending is placed in a nasal point close to the maxillary ostium, sign - of point 1).
A functional manometric survey of the middle meatus was performed on a homogeneous group of 50 Caucasian individuals, 25 (50%) males and 25 (50%) females, aged from 29 to 79 yrs (mean age: 42,64 yrs; standard deviation: 13,1 yrs) at the Department of Otorhinolaryngology of the “S. Leonard” Hospital (Castellammare di Stabia – Italy). Only subjects that did not suffer from any general disorders or nasal pathology, neither functional nor anatomical, were included in this study. The Ethics Board of the Hospital and all patients gave the consent to the study. The nose & sinus manometry was performed at two different points of the nose-sinus cavity by means of the nose & sinus manometer MG1 (Patented). One end of the manometer was linked to a computer and software allowed us the visualization and recording of pressure values. The other end of the manometer was linked to a rubber tube and a steel probe with two endings built on for this specific purpose. The first ending had a straight shape the second one had a knee ending at right angle. The knee ending of the probe was positioned in the maxillary ostium in order to obtain instrumental measurements of pressure gradients inside the maxillary sinus (point 2) whereas the straight ending was positioned in a nasal point close to the maxillary ostium (point 1). This system allowed us to record two pressure peak values in two different close positions at the same time. We called “differential pressure” the difference between these two pressure peak values. In order to obtain the “differential pressure” value the point 2 was assigned a positive algebraically value (Figure 5).
The probe was first introduced in the middle meatus with the ending pointing upward, then rotated at an angle close to 120° (in clockwise sense in the left nasal cavity and in counterclockwise sense in the right nasal cavity) through the infundibulum ethmoidalis toward the maxillary sinus ostium. In this way the probe was placed just behind the uncinate process, and its correct position was confirmed by an endoscopic view for all patients.
Results
The selected group of subjects underwent to the manometry by means of the nose & sinus manometer MG1. The average pressure value obtained for the nasal point close to the maxillary ostium was – 2,2mbar (point 1).
The average pressure value obtained for the maxillary ostium was – 1,6mbar (point 2). In order to obtain the
“differential pressure” value the point 2 was assigned a positive algebraically value (+1,6). The average “differential pressure” value was -0,6mbar.
Discussion
The structure and the shape of the ostium meatal complex allow the maxillary sinus and the frontal sinus to ventilate in a “low pressure system” located in the space between the uncinate process - bulla ethmoidalis - middle turbinate. During inhalation the airflow generates in the nasal cavity a negative pressure and in order to evaluate its influence on the air inside the maxillary sinus was considered the Venturi effect. We started from a predefined biophysical model and applied it to the nose and sinus anatomy. The validity of the assessment methods in sinusometry of the nasofrontal ductus has been proved formerly [10,11] By means of the nose & sinus manometer MG1 and a two endings probe we gathered the pressure value at the maxillary ostium (point 2) and at a nasal point close to the maxillary ostium (point 1). This system allowed us to record two pressure peak values in two different close points at the same time. We named “differential pressure” the difference between these two values and for this purpose the point 2 was assigned a positive algebraically value.
The lesser is the “differential pressure” value the higher number of air molecule move from the maxillary sinus towards the nose. This generates an increase of air molecule in the nasal point close to the maxillary ostium with the effect of a nose air speed decrease. Therefore, we can consider the Venturi effect a modulator on nose and sinus airflow and a reducer of air turbulences that are generated in the nasal cavity during inhalation.
Conclusion
Ventilation of paranasal sinuses has been discussed [12,13]. Laminar flux flow within the nasal cavity has been assumed and conservation of energy has been invoked. In order to attain these ideal conditions, the inner nasal structure is seen to play an important role. The paranasal sinuses, in particular, may contribute in maintaining a laminar flow within the nasal cavity during inhalation. In fact, because of a Venturi sucking effect, air from the inner part of the maxillary sinus mixes with inhaled air molecules. Therefore, a reduction of velocity occurs for the resulting fluid past the osteo-meatal complex. Various factors can play a role in this type of phenomenon. However, in our simple description, we have considered only three basic parameters: the relative density variations and and the surface ratio λ. A rather detailed analysis has been performed for the maxillary sinus. The same principles can be applied when analyzing air flux flow close to the sphenoidal and the frontal sinuses. We could assume the paranasal sinuses are positioned in an anatomical sequence to maintain the airflow laminar all along the nasal cavity. Therefore, the overall velocity reduction must be calculated by considering the contribution of each paranasal sinus.
By this analysis, we can envision a rather refined function of the paranasal sinuses related to fluid dynamics. In this respect, our simple description of fluid flow inside the nasal structure shows a functional interdependence between the nasal structure and the paranasal sinuses. By considering flux flow past the osteo-meatal complex, we have shown that ventilation of the maxillary sinus is more effective for higher velocities of air generating the sucking effect. We suggest that nose and sinus surgery should be planned considering the fluid-dynamics function.
As far as the thermal regulating function (warming or cooling) of the paranasal sinuses is concerned, we have calculated, under very simple assumptions, the temperature variation that inhaled air undergoes when it mixes with air from the maxillary sinus. Naturally, our schematic description needs to be improved by considering other mechanisms taking place within the nasal structure and giving rise to similar temperature variations of inhaled air.
Conflict of Interest
The authors declare that there is no conflict of interest regarding the publication of this article.
References
- Halliday D, Resnick R, Walker J (2001) Fundamentals of Physics [Fifth Edition]. John Wiley and Sons, New York, USA, pp. 342.
- Flottes L, Riu R, Le Den R (1960) La Physiologie des sinus. In: Arnette (Ed.), Societè Francaise d’Orl, Paris, pp. 591.
- Gamerra M, De Luca R, Pagano G, Merone M, Cassano M (2013) The nose and sinus manometry: a bio-physical model applied to functional endoscopic sinus surgery. Journal of Biological Regulators & Homeostatic Agents 27(4): 1021-1027.
- Vogt K, Wernecke K D, Behrbohm H, Gubisch W, Argale M (2016) Fourphase rhinomanometry: a multicentric retrospective analysis of 36 563 clinical measurements. Eur Arch Otorhinolaryngol 273(5): 1185–1198.
- Cantone E, De Luca R, Gamerra M (2017) Nose air-flow-rate measurements by means of nose and sinus manometry. Biomed Phys Eng Express 3: 025017.
- Levine H, May M (1993) Rhinology and Sinusology. Stuttgart: Thieme.
- Wang De Y, Lee HP, Gordon B R (2012) Impacts of fluid dynamics simulation in study of nasal airflow physiology and pathophysiology in realistic human three-dimensional nose models. Clin Exp Otorhinolaryngol 5(4): 181–7.
- Huizing E H, de Groot J A M (2003) Functional reconstructive nasal surgery. Thieme, Stuttgart, Germany, p. 47-48.
- De Luca R, Gamerra M, Sorrentino G, Cantone E (2014) Nose and sinus air flow model. Natural Science 6(10): 685-690.
- Kass ES, Fabian RL, Montgomery WW (1999) Manometric study of paranasal sinus mucoceles. Ann Otol Rhinol Laryngol 108(1): 63-66.
- Kass ES, Salman S, Montgomery WW (1996) Manometric study of complete ostial occlusion in chronic maxillary atelectasis. Laryngoscope 106(10): 1255-1258.
- Clement P A, Halewyck S, Gordts F, Michel O (2014) Critical evaluation of different objective techniques of nasal airway assessment: a clinical review. Eur Arch Otorhinolaryngol 271(10): 2617–2625.
- Bertrand B, Collet S, Betsch C, Rombaux P, Eloy P (1997) Diagnostic techniques in chronic sinusitis: endoscopy, sinusomanometry. Acta Otorhinolaryngol Belg 51(4): 259-269.


 We use cookies to ensure you get the best experience on our website.