Research Article 
![]() Creative Commons, CC-BY
Creative Commons, CC-BY
Antibiotic-Receptor Molecular Interactions
*Corresponding author: Juan H Pacheco-Sánchez, TecNM / Technological Institute of Toluca, Av. Tecnológico s / n, Col. Agricola Bellavista, Metepec, 52149 Mexico.
Received: February 25, 2019 | Published: March 07, 2019
DOI: 10.34297/AJBSR.2019.01.000544
Abstract
The antibiotic (penicillin G) and receptor Escherichia Coli (e-coli) have been gotten from Protein Data Bank (pdb). Molecular interactions between these molecules are achieved through calculations of potential energy surface (PES) and molecular dynamics. These calculations are related to the structure of the molecules. Single point calculations of penicillin G interacting with e-coli molecules are carried out to obtain potential wells, for knowing whether there is attraction or repulsion between them. When calculating and graphing the minimum energies, we can realize that there is physisorption between these molecules. Furthermore, molecular dynamics of one system of 8 molecules of penicillin G with 1 molecule of e-coli, and another of 8 molecules of e-coli with 1 of penicillin G are accomplished. A histogram is made with the distances obtained from centroids of each molecule, and the radial distribution is calculated to obtain dispersion of the molecules according to the distance. The graphs of radial distribution g(r) in both cases have similar variation according to the distance. Universal Forcefield with Forcite of BIOVIA Materials Studio has been used for either energy calculations or molecular dynamics. We infer that e-coli microorganism is pulled out by means of physisorption with antibiotic penicillin G.
Introduction
The distribution of molecules is determinant in their macroscopic properties. The structure of the molecules is based on the chemical bonds that are the forces that hold the atoms together [1]. The e-coli and penicillin-G molecules found in the database Protein Data Bank (pdb) are shown in Figure 1. Potential energy curves are built when interacting these two molecules using single point calculations, by spinning e-coli molecule around the penicillin-G molecule (from 0ᵒ to 360ᵒ) with distances varying step by step, and are calculated through Forcite of BIOVIA Materials Studio software.

Figure 1: Microorganism e-coli and penicillin G antibiotic molecules.
Diverse researchers have been interested in investigating molecular interactions with molecular dynamics method to simulate variables according to Newton’s formulas, and thus know antibiotics behavior against microorganisms at a given time, so much in proteins, as base pairs, among others. Different studies on molecular dynamics will be shown in this case.
Investigation about the hydration behavior of proflavine antibiotic by means of molecular dynamics using GROMACS package for the simulation have been developed. The protocol of the latter is developed with: initiation, minimization of energy, stabilization, positional restriction, constant pressure, radial distribution, establishing hydrogen bridges between proflavine atoms of the molecule surrounded by water and frequency distributions of hydrogen bridges in water. The molecules that make it up are 1 proflavine molecule, 2 chlorine ions and 1410 water molecules. It is concluded that in the first layer of hydration they surround the proflavin above and below the plane of the rings. The approximately tetrahedral water structure that is affected by the presence of proflavine in the first layer of hydration (0.25 nm), showing that two regions of the solvent of 0.15nm thick surround the proflavin above and below the plane of the rings, where the frequency of occurrence of four hydrogen bridges decreases between 25% and 50% [2].
The computational simulation of biomolecules is studied by implementing the physico-chemical bases for the behavior of molecular systems, so it is possible to understand the functioning of a hemoprotein of the vinchuca such as the Nitroforin that transports nitric oxide in a pH dependent manner, as a result they obtained how the nitric oxide is trapped by the protein that is closed like a box at low pH, and opens releasing gas at a higher pH. In the deprotonation, Aspartic acid number 30 (Asp30) no longer has contact with the hydrogen bonds of carbonyl Leu130 and the protein is opened to release NO. Using molecular dynamics, they studied the pk of Asp30 in a pH range of 3 to 10, resulting in a pH of 6.5, which shows that at high pH deprotonation occurs, allowing us to devise on the future potential of computers [3].
In the study of molecular simulation methods for DNA structure with less than 50 base pairs, there are several simulation types. Alfaro focuses on studying molecules that cannot be observed by means of electron microscopy, and that present very small equilibrium times, he describes two types of methods: Monte Carlo that uses statistics, and molecular dynamics which studies particles movement at small times. The algorithm of meta-dynamics has been developed for the calculation of free energy with GROMACS package since it allows studying the evolution of these parameters intime scales that do not are accessible by other methods [4].
The Epidermal Growth Factor Receptor (EGFR), one of the most studied receptor tyrosine kinases, represents both a prototype cell surface receptor and a major target of anti-cancer drugs. Shan et al, focus on studying the N lobe dimerization interface of the EGFR kinase domain, since it is basically disordered, and is ordered only with dimerization. Its experiments have demonstrated affinity of cytoplasm dimerization, and that the kinase domains are weak. The simulation carried out shows that the intrinsic disorder is apparently absent in the invertebrate EGFR kinase in Drosophila Melanogaster, which shares 58% sequence identity to its human counterpart [5].
Quantitative and qualitative mathematical models developed to study the phenomenon of RAM, demonstrate the growing importance of this interdisciplinary collaboration. Which highlights that the methods of individual models for spread study of infections for resistant bacteria by using these mathematical models would be considered for individualized clinical parameters of each patient, and their interactions with the rest of the members of the community. Thus, they are very interested in making mathematical models for resistant bacteria [6]. Bacterial exotoxins play an important role in the course of an infectious process. Despite the existence of a great diversity of bacterial toxins, it is possible to distinguish several characteristic biochemical patterns for many of them. Even so, the action mechanism of numerous toxins is unknown. Morrison presents a review on the mechanisms of action of bacterial exotoxins, whose action sites are located intracellularly, making emphasis on synthesis mechanisms, catalytic activities and their target elements [7].
LPS (lipopolysaccharides) are part of the outer membrane of Enterobacteriaceae which are responsible for accepting antibiotics and entering the bacteria and preventing the formation of the internal cell wall, so the bacteria are destroyed. The internal core components of the LPS include certain unique sugars that are characteristic such as 3-deoxy-D-mannoktonosonic (Kdo) and L-glycero-D-mannoheptose, at least one Kdo residue, or a derivative is present in all known lipopolysaccharides, whereby this sugar indicates an essential role in the survival and growth of bacteria [8].
It has been found great interest in bacterial resistance to antibiotics by focusing on simulating molecular dynamics, which is one of the most serious public health problems. The different mechanisms of bacterial resistance acquisition would be of great relevance in infections prevention, and the elaboration of more effective antibiotics. For this, a simple mathematical model is formulated to describe the interaction of sensitive and resistant bacteria to an antibiotic. The qualitative analysis of this model reveals the existence of a bacteria-free state, an endemic state where only resistant bacteria exist, and an endemic state where both sensitive and resistant bacteria coexist [9-12].
Monte Carlo method simulation for pharmacokinetic cutoff analysis (PK/PD) of the Rifampin antibiotic for Acinetobacter baumanni has been investigated. The analysis was performed with 10,000 individuals, administering to them intravenous Rifampin at doses of 10 and 20 mg/kg/day. They obtained the probability of reaching a Cmaxlibre/CMI equal to 8 as a result for 10 mg/kg/day, by simulation of Monte Carlo was 0.4% and for 20 mg/kg/day: the probability of obtaining a ratio Cmaxlibre/CMI equal to 8 was 0.8%, and the cut-off point 0.25 mg/L. For Cmaxlibre/CMI of 10, it was 0.6% and 0.125 mg/L respectively, so they conclude that the results are different to those established by the SFM.
As we realize, the simulation by molecular dynamics is very useful in the present to study molecules, specifically in antibiotics, since it presents a great problem in the clinical field to create more efficient and effective antibiotics [13-16]. The results of the simulation of e-coli and penicillin G molecules found in the database Protein Data Bank (pdb) are shown. The resulting data are energies obtained when interacting these two molecules by spinning the molecule of e-coli around the penicillin G molecule (from 0ᵒ to 360ᵒ) with distances varying step by step, and are calculated through Forcite of BIOVIA Materials Studio software.
Firstly, the importance of molecular interactions is shown in the fundamentals as well as all those that involve them. In the methodology we explain the procedure in which the simulation of the molecules is carried out. In the results and discussion, the graphs of potential energies are shown and discussed. These are calculated 360ᵒ around the Z axis in steps of 5ᵒ. The calculation of minimum energy and distance corresponds to the equilibrium points. This is to know the behavior when interacting these two molecules, followed by the calculation of molecular dynamics using Forcite again, and finally the 𝑔(r) (radial distribution function) graphs, to know how they are distributed according to its density [17,18].
Methodology
We investigate the molecular interactions of e-coli (a unit from 2K06.pdb) and penicillin G (a unit from 1QME.pdb) molecules found on Protein Data Bank (pdb) using Forcite from BIOVIA Materials Studio with Universal Forcefield. Penicillin G and e-coli molecules were optimized to find the minimum energy; however, energies were calculated with respect to Z axis starting at 0° and up to 360ᵒ to obtain the potential well at steps of 5ᵒ. The molecular dynamics (MD) is calculated using, microcanonical ensemble (NVE), initial random speed, temperature at 298.0 K, step time of 1 fs, and 5000 steps. Then, molecular dynamics was carried on for two systems: i) one formed with 8 molecules of e-coli microorganism surrounding one antibiotic molecule. Each e-coli molecule in a sequence of 30ᵒ with respect to Z axis, this is to say, the first molecule at 30ᵒ, the second molecule at 60ᵒ, and so on, up to molecule number 8 around the antibiotic molecule, and ii) the other with 8 antibiotic molecules around e-coli molecule, each antibiotic molecule in a sequence of 30ᵒ with respect to Z axis. Distances from centroid to centroid of each molecule were calculated using the output of MD. The radial distribution function (RDF) is calculated introducing the output of the molecular dynamics in a periodic system. This is accomplished by inserting the molecules of the output in a cubic box using Amorphous Cell calculation from Materials Studio, considering density of 1.0 g / cm3, temperature of 298K, segment lookahead of 1, and the following electrostatic terms: calibration precision of 0.001 kcal / mol, Ewald summation method electrostatic. The radial distribution is calculated using periodic systems. This is obtained building a cubic box on the output of the molecular dynamics by means of amorphous cell, at density of 1.0 g/cm3, temperature of 298 ᵒK, and calibration precision of 0.001 kcal/mol to obtain periodic conditions by inserting the molecules in a cubic box at a density of 1.0 g / cm3, a temperature of 298 ᵒK, and Ewald accuracy of 0.001 kcal/mol. Electrostatic energy is calculated using Ewald as summation method, and buffer width of 0.5 Å, while van der Waals energy has been calculated using summation method based on atoms, cut off distance of 12.5Å, spline width 1 Å, and buffer width 0.5 Å.
Results
Potential energy (kcal/mol) results have been calculated for optimized molecules by means of Forcite of BIOVIA Materials Studio using Universal forcefield when one e-coli interacts with one antibiotic molecule at different distances (Å) between them until obtaining the potential well when the antibiotic attacks the e-coli molecule, and then plotting energy against distance as in Figures 13-16. The attacks where achieved each time the angle is changed for using it as reaction coordinate from 0ᵒ to 360ᵒ with respect to Z axis with steps of 5ᵒ, and then, the graph of energy against angle will be drawn. The equilibrium energy of each potential energy curve is shown in Table 1 and Figure 2. In these cases, the minimum energy at the corresponding angle is taken at each equilibrium distance. The graph of the results obtained in Table 1 are shown in Figure 2 where the analyses allow to explore possible bonds and the kind of adsorption between e-coli and antibiotic. Figure 2 shows the graph of the results obtained when calculating the energy as a function of the angle as reaction parameter, from 0ᵒ to 360ᵒ each 5ᵒ for the e-coli molecule around the antibiotic with respect to Z axis. What can be observed at less than 20 degrees is that the reactants at an energy about 269.5 (kcal/ mol) are the transition state energy in which begins to form a new e-coli + antibiotic molecule between the reactants, which at an angle of 30 degrees form a transition state, and at 80 degrees it forms a stable e-coli+antibiotic new molecule, so they are bound, to break immediately into possible products, also at approximately 125ᵒ the molecules are at their maximum energy once again, so that at 175ᵒ it returns to form some product. At 250ᵒ and 350ᵒ, the molecules are also active, as shown by calculating up to 360 degrees. That is, its behavior also leads to the formation of products and the activation between molecules, so they interact at these points of angle and distance, which when observing the size of the potential barrier, indicates that it corresponds to a physisorption with Hydrogenlike bonds. This behavior shown in Figure 2 is similar to that one reported in Figure 10.7 by Leach (2001), where the reaction coordinate is undefined, but here it is clearly given.

Table 1: Results of equilibrium energy [Kcal/mol] against angle [degrees].

Figure 2: Potential energy curve when angle is the reaction parameter. These graph goes from 0° to 360°, and the main variation of the energy is from 265 to 271 Kcal/mol.

Figure 3: Input-Output of molecular dynamics for eight drug molecules attacking one e-coli molecule.
A molecular dynamics calculation of 8 e-coli molecules surrounding one antibiotic molecule is shown as an-input-output in Figure 4. In the input, all the molecules are close, however in the output the distance among the molecules is significant, except at least one of e-coli and that of antibiotic. The output of this calculation of molecular dynamics can be seen in Figure 4. It shows that at least one molecule of antibiotic is bound to the of e-coli molecule. It is inferred that when both reactants remain adsorbed, the pathogenic microorganism could be dragged by the drug to another place different to that one preferred by the microorganism. Distances were calculated first by placing the centroid on each antibiotic molecule, and on the microorganism e-coli molecule. Then, we place the distance of each molecule of the antibiotic that surrounds the microorganism to realize how close or far are among them and thus corroborate which molecules have physical adsorption.

Figure 4: Input-Output of molecular dynamics for 8 e-coli molecules attacking 1 antibiotic molecule.
Histogram in Figure 5 refers to the distance from the centroid of the drug molecule to the centroid of each Esterichia Coli microorganism molecule. It indicates that only one of them is close to the antibiotic at an average distance of 38.6 Å, and observed in Figure 6, which is a different geometry orientation than Figure 7. According to the calculations of potential energy obtained this distance does not enter to the potential well, so there is no formation of a new complex; however, one centroid distance is 12.309 Å. In the latter case, we assume there is physisorption not from centroids but from atoms in the antibiotic, which are around 6.5 Å from atoms of e-coli microorganism. This is a value among the minimum values of the potential energy curves (Figures 13-16).

Figure 5: Histogram for centroid-centroid distances of the output in the previous Figure 6.

Figure 6: Radial distribution function for 8 e-coli molecules with 1 drug molecule. The RDF was obtained for interval 0.02 Å and cut off 20.0 Å.

Figure 7: Centroid distances among antibiotic and e-coli molecules.
The radial distribution function 𝑔(r) in Figure 6, tells us how likely it is to find one molecule with respect to another by considering distances distribution. The graph of radial distribution function is calculated from the molecular dynamics performed with a periodic system based on the arrangement of the molecules in a cubic box. The variation in distance of the antibiotic molecules surrounding the e-coli microorganism can be observed, and the greatest dispersion exists in the distance interval between 1 and 8 Å. It is known that when 𝑔(r)=1 the potential energy is zero, and in Figure 6 the noise around 𝑔(r)=1 is lesser than when r=10 Å, then the interaction among particles decreases as the distances are greater than 8 Å. This is in total agreement with the previous potential energy curves.
Now, a new molecular dynamics calculation of 8 antibiotic molecules surrounding one microorganism e-coli molecule is shown in Figure 3. In the input, all the molecules are close, however in the output the distance among the molecules is significant, except at least one of e-coli and that of antibiotic.
The output of this molecular dynamics simulation is shown in Figure 3. It shows that at least one e-coli molecule is bound to the antibiotic molecule. It is inferred that when both reactants remain adsorbed, the pathogenic microorganism could be dragged by the drug to another place different to that one preferred by the microorganism. Distances were calculated from centroid to centroid among e-coli microorganism and each antibiotic molecule as shown in Figure 8. Then, these distances give information related with how close or far are these molecules to identify possible physical adsorption, given that it is observed at 6.15 Å between the nearest atoms of e-coli and drug.
Histogram in Figure 9 refers to the distance from the centroid of each drug molecule to the centroid of Esterichia Coli microorganism molecule. It indicates that only one of them is close to the antibiotic at an average distance of 16.023 Å, as observed in Figure 8. According to the calculations of potential energy obtained earlier this distance does not enter the potential well, so there is no formation of a new complex; however, one of the centroid distances is 16.023 Å. In the latter case, we assume there is physisorption not from centroids but from one atom in the antibiotic, which is at 6.505 Å from an atom of e-coli microorganism. This is a value among the minimum values of the potential energy curves.

Figure 8: Centroid to centroid distance from e-coli microorganism to each antibiotic molecule.

Figure 9: Histogram for centroid-centroid distances of the output in the previous Figure 11 for 8 drug molecules and 1 microorganism.
The radial distribution function 𝑔(r) in Figure 10, is calculated from the molecular dynamics performed with a periodic system, which is obtained based on the arrangement of the molecules in a cubic box. The variation in distance of the antibiotic molecules surrounding the e-coli microorganism can be observed, and the greatest dispersion exists in the distance interval between 1 and 8 Å. It is known that when 𝑔(r)=1 the potential energy is zero, and in Figure 10 the noise around 𝑔(r)=1 is lesser than when r=10 Å, then the interaction among particles decreases as the distances are greater than 8 Å. This is in total agreement with the previous potential energy curves.

Figure 10: Radial distribution function of 8 antibiotic molecules and 1 e-coli microorganism.
When comparing the two graphs of radial distribution functions we can realize that between distance 1 and 4 Å the distribution is very variant according to the density of the molecules, and there is one peak of difference between distances 1 and 1.5 Å, however, from distance 4 Å onwards it is almost constant in the distribution for both graphs. This shows that the distribution for the most dispersed part goes in an analogous way, according to the density of the molecules, regardless of whether there is a greater or lower number of antibiotic molecules, since both systems show that the distribution of molecules and adsorption is almost equal.
- The molecular interactions were calculated through potential energies to calculate the potential wells and when analyzing each graph, we realize that the potential wells are between 5.5 and 6.5 Å distances.
- When calculating the minimum energy, it can be observed that the interactions are in the manner of physisorption or physical adsorption.
- First idea was to try to break the microorganism e-coli, however, provided that there can only be physisorption between both molecules due to the studies of potential energy curves and molecular dynamics obtained, it is impossible for the antibiotic to break the molecule of e-coli. Thus, physisorption between antibiotic and microorganism can only help whether the antibiotic manages dragging until the expulsion to the microorganism.
- In the radial distribution graphs, we can also see that the antibiotic molecules distribution and e-coli is almost the same no matter whether the antibiotic amount is major or minor, considering the distance and 𝑔(r) of the two systems.
Radial distribution function
When there are two solutes dissolved in water, the Brownian motion separates them by different distances “r” at different time. The radial distribution function, 𝑔(r), gives the probability of finding a particle in the distance “r” from another particle. If we count the appearance of two molecules at separation r, from r=0 to “r=∞”, we can get the radial distribution function 𝑔(r). The radial distribution function is a useful tool to describe the structure of a system, particularly of liquids. In a solid, the radial distribution function has an infinite number of sharp peaks whose separations and heights are characteristic of the lattice structure. Consider a spherical shell of thickness δ r at a distance r from a chosen atom Figure 11.

Figure 11: Radial distribution functions use a spherical shell of thickness δr..
The volume of the shell is given by
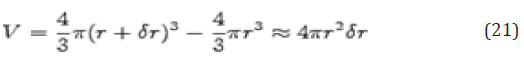
If the number of particles per unit volume is ρ, then the total number in the shell is 4πρr 2δr, and the number of atoms in the volume element varies as r2. The radial distribution function of a liquid is intermediate between the solid and the gas, with a small number of peaks as short distances, superimposed on a steady decay to a constant value at longer distances. A typical radial distribution function calculated from a MD simulation is shown in Figure 12. At short distances (less than atomic diameter) 𝑔(r) is zero. This is due to the strong repulsive forces. The first (and large) peak occurs at r ≈ 3.7Å, with 𝑔(r) having a value of about 3. This means that it is three times more likely that two molecules would be found at this separation. The radial distribution function then falls and passes through a minimum value around r ≈ 5.4 Å. The chances of finding two atoms with this separation are less. At long distances, 𝑔(r) approaches one which indicates there is no longrang order.

Figure 12: Radial distribution function determined from a 100ps molecular dynamics simulation of liquid argon at a temperature of 100K and a density of 1.396 g/cm3 [15].

Figure 13: Potential energy curves when e-coli attacks penicillin G from 0° to 90° with respect to Z axis. The minimum distances go from 5.5 to 6.5 Å.
To calculate the pair distribution function from a simulation, the neighbors around each atom or molecule are sorted into distance bins. The number of neighbors in each bin is averaged over the entire simulation. For example, a count is made of the number of neighbors between 2.5 and 2.75, 2.75 and 3.0 Å and so on for every atom or molecule in the simulation. This count can be performed during the simulation itself or by analyzing the configurations that are generated. Radial distribution function can be measured experimentally using X-ray diffraction. The regular arrangement of the atoms in a crystal gives the characteristic X-ray diffraction pattern with bright, sharp spots. For liquids, the diffraction pattern has regions of high and low intensity but no sharp spots. The X-ray diffraction pattern is analyzed to estimate an experimental distribution function, which is compared with the results obtained from the simulation.

Figure 14: Potential energy curves when e-coli attacks penicillin G from 100° to 195°with respect to Z axis. The minimum distances go from 5.5 to 7.5 Å.
Thermodynamic properties can be studied by calculating the radial distribution function. For example, in the calculation for the energy of a real gas, we consider the spherical shell of volume 4πr2δ r that contains 4π2ρ𝑔(r)δ r particles. If the pair potential at a distance r has a value u(r), the energy of interaction between the particles in the shell and the central particle is 4 π r2ρ𝑔(r)u(r)δ r. The total potential energy of the real gas is obtained by integrating r from 0 to ∞ and multiplied by N/2 (the factor 1/2 ensures that we only count each interaction once). The total energy is
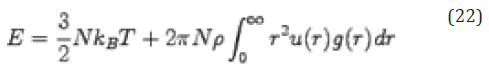

Figure 15: Potential energy curves when e-coli attacks penicillin G from 200° to 295° with respect to Z axis. The minimum distances go from 5.5 to 6.5 Å.
It is usually more accurate to calculate properties directly, partly because the radial distribution function is derived by dividing the space into small bins. For molecule, the orientation must be considered if the true nature of the distribution is to be determined. The radial distribution function for molecules is usually measured between two fixed points, such as between the centers of mass. This may then be supplemented by an orientation distribution function. For molecules, the orientational distribution function may be calculated as the angle between the axes of the molecule, with values ranging from -180° to +180°. In our case, the pair potential for molecules at r distance with value u(r) has externally been obtained by considering the parallel planes between both molecules. Then, we first fit the best plane passing over an average number of the whole atoms in the molecule. The potential energy curve at an angle of 0° is obtained when the planes are parallel, and by attacking the e-coli fixed molecule with an antibiotic molecule. Then, the parallel plane of the antibiotic molecule is rotated 5° around z-axis. We keep proceeding so on as shown in Figures 13-16.

Figure 16: Potential energy curves when e-coli attacks penicillin G from 300° to 360° with respect to Z axis. The minimum distances go from 5.5 to 7.0 Å.
- Reyes Melo ME, Hinojosa Rivera M (2000) Estructura de sólidos amorfos. México, Ingenierias 3: 7.
- Campo MG, Corral GM (2017) Estudio por dinámica molecular de la hidratación de la proflavina en solución. Anales (Asociación Física Argentina) 28(3): 76-80.
- Martí AM (2013) Simulación computacional de biomoléculas, un punto de encuentro entre físico - química y la biología computacional. Academia nacional de ciencias exactas físicas, Buenos Aires, p. 43.
- Alfaro Perez JD (2014) Metodos de simulación molecular, una ctuals de las herramientas mas ctuals. Revista Académica, pp. 117-119.
- Shan Y, Eastwood MP, Zhang X, et al. (2012) Oncogenic Mutations Counteract Intrinsic Disorder in the EGFR Kinase and Promote Receptor Dimerization 149: 860-870.
- Fresnadillo, et al. (2012) Modelos matemáticos en el estudio de la resistencia a los antimicrobianos, perspectivas a partir de un metaanálisis, Revista Academica p. 14-15.
- Morrison DC (1995) Endotoxins and disease mechanisms. Rev Cienc Méd pp. 417-420.
- Raetz, CR H (1990) Biochemistry of endotoxins. Rev Biochem pp. 130- 135.
- Esteva L, Ibargüen Mondragón E, Romero-Leyton J (2011) Un modelo matematico sobre bacterias sensibles y resistentes a antibioticos. Matemáticas 19(2): 55-73.
- García Zúñiga Claudia Valeska (2014) Resistencia antibiótica de Escherichia coli, Klebsiella, pneumoniae y Proteus sp, en el Hospital Regional de Occidente de Quetzaltenango.
- Garric M (1979) Química General. Reverté, p. 22.
- Leach AR (2001) Molecular Modelling: principles and applications. Prentice-Hall London England, p. 518.
- Lepe JA, Gil Navarro MV, Santos Rubio MD, Bautista J, Aznar J (2010) Evaluación farmacocinética y farmacodinámica del tratamiento con vancomicina en la bacteriemia por Staphylococcus aureus resistente a meticilina. Rev Esp Quimioter 23(1): 43-47.
- Lepe JA, García Cabrera E, Gil Navarro MV, Aznar J (2012) Rifampin breakpoint for acinetobacter baumanni based on pharmacokineticpharmacodynamic models with Montecarlo Simulation. Rev Esp Quimioter 25(2): 134-138.
- Tafur José David, et al. (2008) Mecanismos de resistencia a los antibióticos en bacterias gram negativas. Centro Internacional de investigaciones médicas 12(3): 217.
- Sears FW, Salinger GL (1978) Termodinámica, teoría cinética y termodinámica estadística. Barcelona: Reverté, pp. 327-347.
- Vázquez Nicolás MI, et al. (2006) Algunos aspectos básicos de la química computacional. UNAM, México, p. 26.
- Rodríguez F Antonio (1949) Cálculo aproximado de la distribución radial. La plata Instituto de Física pp. 157.


 We use cookies to ensure you get the best experience on our website.