Research Article 
 Creative Commons, CC-BY
Double Minimum Variance Beamforming Method to Enhance Photoacoustic Imaging
*Corresponding author: Mahdi Orooji, Department of Biomedical Engineering, Tarbiat Modares University, Tehran, Iran.
Received: January 19, 2019; Published: January 30, 2019
DOI: 10.34297/AJBSR.2019.01.000518
Abstract
One of the common algorithms used to reconstruct photoacoustic (PA) images is the non-adaptive Delay- and-Sum (DAS) beamformer. However, the quality of the reconstructed PA images obtained by DAS is not satisfying due to its high level of sidelobes and wide main lobe. In contrast, adaptive beamformers, such as minimum variance (MV), result in an improved image compared to DAS. In this paper, a novel beamforming method, called Double MV (D-MV) is proposed to enhance the image quality compared to the MV. It is shown that there is a summation procedure between the weighted subarrays in the output of the MV beamformer. This summation can be interpreted as the non-adaptive DAS beamformer. It is proposed to replace the existing DAS with the MV algorithm to reduce the contribution of the off-axis signals caused by the DAS beamformer between the weighted subarrays. The numerical results show that the proposed technique improves the full-width-half-maximum (FWHM) and signal-to-noise ratio (SNR) for about 28.83μm and 4.8dB in average, respectively, compared to MV beamformer. Also, quantitative evaluation of the experimental results indicates that the proposed DMV leads to 0.11mm and 6.13dB improvement in FWHM and SNR, in comparison with MV beamformer.
Keywords: Photoacoustic imaging; Image quality assessment; Image formation theory; Image reconstruction techniques; High resolution
Introduction
Photoacoustic imaging (PAI) is a non-invasive medical imaging modality which is fast growing [1]. It combines the physics of the ultrasound (US) and the optical imaging modalities and provides the resolution of US and contrast of the optical imaging [2,3]. In PAI, a non-ionizing radiation is used in order to illuminate the medium and generate the acoustic waves. Compared to the optical imaging, the advantage of PAI is its high penetration depth. In addition, it does not have the speckle noise appeared in US imaging [4]. PAI provides functional information since the optical absorption depends on the physiological conditions, such as haemoglobin concentration [5,6]. PAI has several applications such as ocular imaging [7] structural and functional imaging, [8] whole body of small animal imaging [9] and blood flow measurement [10]. In PAI, the imaging method is divided into two categories; Photoacoustic Microscopy (PAM) and Photoacoustic Tomography (PAT) [11]. In PAT, which is suitable for in vivo imaging, an array of ultrasonic transducers is used to receive the generated acoustic signals propagated from the medium [12]. Then, a reconstruction algorithm is used in order to recon- struct the absorption distribution in the medium [13]. Recently, low- cost PAT and PAM systems are extensively investigated [14-18]. Due to the high similarity between the US and PAI, beamforming algorithms used in US imaging can be applied on the PAI, with some modifications [19]. One of the most common reconstruction algorithms used in US and PAI, is Delay-and-Sum (DAS). However, the quality of the reconstructed Photoacoustic (PA) images are not satisfying, having a wide main- lobe and high level of sidelobes. Delay-Multiply-and-Sum (DMAS), introduced by Matrone et al. [20] was proposed in order to improve the quality of the reconstructed images compared to DAS [20].
Some algorithms have been developed to improve the contrast of the DMAS algorithm [21,22]. Adaptive beamformers, which are commonly used in Radar, weigh the detected signals based on the available information in the signals. Therefore, the adaptive beamformers would improve the image quality compared to non-adaptive beamformers. One of the adaptive beamforming methods that has mostly been developed in medical applications, is minimum variance (MV) algorithm [23] in which the weights are adopted to the inverse covariance matrix of the received data. It has been shown that in MV beamformer, the large sidelobes are steered in the directions where the received energy is low, and zeros are placed in directions where there is interference [24]. Using this algorithm, the quality of the reconstructed image will be significantly improved in terms of main lobe width and sidelobe levels compared to non-adaptive DAS beamformer. Significant improvements in the image quality have been seen by applying some modifications to the MV beamformer. In [25] temporal averaging has been employed to improve the image contrast. Another novel beamforming algorithm, named MV-Based DMAS (MVB-DMAS) was proposed for linear-array PAI in which the MV beamformer is used inside the expansion of the non-adaptive DMAS beamformer [26,27]. It has been shown that the quality of the reconstructed PA images is improved compared to MV and DMAS. Coherence factor (CF) has been applied to the MV beamformed signals to improve the resolution and suppress the sidelobes, and it has been shown that this technique is suitable in high frame rate (HFR) imaging applications [28]. A modification of CF has been introduced for PAI in order to have a lower sidelobes and higher resolution, compared to the conventional CF [29]. Eigenspace-Based Minimum Variance (EIBMV) and forward-backward (FB) MV beamformers also have been applied to medical US imaging to improve the image quality and robustness [30]. EIBMV was combined with DMAS to further improve the PA image quality [31].
In this paper, a novel technique, named Double-MV (D-MV) is introduced using the same concept introduced in [21,27,32]. It can be seen that there is a summation procedure between the weighted sub- arrays in the output of the MV beamformer, which is similar to the non-adaptive DAS beamformer. We propose to apply the MV to the weighted subarrays instead of the existing DAS beamformer to enhance the quality of the reconstructed PA images. It is shown that the proposed technique results in a narrower main lobe and lower level of sidelobes compared to MV.
The rest of the paper is organized as follows. First, a brief explanation about the concepts of the PAI and MV beamforming method along with the proposed algorithm are presented. In the next sections, the numerical and experimental results are presented. Finally, the discussion and the conclusion are reported.
Methods and Materials
Fundamental of photoacoustics
In PAI, a short laser pulse is used to irradiate the medium. The light is absorbed proportional to the characteristic of the medium. Following the light absorption, the thermoelastic expansion occurs and results in the PA wave propagation. Then, the propagated PA signals are received by an ultra- sonic transducer. The key problem is to reconstruct the absorption distribution of the medium from the received PA signals, using an appropriate algorithm. There are several methods and algorithms for PA image reconstruction, especially in the case of linear-array transducer [21,26,27,31]. It should be noted that due to the similarities between US and PAI, the PA images can be reconstructed using the algorithms and beamformers used in US image formation with some modifications [33]. In the following, MV beamformer is explained. More information about the fundamental of PA and wave equation is reported [34].
Minimum Variance Beamformer
Consider a linear-array transducer consisting of M elements. The output of the MV beamformed signal, y(k), is written as below:

where xm(k) is the received signal (delayed proportional to the distance of the element m to the point target), Δm and k are the time delay for mth detector and the time index, respectively, and wm(k) is the calculated weight corresponding to the delayed received signals. As it can be seen in (1), MV is considered as the sum of the weighted delayed signals. The weight is calculated in a way that the signal-to-interference-plus-noise ratio (SINR) would be maximized [35]:

where σ2s is the signal power and R(k) is the spatial covariance matrix of the interference-plus- noise. To maximize the SINR, the denominator of (2) should to be minimized while the unit gain is retained at the focal point:

where W(k) = [w1(k), w2(k), · · · , wm(k)]T , a is the steering vector and (.)H denotes the conjugate transpose operator. It should be noted that since the received signals are delayed, a is considered as a vector of ones. Equation (3) has the following solution using Lagrange multiplier method:

Referring to, [24] MV steers the large sidelobes in directions where the received energy is low, and places zero in directions where there is an interference. It is not possible to obtain the exact spatial covariance matrix in practical applications since the signals in the medical US and PAI cases are non-stationary, and therefore the spatial covariance matrix should be estimated using N received samples:

where X- (k) = [x1(k), x2(k), · · ·, xM (k)] T is the array of the delayed received signals. A tech- nique, named spatial smoothing, is used to obtain a good estimation of the spatial covariance matrix; the array sensor is divided into some overlapping subarrays with the length of L. Then, R(k) is estimated by averaging the calculated covariance matrices of each subarray. The estimated covariance matrix is written as below:

where X-l(k) = [xl(k), xl+1(k), · · ·, xl+L−1(k)]T is the delayed received signals of the lth subarray. In other words, the received signals obtained from M −L + 1 subarrays are replaced by N received samples in (5). Also, a more robust estimation would be achieved by applying diagonal loading (DL) in which Δ.trace{R^} is added to the estimated covariance matrix, before the weights are calculated. Δ is a constant parameter that corresponds to the subarray length and is much smaller than 1/L [36]. In addition, the temporal averaging over 2K+1 sample can be used in spatial covariance matrix estimation in order to achieve a better resolution while the contrast is retained [25]:

Using R^(k) instead of R(k) in (4), the weight is estimated, and the output is obtained from the following equation:

Proposed method
In MV beamformer, the weighted subarrrays are summed to make the output beamformed signals. This summation procedure is similar to the DAS beamformer. In this paper, it is proposed to apply MV to the weighted subarrays instead of the existing DAS algebra. To better illustration, consider the expansion of (8) as below:

Equation (9) can be rewritten as follows:

where

From the new form of the MV output, shown in (10), the possibility of applying MV to the weighted subarrays is more clearly identified. From (10), the existing DAS algebra between the weighted subarrays, pi(k), is obtained. As mentioned before, DAS is a non-adaptive beamforming method, and it cannot suppress the off-axis signals and noise as well as the adaptive beamformers. Therefore, the quality of the reconstructed image obtained from this algorithm is not satisfying, having wide main lobe and high level of sidelobes. It is proposed to apply MV instead of the existing DAS between the weighted subarrays inside the MV formula to generate the new DMV technique. It is expected that the quality of the reconstructed PA image be improved by replacing MV with DAS algorithm. To apply D-MV, the new spatial covariance matrix and consequently the new weight should to be estimated between the weighted subarrays, named R^D(k) and WD(k), respectively; Each weighted subarray, pi(k), is considered as an element, and therefore, it is possible to divide them into some new overlapping subarrays, with the length of LD. Then, the new spatial covariance matrix for the weighted subarrays would be estimated by the following equation:

where MD = M − L + 1 is the total number of subarrays, which are considered as elements, and
P(k) = Σpl(k), pl+1(k), · · · , pl+Lp-1(k)ΣT
DL is applied in this stage in order to have a more robust estimation, as mentioned before; ΔD. trace {R^D} is added to the diagonal of the new estimated covariance matrix, where ΔD is the constant parameter corresponding to the new subarray length, LD. Also, temporal averaging over 2KD + 1 samples can be applied in this stage. The final estimated output beamformed signal, y~D(k), is obtained from the following equation:

where the new weight is estimated by replacing R^D(k) with R(k) in (4). It is expected to achieve an enhanced reconstructed PA image using this new beamforming method. The numerical and experimental results, presented in the next section, show that the DMV beamformer improves the reconstructed images in terms of main lobe width and sidelobe levels, compared to MV.
Numerical Results
Imaging setup
The k-wave MATLAB toolbox is used to design the absorbers and the linear array sensor [37]. An imaging region is simulated with 70mm in the vertical axis and 20mm in the lateral axis. Nine spherical absorbers with a radius of 0.1mm are located as the initial pressures. The absorbers are centered on the lateral axis and located along the vertical axis. There is 5mm vertical distance between each two absorbers, and the positioning of the point targets are started from the distance of 25mm from the array sensor. The speed of sound is assumed 1540m/s. A linear-array consisting of 128 elements is used to receive the propagated PA signals from the point targets. The central frequency of the array is 5MHZ with 77% bandwidth. The subarray lengths are considered L = M/2 and LD = (M − L)/2. DL is applied to the spatial covariance matrixes in each stage of applying DMV with the assumption of Δ = 1/100L and ΔD = 1/100LD in the first and the second stage, respectively. Temporal averaging is applied over 7 received samples (K=3) in the first stage, and no temporal averaging is applied in the second stage of applying DMV (KD = 0). Also, Gaussian noise is added to the received signals to make the signals like the practical condition, having a signal-to-noise Ratio (SNR) of 50dB. The Hilbert transform is performed to the signals received by the array elements. Then, the normalization and log-compression procedure are performed after the reconstruction algorithm is applied.
Qualitative evaluation
Figure 1 shows the reconstructed PA images of the point targets with the dynamic range of 60dB. The reconstructed images using DAS, MV and DMV are depicted in Figure 1a-1c, respectively. It is obvious from the images that the adaptive MV beamformer outperforms the non-adaptive DAS beamformer, and the quality of the reconstructed image is improved. Comparing the proposed DMV algorithm with the MV, it can be concluded that DMV results in an improved reconstructed image in the terms of width of mainlobe and noise suppression. To have a better evaluation, the lateral variations are presented in Figure 2. The lateral variations at the depth of 25mm, 45mm, 50mm and 65mm are shown in Figure 2a-2d, respectively. As demonstrated by the lateral variations, the both adaptive beamformers outperform DAS in terms of main lobe width and sidelobes. Also, the proposed DMV beamformer would reconstruct the PA images with a significantly narrower width of main lobe and lower level of sidelobes, compared to the MV beamformer and DAS.
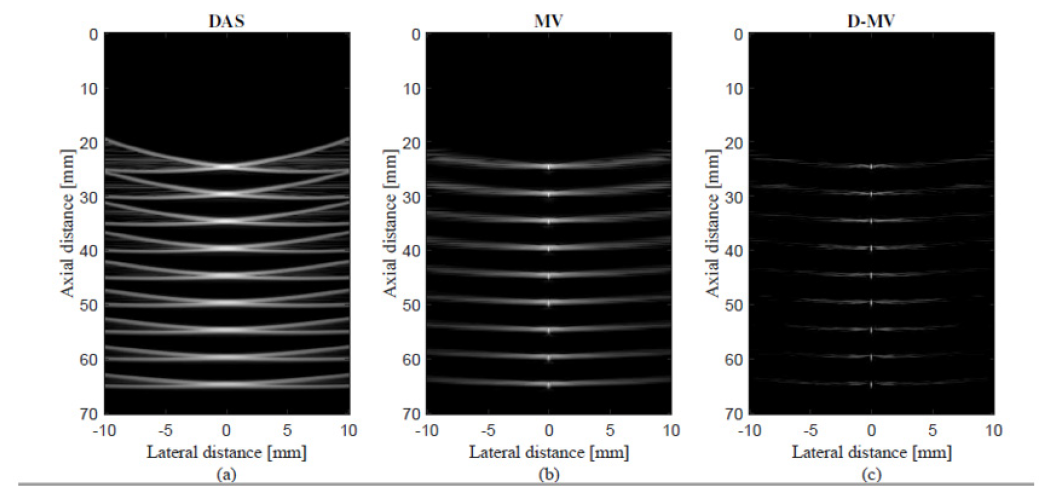
Figure 1: The reconstructed PA images of 9-point targets using (a) DAS, (b) MV, (c) D-MV. Noise is added to the received signals having a SNR of 50dB, K = 3, KD = 0.
Quantitative evaluation
SNR and the spatial resolution are two important metrics to evaluate and compare the performance of the beamformers. The full-width-half-maximum (FWHM) can be used to estimate the spatial resolution. The calculated FWHM s in each depth of positioning point targets are presented in Table 1. The calculated FWHM s show that the largest FWHM value belongs to DAS beamformer, at the all depths, as expected. Comparing the FWHM values of point targets achieved by MV and the proposed DMV beamformers, it can be concluded that DMV results in a narrower width of main lobe in -6dB, which means that the DMV beamformer would provide a reconstructed image with a better resolution compared to MV beamformer, as it can be seen from the lateral variations in Figure 2. It is worth to mention that the difference between the calculated FWHM s at different depths of positioning points, is almost negligible using DMV, in comparison with other beamformers; The difference between the calculated FWHM s at the first and the last depth of positioning points, is 2.53mm, 35.2μm and 1.5μm for DAS, MV and DMV, respectively. As a result, the resolution remains almost constant in all depths of imaging using the proposed DMV, compared to DAS and MV beamformers. SNR is calculated as follows:
SNR = 20 log10 Psignal/Pnoise
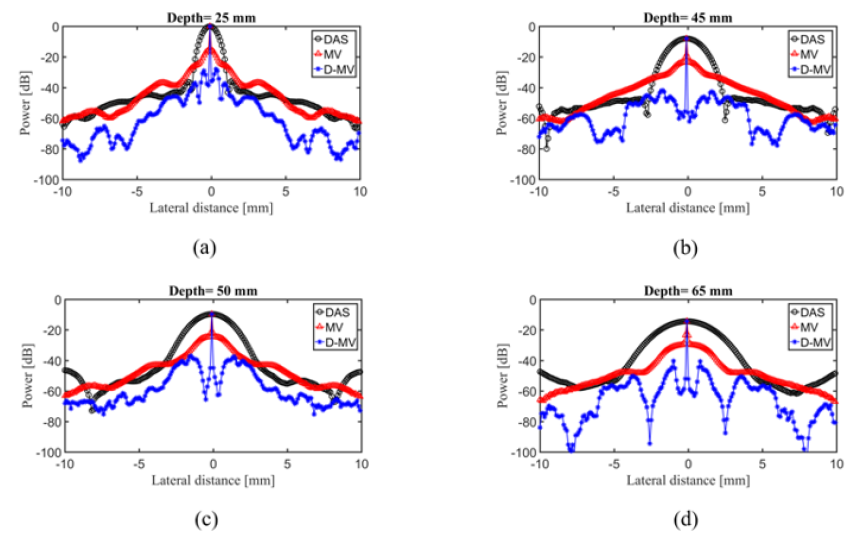
Figure 2: The lateral variations of the images shown in Fig. 1 at the depth of (a) 25 mm, (b) 45 mm, (c) 50 mm and (d) 65 mm. Noise is added to the received signals having a SNR of 50 dB.

Table 1: The calculated FWHM s (μm) at the different depths of Figure 1.
where Psignal is the difference between the maximum and the minimum intensity of the recon- structed image, and Pnoise is the standard deviation of the reconstructed image [21]. The SNR in each depth of positioning point targets are calculated and presented in Table 2. It can be seen from the calculated SNRs that DAS beamformer results in lower SNR compared to MV beamformer; existence of high sidelobes in the reconstructed image obtained by DAS results in a lower SNR compared to MV. Since the proposed DMV beamformer performs the MV twice, it leads to a better noise reduction, and therefore, higher SNR, compared to MV.

Table 2: The calculated SNRs (dB) for the Figure 1.
Imaging at the presence of high level of noise
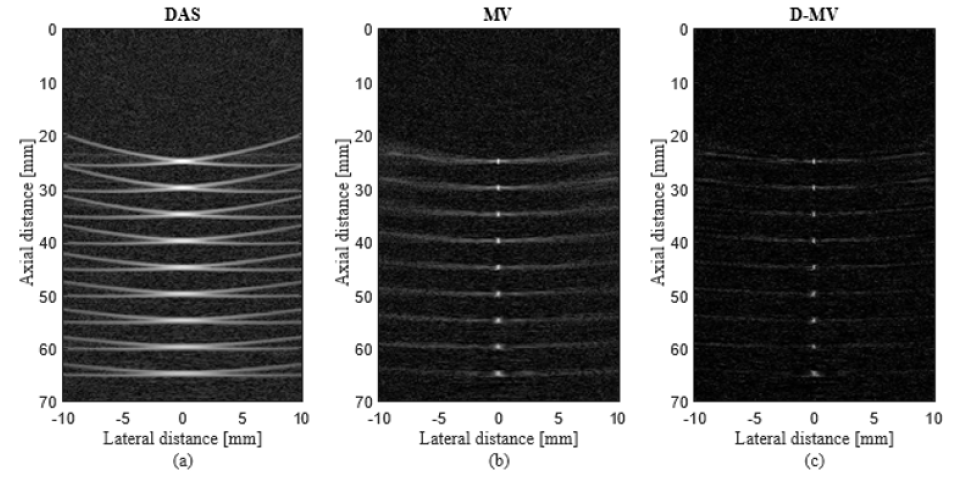
Figure 3: The reconstructed PA images of 9-point targets using (a) DAS, (b) MV, (c) D-MV. Noise is added to the received signals having a SNR of 10dB, K, KD = 0.
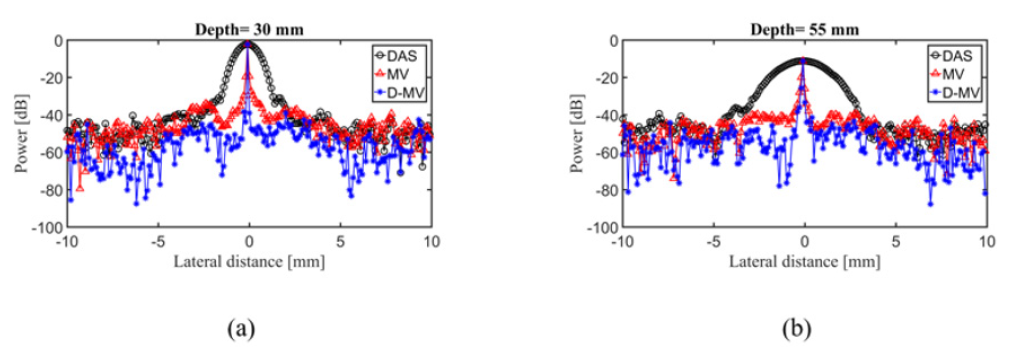
Figure 4: The lateral variations of the images shown in Figure 3 at the depth of (a) 30 mm and (b) 55 mm. Noise is added to the received signals having a SNR of 10 dB.
To evaluate the performances of the beamformers in terms of noise reduction, the reconstruction was performed while a high level of Gaussian noise was added to the detected PA waves, resulting in a SNR of 10dB. The reconstructed images of Nine-point targets simulation are shown in Figure 3, at the presence of a high level of noise. The dynamic range is 60dB. The reconstructed images using DAS, MV and the proposed DMV algorithms are shown in Figure 3a- 3c, respectively. As shown, the quality of the reconstructed image obtained from DAS is more affected by the presence of noise. Also, DMV results in an improved reconstructed image in terms of noise reduction, compared to DAS and MV. Figure 4a-4b show the lateral variations of the point targets in which 10dB noise is added to the received signals, at the depth of 30mm and 55mm, respectively, to compare the sidelobes. It can be seen that the main lobe width and the sidelobe levels of the reconstructed image obtained from DMV are enhanced, compared to other beamformers, at the presence of high level of noise.
Experimental Results
Experimental setup
A system consisting of an ultrasound data acquisition system, Vantage 128 Verasonics (Verasonics, Inc., Redmond, WA) and a Qswitched Nd: YAG laser (Ever Green Laser, Double-pulse Nd: YAG system) is used for PAI. The pulse repetition rate of the laser is 25Hz with 532nm wavelength and 10ns pulse width. A linear array sensor (L7-4, Philips Healthcare) consisting of 128 elements with 5.2MHZ central frequency is used to receive the propagated PA waves from the designed phantom. A function generator is used to synchronize all operations (i.e., laser firings and PA signal recording). The data sampling rate is 20.8320 MHZ. The schematic of the designed PAI system is presented in Figure 5. It should be mentioned that the transducer was perpendicular to the wires. Thus, it is expected to see a cross section of the wires which would look like a point target. In the following, the reconstructed images of the designed wire phantom are presented.
Wire phantom: The reconstructed images of a single wire phantom using DAS, MV and DMV
algorithms are presented in Figure 6. The reconstructed images are shown with a dynamic range of 40dB. It should be noted that the surface of the array sensor is perpendicular to the designed wire phantom during the imaging procedure, and therefore, the target is reconstructed like a point. It can be seen from the figures that the reconstructed image using the non-adaptive DAS beamformer leads to larger width of mainlobe compared to MV beamformer. In other words, MV improves the resolution of the reconstructed image compared to DAS, as expected. The narrowest mainlobe width, and con- sequently, the highest resolution would be achieved by the proposed DMV beamformer, shown in Figure 6 The reconstructed experimental images using (a) DAS, (b) MV and (c) DMV beamromers. The wire phantom was used at the target. All the images are shown with a dynamic range of 40dB.

Figure 6: The reconstructed experimental images using (a) DAS, (b) MV and (c) D-MV beamromers. The wire phantom was used at the target. All the images are shown with a dynamic range of 40 dB.

Figure 7: The reconstructed experimental images using (a) DAS, (b) MV and (c) D-MV beamromers. All the images are shown with a dynamic range of 40 dB.
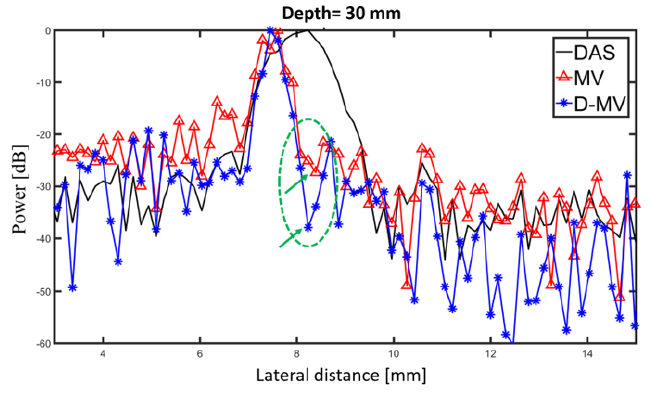
Figure 8: The lateral variations of the images shown in Figure 6 at the depth of 30 mm.
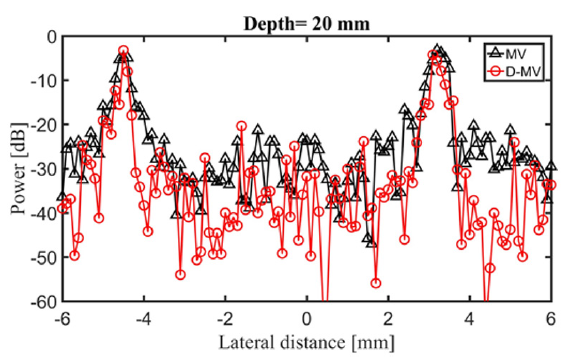
Figure 9: The lateral variations of the images shown in Figure 7 at the depth of 20 mm.

Table 3: The calculated SNRs (dB) and FWHM (mm) for experimental results shown in Figure 6.
To have a better evaluation, the lateral variations are presented in Figure 7. As demonstrated using the circle and arrows, the sidelobes are further degraded using the proposed method. Also, the SNR and FWHM for the reconstructed images shown in Figure 6 are calculated and presented in Table 3. It is obvious that DMV beamformer improves the SNR since the sidelobes gained by this algorithm are reduced, and it provides a higher noise suppression, in comparison with DAS and MV. A more complex phantom consists of two wires is used and the results are presented in Figure 8. It can be seen that MV results in resolution improvement compared to DAS, as expected. Comparing MV and DMV, the proposed DMV method improves the image in terms of resolution and contrast. The lateral variations shown in Fig. 9 proves that DMV improves the width of main- lobe and suppresses the sidelobes compared to MV. Moreover, quantitative evaluation show that DMV improves the SNR and FWHM for about 11.58dB and 0.38mm, respectively, compared to MV.
Discussion
The major benefit of the proposed DMV beamformer is the image enhancement in terms of main lobe width and sidelobe levels, compared to MV beamformer. The reconstructed images obtained from DAS algorithm is not satisfying since this algorithm is nonadaptive and the weights are pre- defined (data-independent). MV, as an adaptive beamformer, calculates the weights based on the characteristics of the detected signals. Therefore, it results in the resolution improvement com- pared to DAS. From the expansion of the formula related to the output of the MV beamformed signals, (8), and rewriting it in a new form shown in (10), it can be seen that the DAS algebra exists between the weighted subarrays. By replacing MV with the existing DAS between the weighted subarrays, the quality of the MV beamformed signals would be significantly improved. In fact, the proposed DMV algorithm reweights the weighted delayed signals adaptively, and the resolution of the reconstructed PA images are significantly enhanced compared to MV. As it can be seen in Figure 1b & 1c, where the image reconstruction is performed by MV and D-MV, respectively, the proposed DMV beamformer improved the image quality compared to MV. Also, more noise reduction is occurred. The lateral variations shown in Figure 2 indicate that the width of main lobe is significantly reduced using DMV in all the depths of imaging. DMV also results in the reconstructed image with a better quality at the presence of a high level of noise, as it can be seen from Figure 3, where 10dB noise is added to the received signals. The reconstructed image using MV beamformer, has a lower quality due to the existence of the DAS algebra between the weighted subarrays and its high off-axis signals contribution. On the other hand, the proposed DMV beamformer leads to a more noise reduction and a higher quality reconstructed image. The effects of the image enhancement using the proposed DMV can be seen in the experimental results shown in Figure 6 & 7 in which the resolution is improved compared to MV. It should be noted that the computational complexity of the DMV beamformer is higher compared to other beam-formers. The computational complexity of DAS beamformer is O(M). The processing time that MV needs to calculate the weights is O(M2). It is obvious from the output of the MV formula that the calculated weight is multiplied to the summation of the subarrays. Therefore, the total computational complexity of MV beamformer is O(M2M ) = O(M3). The proposed DMV beamformer consists of two stages; in the first stage, the processing time for calculating the weights is O(M2). In the second stage, MV is applied to the weighted subarrays with the computational complexity of O(M3). Therefore, total computational complexity of DMV would be O(M2M3) = O(M5), which is higher in comparison with MV beamformer. Of note, there are a large number of investigation to reduce the complexity of the MV beamformer. Having the computational burden of the MV beamformer reduced would result in imposing lower computational burden by the proposed algorithm.
Conclusion
DAS is one of the commonly used algorithms in PA image reconstruction due to its simple implementation. However, the DAS beamformed signals result in a wide mainlobe and large sidelobes. In MV, as an adaptive beamformer, the calculated weights are changed depending on the characteristics of the signals. Therefore, the resolution of the reconstructed image would be significantly enhanced compared to DAS. By the expansion of the MV formula, it can be seen that DAS algebra exists between the weighted subarrays. In this work, a novel beamforming method, named D-MV, was proposed to reconstruct the PA images, where MV is replaced with the existing DAS algebra. To put it more simply, it was applied to the weighted subarrays in the output of the MV beamformed signals. The numerical and experimental results showed that the proposed DMV technique improved the images in terms of main lobe width and sidelobe levels compared to MV. The quantitative evaluation of the numerical results, achieved by D-MV, indicated that FWHM and SNR were improved for about 28.83μm and 4.8dB, compared to MV, respectively.
References
- B Wang, L Xiang, MS Jiang (2012) Photoacoustic tomography system for non-invasive real-time three-dimensional imaging of epilepsy. Biomedical optics express 3(6): 1427-1432.
- M Xu and LV Wang (2006) Photoacoustic imaging in biomedicine. Review of scientific instruments 77(4): 041101.
- M Mehrmohammadi, S Joon Yoon, D Yeager (2013) Photoacoustic imaging for cancer detection and staging. Current molecular imaging 2(1): 89-105.
- P Beard (2011) Biomedical photoacoustic imaging. Interface focus 20110028.
- M Pramanik, G Ku, C Li (2008) Design and evaluation of a novel breast cancer detection system combining both thermoacoustic (ta) and photoacoustic (pa) tomography. Medical physics 35(6): 2218-2223.
- M Pramanik, LV Wang (2009) Thermoacoustic and photoacoustic sensing of temperature. Journal of biomedical optics 14(5): 054024- 054024.
- SY Nam, SY Emelianov (2014) Array-based real-time ultrasound and photoacoustic ocular imaging. Journal of the Optical Society of Korea 18(2): 151-155.
- J Yao, LV Wang (2014) Sensitivity of photoacoustic microscopy. Photoacoustic 2(2): 87- 101.
- J Xia, LV Wang (2014) Small-animal whole-body photoacoustic tomography: a Review. IEEE Transactions on Biomedical Engineering 61(5): 1380-1389.
- L Wang, J Xia, J Yao (2013) Ultrasonically encoded photoacoustic flowgraph in biological tissue. Physical review letters 111(20): 204301.
- LV Wang (2009) Multiscale photoacoustic microscopy and computed tomography. Nature pho- tonics 3(9): 503-509.
- M Nasiriavanaki, J Xia, H Wan (2014) High-resolution photoacoustic tomography of resting-state functional connectivity in the mouse brain. Proceedings of the National Academy of Sciences 111(1): 21-26.
- M Xu, Y Xu, LV Wang (2003) Time-domain reconstruction algorithms and numerical simulations for thermoacoustic tomography in various geometries. IEEE Transactions on biomedical engineering 50(9): 1086- 1099.
- A Hariri, A Fatima, N Mohammadian (2017) Development of low-cost photoacoustic imaging systems using very low-energy pulsed laser diodes. Journal of biomedical optics 22(7): 075001.
- A Hariri, M Hosseinzadeh, S Noei (2017) Photoacoustic signal enhancement: towards uti- lization of very low-cost laser diodes in photoacoustic imaging in Photons Plus Ultrasound: Imaging and Sensing. 10064-100645L International Society for Optics and Photonics.
- PK Upputuri ,M Pramanik (2017) Dynamic in vivo imaging of small animal brain using pulsed laser diode-based photoacoustic tomography system. Journal of biomedical optics 22(9): 090501.
- A Hariri, A Fatima, N Mohammadian (2016) Towards low cost photoacoustic microscopy system for evaluation of skin health in Imaging Spectrometry XXI, 9976, 99760X. International Society for Optics and Photonics.
- PK Upputuri, M Pramanik Performance characterization of low-cost, high-speed, portable pulsed laser diode photoacoustic tomography (pldpat) system. Biomedical optics express 6(10): 4118-4129.
- CW Wei, TM Nguyen, J Xia (2015) Real-time integrated photoacoustic and ultrasound (paus) imaging system to guide interventional procedures: ex vivo study. IEEE transactions on ultrasonics, ferroelectrics, and frequency control 62(2): 319-328.
- G Matrone, AS Savoia, G Caliano (2015) The delay multiply and sum beamforming algorithm in ultrasound b-mode medical imaging. IEEE transactions on medical imaging 34(4): 940-949.
- M Mozaffarzadeh, A Mahloojifar, M Orooji (2018) Double-stage delay multiply and sum beamforming algorithm: Application to linear-array photoacoustic imaging. IEEE Transactions on Biomedical Engineering 65(1): 31-42.
- M Mozaffarzadeh, A Mahloojifar, M Orooji (2017) Image enhancement and noise reduction using modified delay-multiply-and-sum beamformer: Application to medical photoacoustic- tic imaging, in Electrical Engineering (ICEE). Iranian Conference on IEEE 65-69.
- J Capon (1969) High-resolution frequency-wavenumber spectrum analysis. Proceedings of the IEEE 57(8): 1408-1418.
- JF Synnevag, A Austeng, S Holm (2009) Benefits of minimum-variance beamforming in medical ultrasound imaging. IEEE transactions on ultrasonics, ferroelectrics, and frequency control 56(9).
- JF Synnevag, CI Nilsen, S Holm (2007) P2b-13 speckle statistics in adaptive beamforming, in Ultrasonics Symposium. IEEE, 1545-1548.
- M Mozaffarzadeh, A Mahloojifar, M Orooji (2017) Medical photoacoustic beamforming using minimum variance-based delay multiply and sum. Digital Optical Technologies International Society for Optics and Photonics 10335-1033522.
- M Mozaffarzadeh, A Mahloojifar, M Orooji (2018) Linear-array photoacoustic imaging using minimum variance-based delay multiply and sum adaptive beamforming algorithm. Journal of biomedical optics 23(2): 026002.
- SL Wang and PC Li, (2009) Mvdr-based coherence weighting for high-frame-rate adaptive imaging. IEEE transactions on ultrasonics, ferroelectrics, and frequency control 56(10).
- M Mozaffarzadeh, Y Yan, M Mehrmohammadi (2018) Enhanced lineararray photoa- coustic beamforming using modified coherence factor. Journal of biomedical optics 23(2): 026005.
- S Mehdizadeh, A Austeng, TF Johansen (2012) Eigenspace based minimum variance beamforming applied to ultrasound imaging of acoustically hard tissues. IEEE transactions on medical imaging 31(10):1912-1921.
- M Mozaffarzadeh, A Mahloojifar, M Nasiriavanaki (2018) Eigenspacebased minimum variance adaptive beamformer combined with delay multiply and sum: experimental study. In Photonics in Dermatology and Plastic Surgery International Society for Optics and Photonics 10467- 1046717.
- M Mozaffarzadeh, M Sadeghi, A Mahloojifar (2018) Double-stage delay multiply and sum beamforming algorithm applied to ultrasound medical imaging. Ultrasound in Medicine and Biology 44(3): 677-686.
- S Park, SR Aglyamov, S Emelianov (2007) 10A-5 Beamforming for Photoacoustic Imaging Using Linear Array Transducer.
- M Xu, LV Wang (2002) Time-domain reconstruction for thermoacoustic tomography in a spherical geometry. IEEE transactions on medical imaging 21(7): 814-822.
- RA Monzingo, TW Miller (1980) Introduction to adaptive arrays. Scitech publishing.
- JF Synnevag, A Austeng, and S Holm (2007) Adaptive beamforming applied to medical ul- trasound imaging. IEEE transactions on ultrasonics, ferroelectrics, and frequency control 54(8).
- BE Treeby, BT Cox (2010) k-wave: Matlab toolbox for the simulation and reconstruction of photoacoustic wave fields. Journal of biomedical optics 15(2): 021314-021314.


 We use cookies to ensure you get the best experience on our website.