Mini Review 
 Creative Commons, CC-BY
Application of Monte Carlo Method for Simulation of Covid-19 Epidemic Behavior
*Corresponding author: Esmaeil Farshi, Department of Peace and Health Organization, San Diego, California, 1 Miramar St., CA 92137, USA.
Received: October 01, 2020; Published: October 08, 2020
DOI: 10.35097/AJBSR.2020.10.001532
Abstract
There is no any valid simulation for COVID-19 spreading behavior especially its herd immunity. Herd Immunity is going to play very important role in COVID-19 issue because of lack of treatment drugs and vaccination. Herd immunity thresholds constitute convenient targets for vaccination coverage too. Therefore, present Monte Carlo simulation is very important and applicable for both herd immunity and vaccination scenarios. Calculation of important factors, especially basic reproductive ratio Ro, may be used in both vaccine scenario and herd immunity. It may be also used for prediction of COVID-19 behavior in any city or society using our Monte Carlo simulation.
Mini Review
At the end of 2019, a novel coronavirus (COVID-19), was identified as the cause of a cluster of pneumonia cases in Wuhan, China. It rapidly spread, resulting in an epidemic throughout China, with sporadic cases reported globally [1]. Monte Carlo methods, or Monte Carlo experiments, are a broad class of computational algorithms that rely on repeated random sampling to obtain numerical results. Monte Carlo methods are mainly used in three problem classes: optimization, numerical integration, and generating draws from a probability distribution [2]. There are two ways to achieve high levels of immunity against COVID-19:
- Vaccination,
- Herd Immunity. Herd immunity is a concept in epidemiology that describes how people can collectively stave off infections if some percentage of the population has immunity to a disease.
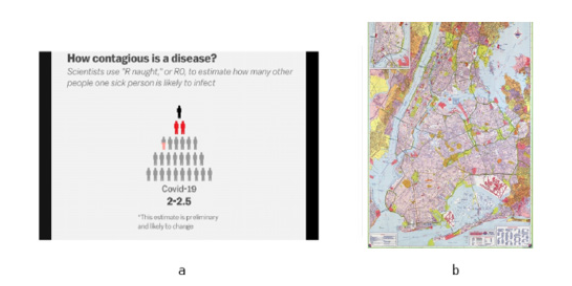
We developed a software program to simulate spreading behavior of COVID-19 in a city. We apply our simulation to New York city (Figure 1a) as a typical city because we have many statistics from that city and its high-resolution map is available. Our Monte Carlo simulation is based on random walk method. A random walk is a mathematical object, known as a stochastic or random process, that describes a path that consists of a succession of random steps on some mathematical space such as the integers [4] and [5]. To visualize the two-dimensional case, one can imagine a person walking randomly around a city (New York city in our simulation). At every intersection, the person randomly chooses one of the four possible routes (including the one originally traveled from). As mentioned before, we have used New York city as our model (Figure 1b). Our computer simulation has been developed to decide in random walk directions mostly toward high population places of the city (like metro stations, cinemas, concerts, shopping centers, malls and other crowdy places). However, our program has ability to use Google trace information for more exact simulations and results. It is evidence we may apply any city to our program also.
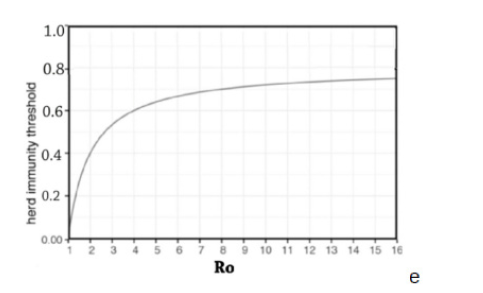
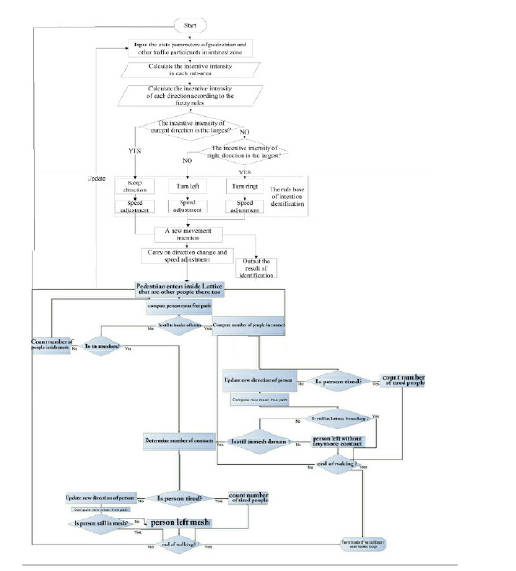
One may see the flowchart of computer programming in Figure 2 that is combination of random walk and reproductive of virus in the city. We define "R naught" or Ro to estimate how many other people one sick person is likely to infect. In very simple mathematics, the herd immunity threshold (HIT) is defined by 1–1/Ro (e.g., if Ro=4, the corresponding herd immunity threshold is 0.75) [5]. This Ro for COVID-19 is roughly about 2-6 or even more. Scientist have neither an experimental number nor calculation number for Ro and it is one of biggest problems in Simulation and understanding of COVID-19 spreading behavior. Ultimately, the goal of vaccination programs is to bring the value of Re below 1. This occurs when the proportion of the population with immunity exceeds the herd immunity threshold. At this point, pathogen spread cannot be maintained, so there is a decline in the number of infected individuals within the population [6]. In our Monte Carlo simulations, we will not assume a certain Ro, but our software will calculate it according to the characteristics and transmission dynamics of the population experiencing the outbreak. Then, our software is also a good method for estimation of Ro in any society experiencing outbreak (Figure 3).

Figure 1: a)Preliminary estimation of Ro by some scientists but will not use this data in our calculation and simulation. Our software will calculate Ro depend on many factors that impact transmission dynamics, including population density, population structure, and differences in contact rates across demographic groups and other factors. b)Map of Network used for our test simulation.

Figure 3: This shows Ro number versus herd immunity threshold (HIT) for NYC obtained from our Monte Carlo simulation.

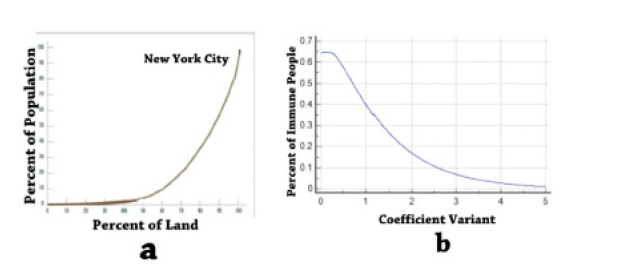
Figure 4: a) Heterogeneity of NYC population versus local size. It shows the coefficient variant (CV) about 70%. b) Immune population percentage versus CV.
Our main purpose is finding how much percent of people in New York City (Figure 1) become immune to COVID-19 disease that it stops the disease from spreading. It means herd immunity or Vaccination. We had four compartments in the city,
- Susceptible (uninfected),
- Exposed (latent: infected but not yet infectious),
- Infectious (typically when diseased), and r) Recovered (and thus immune and harmless). Our Monte Carlo simulation shows when 41% of population of NYC become immune against COVID-19, the city will reach to the herd immunity threshold (HIT) and 65% of the population ultimately becomes infected (Figure 4).
We will explain the reason of difference between expected result and our simulation, and why our result is correct. There are two reasons: 1) inhomogeneous structure of population in NYC, 2) n as the potential number of susceptible neighbors. Figure 4a shows only population inhomogeneity of land size in NYC. The coefficient variant (CV) related to it is about 0.65-0.70 according to mathematical calculation. If we consider other inhomogeneity of population, it is reasonable to have CV around 1. Figure 4b shows herd immunity threshold (HIT) versus CV plotted from a gamma function. If CV=1 then HIT will be about 40% that confirms our Monte Carlo simulation result. The effect of inhomogeneous population on HIT is very important, because governments may have plan and programs to reach herd immunity in shorter percent of infected people.
In Figure 3 one may see Ro versus herd immunity threshold (HIT) of NYC obtained from our Monte Carlo simulation. This is different from Ro obtained from (1-1/Ro) in some references. For example, when Ro=2.5, then HIT will be 0.75 according to (1-1/Ro), but it will be about 0.43 according to our Monte Carlo simulation. As we mentioned before, several key factors are implicitly in our Monte Carlo simulation, for example inhomogeneous mixing of individuals within a population and that all individuals not develop sterilizing immunity-immunity that confers lifelong protection against reinfection-upon vaccination or natural infection.
Our simulation shows that takes about two months to reach herd immunity threshold (HIT) in Manhattan. But interesting factor is that HIT in Manhattan area is 50% while in whole NYC is about 40%. Difference may be related firstly the population in Manhattan is more homogeneous comparing other areas of NYC, structure of population, and far low n number in Manhattan. New York city officials confirm surprisingly that number of infected people in Manhattan is less than other places of NYC. Incorporating, in a reasonable manner, inhomogeneity in susceptibility and infectivity in a standard epidemiological model, rather than assuming a homogeneous population, causes a very major reduction in the herd immunity threshold, and also in the ultimate infection level if the epidemic thereafter follows an unconstrained path. Therefore, the number of fatalities involved in achieving herd immunity is much lower than it would otherwise be [7].
Figure 5 shows prediction option for infected people using our Monte Carlo simulation. Please note input data for such type of prediction could be even some noisy real data. It is applicable in epidemics especially COVID-19 because preliminary data are not complete and there are noisy in such input data. Monte Carlo simulation is so far only method for exact investigation of herd immunity and vaccination scenario. Other methods are not exact and reliable.
References
- Zhou P, Yang X, Wang, X, Ben Hu, Lei Zhang, et al. (2020) A pneumonia outbreak associated with a new coronavirus of probable bat origin. Nature 579: 270-273.
- Kroese DP, Brereton T, Taimre, T Botev ZI (2014) Why the Monte Carlo method is so important today. Wiley wires Computational Statistics 6: 386-392.
- Wirth E, Szabó G, Czinkóczky A (2016) Measure Landscape Diversity with Logical Scout Agents". ISPRS–International Archives of the Photogrammetry, Remote Sensing and Spatial Information Sciences XLI-B2: 491-495.
- Wirth E (2015) Pi from agent border crossings by NetLogo package. Wolfram.
- RM Anderson, RM May (1985) Vaccination and herd immunity to infectious diseases. Nature 318(6044): 323-329.
- Haley E Randolph, Luis B Barreiro (2020) Herd Immunity: Understanding COVID-19. Immunity 52(5): 737-741.
- Nic Lewis (2020) Why herd immunity to COVID-19 is reached much earlier than thought.


 We use cookies to ensure you get the best experience on our website.