Short Communication 
 Creative Commons, CC-BY
False Negative PCR Tests for SARS-COV-2 – the Elephant in the Room
*Corresponding author: Amy S Fox, Professor, of Pathology and Pediatrics, Director, Virology Laboratories, Montefiore Medical Center, 111 East 210 street Bronx, NY 10467, USA.
Received: September 13, 2020; Published: September 25, 2020
DOI: 10.34297/AJBSR.2020.10.001522
Abstract
Introduction: Without criterion standards, clinicians have often been at a loss to interpret the meaningfulness of negative SARS-COV2 PCR testing in admitted patients. We provide a compelling epidemiologic analysis to ascertain an estimated false negative rate in an institution in New York City which experienced a surge early pandemic in the Bronx N.Y.
Methods: Using admitted historical controls from March 2019 as well as current patients analyzed from the initial surge of cases in NYC we used a logistic regression to determine the expected mortality rate in the Covid Negative, compare to the controls, and use an algebraic mixture equation to determine the false negative rate that could be responsible for the observed high mortality rate among the Admitted Covid test negatives.
Results: Unadjusted Mortality observed in March 2019 admissions 189/7462 (2.5%). Mortality in March 2020 CN 68/698 (9.7%). CP (417/1540) 27%. Logistic regression adjustment of the mortality rate of the CN population using the historical control yielded an expected mortality among the CN 3%. The difference is explainable by a false negative rate of 28%.
Conclusion: For admitted patients admitted during the Pandemic testing negative, a false negative rate of 28% should be entertained in any clinical decision making. The utility of laboratory tests especially in new diseases must be contextualized and evaluated against epidemiologic criterion standards.
Introduction
On February 4th, 2020 the US Food and Drug Administration (FDA) issued its very first emergency use authorization for RT-PCR detection of SARS-COV2, the novel coronavirus responsible for the Covid-19 illness. This assay had been submitted and could be performed only at the Centers for Disease Control and Prevention. Within one month, with cases in the United States and abroad growing exponentially, reports began pouring in from around the world demonstrating evidence of patients with CT findings consistent with COVID-19 pneumonia but whom tested repeatedly negative testing by PCR on nasopharyngeal sampling. These clinical false negatives posed a significant problem as they prevent patients from being enrolled in clinical trials or being adequately isolated. These results also stood in contradistinction to the FDA’s own reported sensitivity. Lastly, these clinical false negative results impact the accuracy of reporting of cases and their associated mortality which is vital to truly assess the impact of the current pandemic. With this in mind we sought a method of quantifying the degree of clinical false negativity at our institution, Montefiore Medical Center, which was at the epicenter of the outbreak experienced in New York City.
Methods
From March 10, through March 31st 2020, the first 2,237 admitted patients to the Montefiore Health system in the Bronx who had been tested for SARS-COV2 by PCR were analyzed. Montefiore Health System is composed of three free standing hospitals and an associated Children’s hospital. A PCR test performed on the day of admission was given priority for assigning status of COVID-19 positivity. Only definitive results were included. Presumptive findings were rejected. Patients admitted during March 2019, one year prior, were used as a control group to establish the baseline expectation of death during a similar calendar period prior to the pandemic. Patients eligible for cohort inclusion in more than one cohort were assigned with the following priority: SARS-COV-2 PCR Positive(CP), SARS-COV-2 PCR Negative(CN), and Control March 2019.
All patient care is served by a single electronic medical record system Epic (Verona, Wi) [1,2] whose data is replicated in a home grown advanced temporal cohort builder for outcomes analysis - Clinical Looking Glass [3-6]. Charlson [7,8] comorbidity score with age was created from all diagnoses available in the antecedent 180 days excluding the index admission. Diabetes was defined by a Glycosylated hemoglobin ≥6.5 in the antecedent ten years with hypertension and asthma defined by an available diagnosis between 1/1/18 to 3/1/2020. Research was approved by the institutional review board of the Albert Einstein College of Medicine 2014-3985 and was performed with HIPAA limited datasets with waiver of informed consent.
Logistic regression models were built (Stata 16) using age categories (<50, 50-60, 60-70,70-80,>80), race/ethnicity, gender, and Charlson comorbidity [3] built on all diagnoses in the antecedent 6 months in our electronic medical record system. To develop an estimate of anticipated mortality among the CN patients utilizing the historical 2019 experience, we built a logistic regression model of mortality using the data from 2019. We applied those coefficients to the CN patient covariates to calculate a predicted mortality for true negatives. A similar technique was used for the CP patients applying those coefficients to the CN patient to calculate predicted mortality for false negative patients.
Using the observed mortality in the CN patients and assuming that the observed deviation from the expected historical rate is explainable by some fraction of false negatives whose true rate would be given by the predicted rate from the positives, reduced the problem to an algebraic mixture exercise.
Observed rate in CN patients could be expressed by the following equation:
(False negative Rate)*(mortality rate of CP adjusted to covariate pattern in CN patients)
+
(1 –False Negative Rate) * (mortality rate expected from model built on controls in the days without COVID 19)
A number of Analytical Assumptions are required for estimation of the necessary rates, namely that a certain percentage of patients identified as CN are really CP, the observed mortality rate of the CN is artificially elevated by misclassified CP patients as CN, the Expected CN mortality is provided by the historical control adjusted for severity of illness. Additionally the mortality contribution by misclassified CP patients as CN is determined by our logistic regression model standardized on the CP patients and that all the mortality difference is due to the misclassification a false negative rate as calculated.
Results
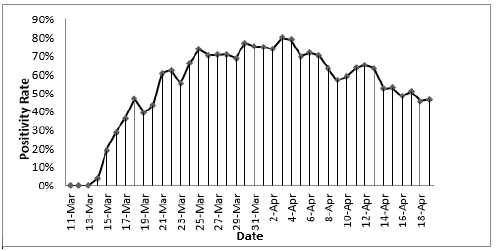
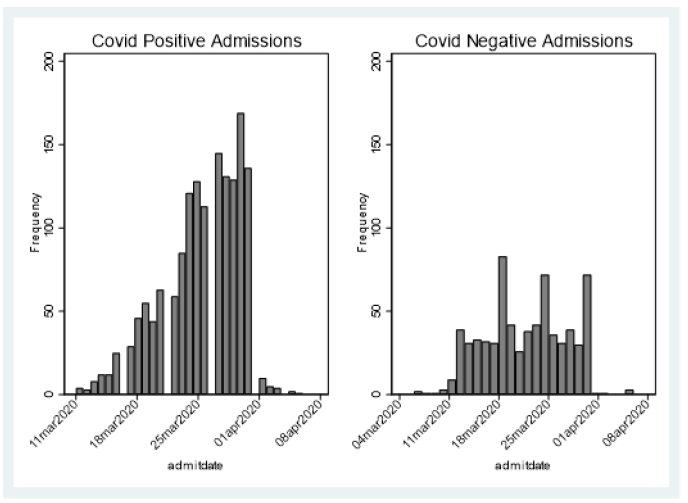
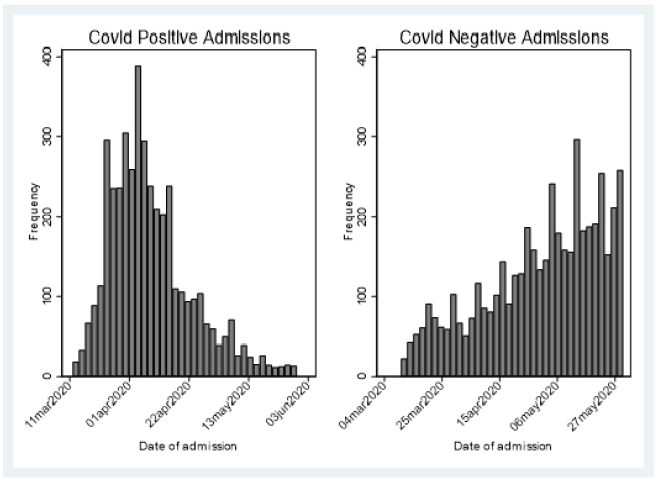
Between March 11 to March 31 , the first 2,237 patients SARS COV-2 tested within 24 hours of admission were included for analysis of mortality (Figure 1) first view of SARS COV-2 admitted testing for this report; Demographics, Charlson score and evidence of diabetes or hypertension is provided in Table 1. As expected, the hospitalized SARS COV-2 positives were older with a greater prevalence of hypertension and diabetes. Charlson score was higher among the SARS COV-2 Negative patients. Using a standard linear regression model of the Charlson adjusted for age, race/ethnicity, gender compared to historical control, showed increased severity of prehospitalization disease among the SARS COV-2 negative (.6 (s.d. .1) while the SARS COV-2 positive had lower pre-hospitalization comorbidity (-.78(sd .08) (p=.000) (Figures 2 & 3).
Unadjusted death rates in the three groups: 2019 controls: 189/ 7462 (2.53%), SARS COV-2 negatives 68/698 (9.74%), SARS COV-2 positives (417/1540) 27.1%.
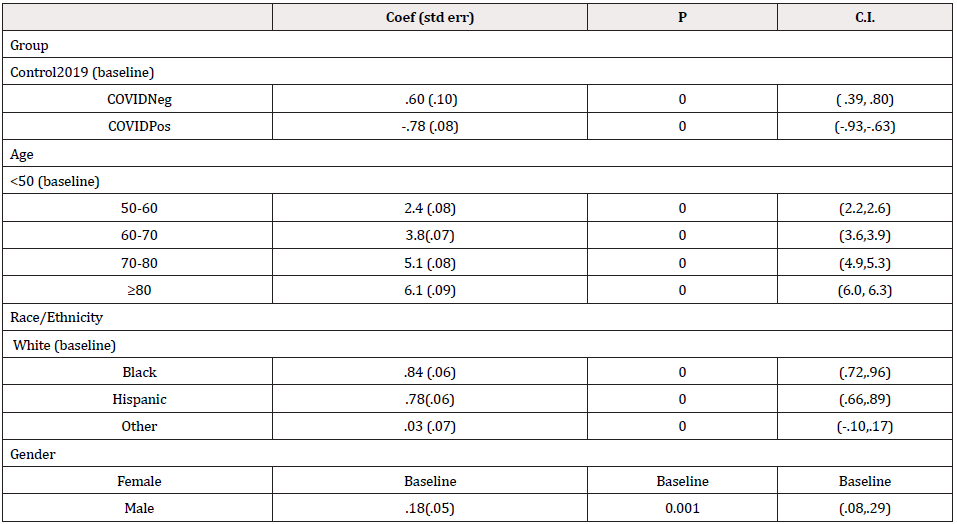
Logistic regression adjustment of CN adjusted to the 2019 historical control standard yielded an expected mortality rate of 3% (.029, .032) (Table 2). Adjustment of CN patients to the mortality rate expected if all had been truly positive yields a group mortality of 26.6% ( .254, .277).
Applying the described mixture analysis in the methods reveals that the increase of mortality from the 3% expected from historical controls to the observed 9.7% would require that 28% of the CN were actually positive. A lower limit analysis using the confidence upper limit confidence intervals for the adjustment of both the historical controls and the COVID positives would yield a false negative rate of 26.2%
Discussion
Covid Negative patients died at a much higher rate than anticipated from historical controls (9.74% vs 3%). Some of this higher death rate is explainable by worse Charlson scores. Not surprisingly, to compete for scarce hospital beds in the middle of a pandemic demands higher comorbidities. However, the Charlson difference is not enough to explain the dramatic increase in mortality. A 28% false negative test rate would provide that explanation.
An alternative explanation for the high CN mortality rate might be the impact of the dramatic increase in extraordinarily sick patients requiring intubation and dialysis overwhelming the hospital staff. At Montefiore, clinical staff was repurposed from non-traditional medical departments such as psychiatry and dermatology, in order to support clinical care. Conference rooms were converted into patient rooms. New proto-ICU beds and rooms were created. This was far from business as usual. In this hectic, overwhelming reality, it is not difficult to imagine that clinical staff could have been distracted, ignoring remediable issues, and contributing to increased mortality.
However, what of the test itself? There are multiple factors that contribute to the sensitivity of a diagnostic test. Before an assay is performed, the quality and integrity of the specimen play a crucial role. However, as the RT-PCR tests came to market there was a shortage of swab testing kits. This led to an inconsistency in procurement. The CDC recommendation of which body site to sample, was constantly changing [9] and each of the authorized diagnostic platforms, has its own limit of detection.
The clinical course of the disease may play a role. Early in infection, symptomatic hospitalized patients have detectable high viral loads. However, patients admitted later in their clinical course with severe lung disease and significant cardiomyopathy may not have detectable nasopharynx virus. This inability to detect virus after it is no longer present in the nasopharynx yields a functional False negative when there is nothing for the laboratory assay to detect [10-15].
The critical observation of this paper is its acknowledgement of the key role that well posed epidemiologic questions serve in making clinical sense of our laboratory tests. A laboratory test be it PCR or Antibody tests are technological marvels. The equipment and processes require extraordinary commitment and attention. However, without clinical context they are meaningless. This issue of clinical diagnostic accuracy goes beyond PCR detection from spiked contrived samples. At our peril, we only consider the sensitivity and specificity of the diagnostic tests without considering the negative predictive value of these tests in the real world clinical scenarios16 in which they are expected to perform.
We must always keep in mind the clinical course and context as we design interventional therapeutics [16]. Otherwise we run the risk of withholding lifesaving beneficial interventions if the tests are the absolute gatekeeper. Perhaps we can we antibody as a surrogate for infection status in certain hospitalized patients? [17] These are questions that we must entertain in spite of the narrow guidance currently surrounding antibody testing. We must be assured that the performance characteristics of laboratory tests have been evaluated with these expectations in mind.
COVID 19 is a reminder to us all that diagnostic testing must be interpreted within the patient’s clinical context, when he presented, and what his real exposures were. Instead of our relying solely on our extraordinary diagnostic capabilities we must remember to look more carefully at our patients.
References
- Carter LJ, Garner LV, Smoot JW, Yingzhu Li, Qiongqiong Zhou, et al. (2020) Assay Techniques and Test Development for COVID-19 Diagnosis. ACS Cent Sci 6(5): 591-605.
- Lieberman JA, Pepper G, Naccache SN, Huang ML, Jerome KR, et al. (2020) Comparison of Commercially Available and Laboratory Developed Assays for in vitro Detection of SARS-CoV-2 in Clinical Laboratories. Journal of clinical microbiology.
- Bellin E (2019) Missing Management: Health-Care Analytic Discovery in a Learning Health System. South Carolina: Kindle direct publishing.
- Bellin E (2017) How to ask and answer questions using electronic medical record data. South Carolina: Create Space.
- Bellin E (2015) Riddles in Accountable Healthcare: A primer to develop analytic intuition for medical homes and population health. South Carolina: Create Space.
- Bellin E, Fletcher DD, Geberer N, Islam S, Srivastava N (2010) Democratizing information creation from health care data for quality improvement, research, and education-the Montefiore Medical Center Experience. Acad Med 85(8): 1362-1368.
- Quan H, Sundararajan V, Halfon P, Andrew Fong, Bernard Burnand, et al. (2005) Coding algorithms for defining comorbidities in ICD-9-CM and ICD-10 administrative data. Medical care 43(11): 1130-1139.
- Quan H, Li B, Couris CM, Kiyohide Fushimi, Patrick Graham, et al. (2011) Updating and validating the Charlson comorbidity index and score for risk adjustment in hospital discharge abstracts using data from 6 countries. American journal of epidemiology 173(6): 676-682.
- Centers for Disease C. Interim Guidelines for Collecting, handling, and testing clinical specimens for COVID-19.
- Zitek T (2020) The Appropriate Use of Testing for COVID-19. West J Emerg Med 21(3): 470-472.
- van Kasteren PB, van der Veer B, van den Brink S, LisaWijsman, Jørgende Jonge, et al. (2020) Comparison of seven commercial RT-PCR diagnostic kits for COVID-19. J Clin Virol 128: 104412.
- Sullivan PS, Sailey C, Guest JL, Jeannette Guarner, Colleen Kelley et al. (2020) Detection of SARS-CoV-2 RNA and Antibodies in Diverse Samples: Protocol to Validate the Sufficiency of Provider-Observed, Home-Collected Blood, Saliva, and Oropharyngeal Samples. JMIR Public Health Surveill 6(2): e19054.
- Sabino-Silva R, Jardim ACG, Siqueira WL (2020) Coronavirus COVID-19 impacts to dentistry and potential salivary diagnosis. Clin Oral Investig 24(4): 1619-1621.
- Hagmann SHF (2020) COVID-19 in children: More than meets the eye. Travel Med Infect Dis 34: 101649.
- Boukhris M, Hillani A, Moroni F, Mohamed Salah Annabi, Faouzi Addad, et al. (2020) Cardiovascular Implications of the COVID-19 Pandemic: A Global Perspective. Can J Cardiol 36(7): 1068-1080.
- Woloshin S, Patel N, Kesselheim AS (2020) False Negative Tests for SARS-CoV-2 Infection - Challenges and Implications. The New England journal of medicine 383(6): e38.
- To KK, Tsang OT, Leung WS, Anthony Raymond Tam, Tak-Chiu Wu, et al. (2020) Temporal profiles of viral load in posterior oropharyngeal saliva samples and serum antibody responses during infection by SARS-CoV-2: an observational cohort study. Lancet Infect Dis 20(5): 565-574.


 We use cookies to ensure you get the best experience on our website.