Editorial 
![]() Creative Commons, CC-BY
Creative Commons, CC-BY
Statistical Method for Development of Composite Index in Clinical Research
*Corresponding author: Shein-Chung Chow, Patty J Lee, Junheng Gao, Duke University School of Medicine, 2424 Erwin Road, Durham, North Carolina.
Received: October 06, 2020; Published: October 15, 2020
DOI: 10.34297/AJBSR.2020.10.001538
Abstract
In clinical research, a medical predictive modelling is often performed using a multivariate set of risk factors to predict the performance of clinical outcome for an effective disease management. Using a well-established and validated medical predictive model, our goal is to develop a composite index of several dependent predictors to better inform the disease status and/or treatment effect with more accurate and reliable assessments. In practice, since each of the multiple predictors may be positively or negatively and/or linearly or nonlinearly correlated to the clinical outcome or response, an ideal composite index should be able to account for positively/negatively and/or linearly/non-linearly associations with the clinical outcome or response. In this article, criteria and a statistical approach for development of an ideal composite index are proposed. Under the proposed criteria and procedure, statistical methods are also derived. The proposed procedure for development of the composite index is evaluated both theoretically and via a clinical trial simulation.
Keywords: Multiple Regression Analysis; Risk Factors; Medical Predictive Model; Composite Index.
Introduction
In clinical research, a medical predictive model is often established using a multivariate set of risk factors (predictors). The purpose of a medical predictive model is not only to predict the performance of clinical outcome but also to provide valuable information regarding disease management including prevention, accurate and reliable diagnosis, and effective treatment of the diseases under study. In practice, for building a medical predictive model with a multivariate set of risk factors, a (logistic) regression analysis approach is often performed by the following steps: (i) identifying potential risk factors (e.g., demographics or patient characteristics) by determining associations between the potential risk factors and the response, (ii) testing for co-linearity among the identified risk factors, (iii) performing predictive model fitting with the identified predictors, (iv) performing goodness-of-fit of the fitted model, and (v) validating the developed medical predictive model [1]. In addition, generalizability of the medical predictive model should be examined for the purpose of external validation.
A well-established and validated medical predictive model upholds sparse predictors, particularly when these predictors are highly correlated with (dependent on) one another. Therefore, the principle investigator will try to integrate multiple predictors into a single predictor that informs the disease status and/or treatment effect while upholding accuracy and reliability [2]. Since each of the multiple predictors may be positively or negatively and/or linearly or nonlinearly correlated to the clinical outcome or response, an ideal composite index should be able to account for positive/negative and/or linear/non-linear associations with the clinical outcome.
Similar to statistical methods used for characterizing calibration (standard) curves in lab-based assays, we will develop an ideal composite index using similar criteria and corresponding methods. For example, we propose that an ideal composite index should be of the format: x1a x2b , where x1 and x2 are identified, highly correlated risk factors/predictors. Next, a procedure for the development of the ideal composite index, based on a multiple regression analysis model, is proposed. Under the multiple regression analysis model, statistical methods are derived accordingly. The criteria, process, and statistical methods are evaluated both theoretically and via a simulation study.
The remainder of this article is organized as follows: Section 2 will briefly introduce the concept of an ideal composite index, using examples from existing clinical research, and propose an innovative procedure for the development of an ideal composite index in clinical research; Section 3 will derive the statistical methods; Section 4 will apply the proposed to composite index in a simulation study.
Development of a Composite Index
Under a well-established medical predictive model, it is common to see that these predictors may be dependent on, or somehow correlated to one another in a linear/nonlinear and/or positive/ negative fashion.
Ideal Composite Index
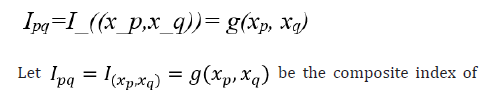
xp and xq , where xp and xq are identified and highly correlated predictors which are relevant to clinical outcome and g is a utility function that combines xp and xq . The goal of the ideal composite index is to identify the utility function g such that the developed index can account for positive/negative and/or linear/non-linear associations between each of the predictors (i.e., xp and xq ) and the clinical outcome.
practice, the selection of function g depends upon the relationship between the clinical outcome and each of the predictors (i.e., xp and xq ). For this purpose, we may consider the selection of a standard curve or calibration curve in the development and validation of an analytical method in laboratory testing. Let y be the amount of drug recovered (% of label claim) and x be the standard concentration. A standard curve or calibration curve is often determined based on the model fitting between yi and xi where i=1,..,n. In assay development and validation, the following four models are commonly considered:
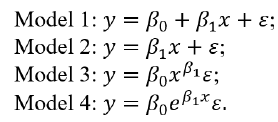
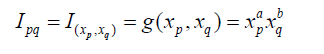
Model 1 is linear with a non-zero intercept, while Model 2 is linear without an intercept. Model 3 and Model 4 are non-linear but can be linearized by taking the logarithm. Based on the consideration that an ideal composite index should be able to account for positive/negative and/or linear/non-linear associations between each of the predictors (i.e., xq ) and the clinical outcome (y), we propose selecting the utility function g as follows
Model 1 is linear with a non-zero intercept, while Model 2 is linear without an intercept. Model 3 and Model 4 are non-linear but can be linearized by taking the logarithm. Based on the consideration that an ideal composite index should be able to account for positive/negative and/or linear/non-linear associations between each of the predictors (i.e., xq ) and the clinical outcome (y), we propose selecting the utility function g as follows
Example 1 – In clinical research, the above proposed composite index is commonly seen in practice. A typical example is the development of body mass index (BMI). As indicated in BMI [3], the BMI was first discussed by Quetelet in his published research work on the weight of men at different ages in 1832. BMI serves as a medical predictive model for obesity, and uses the two predictors of xp =
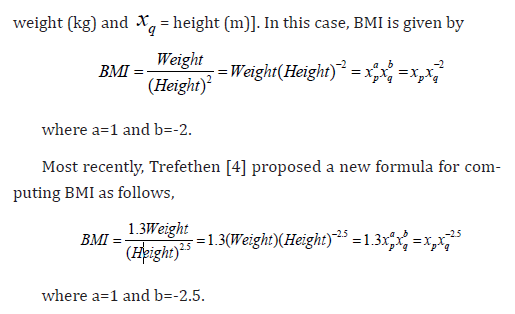
The scaling factor of 1.3 was determined to make the new BMI formula align with the traditional BMI formula for adults of average height. The exponent of 2.5 is a compromise between the exponent of 2 in the traditional formula for BMI and the exponent of 3 that would be expected for the scaling of weight with height.
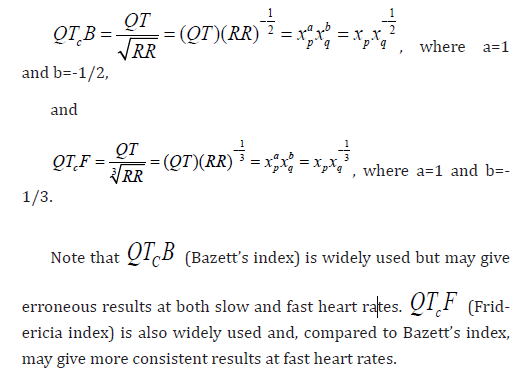
Example 2 – Consider QT interval prolongation for cardiotoxicity Let xp = QT interval and xq = heart rate (RR). Bazett [5] and Fridericia [6] proposed the following indices, which is a corrected QT interval (denoted by QTc ) adjusted for the square root of RR, respectively:
Proposal for Development of a Composite Index
In the interest of minimizing predictors, especially when these predictors are dependent on one another, and upholding generality, we consider the development of a composite index based on two confirmed predictors xp and xq, which are corrected for each other. We propose the following steps for the development of an ideal composite index by reducing a two-parameter ( xp and xq ) problem to a single parameter (the composite index) problem.
Step 1. Establish and validate a medical predictive model. Let y denote the clinical outcome/response (independent variable) and
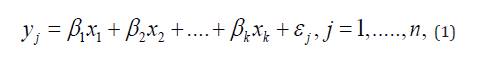
where βi,I = 1,....kare regression coefficients and i ε is the random error term. Under the multiple regression model, a (logistic) regression analysis approach is often performed to (i) identify potential risk factors/predictors (e.g., demographics or patient characteristics) by determining associations between the potential risk factors/predictors and the response, (ii) test for collinearity among the identified risk factors/predictors, (iii) build a medical predictive model by fitting the clinical outcome/response with the identified predictors, (iv) perform goodness-of-fit of the fitted model, and (v) validate the developed medical predictive model based on some pre-specified performance criteria.
Step 2. Under the established and validated medical predictive model, obtain estimates of the regression coefficients of the two predictors xp and xq, which we will develop into a composite index accordingly.
Statistical Method
Obtain Estimates of Regression Coefficients of Predictors
Under Model (1). Without loss of generality, assume y and all


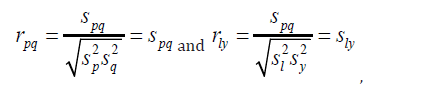
As a result, sample correlation between xp and xq and y are given by respectively.
In order to obtain estimates of βp and βq , consider rewriting model (1) in the following matrix form
Y = Xβ +ε (2)
where Y is the nx1 vector of dependent variables, X is the nxK matrix of regressors, β is the Kx1 vector of regression coefficients, and ε is the nx1 vector of random error terms. Under model (2), the ordinary least squares (OLS) estimator of β is given by

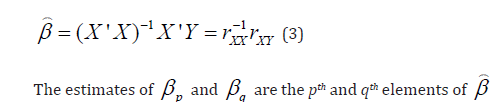
Fitting the Model between Predicted Values and the Composite Index
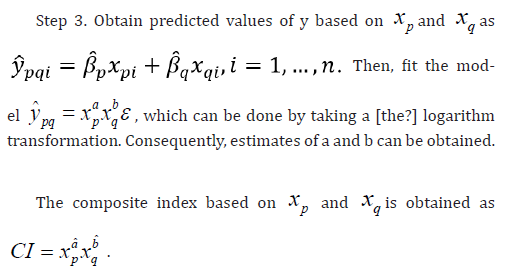
For the development of the composite index based on xp and xq, which are dependent on each other,
consider fitting the following multicaptive model between the predicted values

Validation of the Developed Composite Index
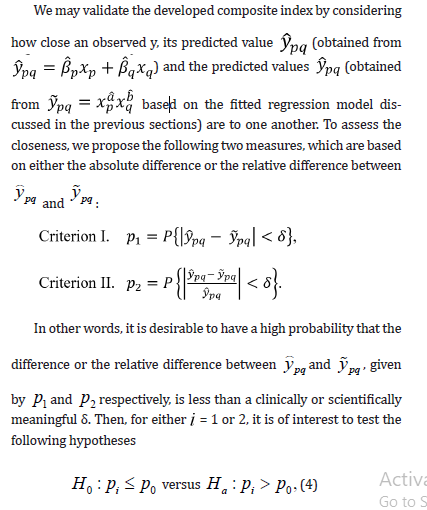
where p0 is some pre-specified constant. If the conclusion is to reject H0 in favor Ha , then the developed composite index is considered validated. The technical details of the test of hypothesis corresponding to the two criteria can be found in Tse et al. [7].
Simulation Study
In the simulation study, we construct a composite index that follows the similar modelling of body mass index with randomly generated weight xp and xq data. We examine three scenarios at which predictive accuracy could be affected. Firstly, we run the simulation for different sample sizes and compare the closeness of developed composite index to the observed value. Secondly, we analyse whether the correlation relationship between the predictors will affect the predictive accuracy. Thirdly, we test under different regression equations for observed yi and xi , the estimation of
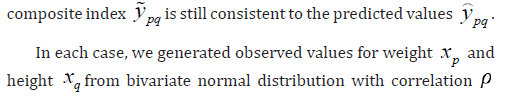
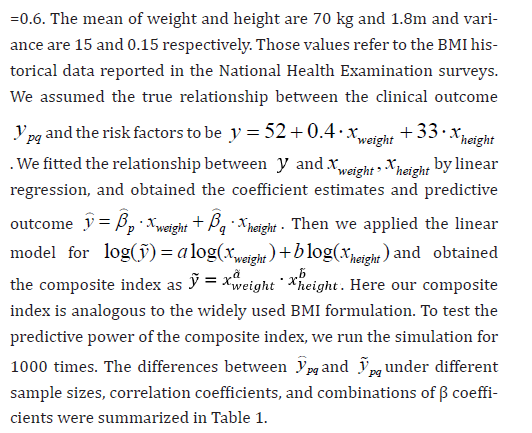

Figure 1: Evaluation of the Closeness between ypq-ypq
As shown in Table 1, the estimation of the proposed composite index is not affected by the sample size. Even for small sample size such as n = 50, the estimation is accurate and consistent. In scenario II, the difference between ypq-ypq is minor for proposed correlation between xp and xq With higher correlation coefficient, the difference becomes relatively smaller. For different beta coefficients, the relative difference is robust while the absolute difference has a minor trend of increase when response variable increases. Our results suggest the need to scale the risk factors or leave aside the intercept term before applying the linear regression model for the log-transformed variables.
Concluding Remarks
In this article, although the development of the composite index focuses on two dependent predictors, similar idea can be easily extended to develop a composite index combining more than two predictors, which are correlated one another. In the multiple regression analysis, the ordinary least squares (OLS) approach is considered for obtaining the estimates of regression coefficients. In practice, alternatively, we may consider weighted OLS (WOLS) for adjustment if heterogeneity in predictors are present.

An ideal composite index should possess the following advantages. First, in the interest of parsimony of predictors, the development a composite index reduces a multiple-parameter (e.g., two predictors as discussed in this article) problem to a single parameter (the developed composite index) problem. Second, the developed composite index is able to address the positively/negatively and/or linearly/non-linearly correlation between each of the two predictors (which are correlated each other) and the response. Third, the developed composite index outperforms each individual predictor in two ways: (i) if each predictor can inform the disease status or treatment effect, the composite index can definitely do and (ii) if the composite index can inform the disease status or treatment effect, each individual predictor may not be able to.
A future possibility is to build and check the quality of a composite index containing a variable for body structure and a variable for muscle mass, especially since risk for diabetes can be influenced by relative muscle mass for people with same height and weight, thus same BMI. In addition to body frame, such as large or small, despite same height could also be taken into account.
References
- Liu M, Chow SC (2018) Logistic regression process: predictive model building in clinical research. In Encyclopedia of Biopharmaceutical Statistics, 4th Edition, Ed. Chow, SC, CRC Press, Taylor & Francis, New York. pp. 1309-1314.
- Chow SC, Lee PJ (2020) Time to revisit endpoint selection in clinical trials. American Journal of Biomedical Science & Research 9(3).
- BMI (Body Mass Index) (2013).
- Trefethen N (2019) New BMI (Body Mass Index). Mathematical Institute, University of Oxford, USA.
- Bazett HC (1920) An analysis of the time-relations of electrocardiograms. Heart 7:353.
- Fridericia LS (1920) Die systolendaur im elektrokardiogram bei normalen menschen und bei herzkrauken. Acta Med Scand 53:469.
- Tse SK, Chow SC, Yang C (2008) Statistical tests for one-way/two-way translation in translational medicine. Journal of Formosan Medical Association, 107: 12, S42-S50.
- Chow SC, Huang Z (2019) Innovative thinking on endpoint selection in clinical trials. Journal of Biopharmaceutical Statistics 29(5): 941-951.
- Chow SC, Liu JP (1995) Statistical Design and Analysis in Pharmaceutical Science – Validation, Process Controls, and Stability. Marcel Dekker, New York.


 We use cookies to ensure you get the best experience on our website.