Review Article 
![]() Creative Commons, CC-BY
Creative Commons, CC-BY
Statistical Test for Composite Hypothesis in Clinical Research
*Corresponding author: Shein-Chung Chow, Professor of Biostatistics and Bioinformatics, Duke University School of Medicine, 2424 Erwin Road, Room 11037, Durham, NC 27705, USA.
Received: August 24, 2020; Published: September 03, 2020
DOI: 10.34297/AJBSR.2020.08.001485
Abstract
In clinical evaluation of the safety and efficacy of a test treatment under investigation, a typical approach is to test for the null hypothesis of no treatment difference in efficacy in randomized clinical trials (RCT). The investigator would reject the null hypothesis of no treatment difference and then conclude the alternative hypothesis that the treatment is efficacious. In practice, however, this typical approach based on test for efficacy alone may not be appropriate for a full assessment of both efficacy and safety of the test treatment under study. Alternatively, [1] suggested testing composite hypothesis by taking both safety and efficacy into consideration. In this article, appropriate statistical test for a composite hypothesis of non-inferiority in efficacy and superiority in safety is derived. The impact on power calculation for sample size requirement when switching from a single hypothesis (e.g., for efficacy) to a composite hypothesis (e.g., for both safety and efficacy) is also examined.
Keywords: Randomized Clinical Trial (RCT); Composite Hypothesis; Non-inferiority; Superiority; Power Calculation
Introduction
In clinical evaluation of a test treatment under investigation, a traditional approach is to first test for a null hypothesis that there is no treatment difference in efficacy alone in randomized clinical trials (RCTs) [2]. The investigator would reject the null hypothesis of no treatment difference and then conclude the alternative hypothesis that there is a difference and in favor of the test treatment under investigation. As a result, if there is a sufficient power for correctly detecting a clinically meaningful difference if such a different truly exists, the test treatment is then claimed to be efficacious. The test treatment will be reviewed and approved by the regulatory agency if the test treatment is well tolerated and there appears no safety concerns. In practice, the intended clinical trial is often powered for achieving the study objective with a desired power (say 80%) at a pre-specified level of significance (say 5%).
This traditional approach, however, may not be appropriate because one single primary efficacy endpoint cannot fully assess the performance of the treatment with respect to both efficacy and safety under study. Statistically, the traditional approach based on single primary efficacy endpoint for clinical evaluation of both safety and efficacy is a conditional approach (i.e., conditional on safety performance). It should be noted that under the traditional (conditional) approach, the observed safety profile may not be of any statistical meaning (i.e., the observed safety profile could be by chance alone and may not be reproducible). In addition, the traditional approach for clinical evaluation of both efficacy and safety may have inflated the false positive rate of the test treatment in treating the disease under investigation.
In the past several decades, the traditional approach is found to be inefficient because many drug products have been withdrawn from the marketplace because of the unreasonable risks to patients. For illustration purpose, Table 1 provides a list of significant withdrawn drugs between 2000-2010 [3]. As it can be seen from Table 1, most drugs withdrawn from the marketplace are due to safety concern (i.e., unreasonable risks to the patients). These unreasonable risks to the patients include unexpected adverse effects that were not detected during late phase clinical trials and were only apparent from post-marketing surveillance data from the wider patient population (Table 1).
To take both safety and efficacy into consideration in clinical trials, [1] suggested testing composite hypothesis by testing noninferiority/ superiority or equivalence of safety and efficacy as compared to a control (e.g., placebo control or active control). As an example, a commonly considered composite hypothesis is that H0 :not NS versus Ha : NS where N represents testing for noninferiority in efficacy and S is for testing superiority in safety. Under the composite hypothesis, it is of interest to examine the impact of power calculation for sample size requirement when switching from testing a single hypothesis (i.e., for efficacy alone) to testing a composite hypothesis (i.e., for both safety and efficacy).
In the next section, several composite hypotheses which will take both safety and efficacy into consideration are proposed. In Section 3, for illustration purpose, statistical methods for testing the composite hypothesis that H0 : not NS versus Ha : NS are derived. Section 4 studies the impact on power calculation for sample size requirement when switching from testing for a single hypothesis (for efficacy alone) to testing for a composite hypothesis (for both safety and efficacy). In Section 5, some concluding remarks are provided.
Hypotheses for Clinical Evaluation
In clinical trials, for clinical evaluation of efficacy, commonly considered approaches include tests for hypotheses of superiority (S), non-inferiority (N), or (therapeutic) equivalence (E). For safety assessment, the investigator usually examines the safety profile in terms of adverse events and other safety parameters such as laboratory testing to determine whether the test treatment is either better (superiority), non-inferior (non-inferiority) or similar (equivalence) as compared to the control. As an alternative to the traditional approach, [1] suggested testing composite hypothesis that will take into consideration both safety and efficacy. For illustration purpose, Table 2 provides a summary all possible scenarios of composite hypotheses for clinical evaluation of safety and efficacy of a test treatment under investigation. Statistically, we would reject the null hypothesis at a prespecified level of significance and conclude the alternative hypothesis with a desired power. For example, the investigator may be interested in testing non-inferiority in efficacy and superiority in safety of a test treatment as compared to a control. In this case, we can consider testing the null hypothesis that H0 :not NS , where N denotes the non-inferiority in efficacy and S represents superiority of safety. We would reject the null hypothesis and conclude the alternative hypothesis that : Ha : NS , i.e., the test treatment is non-inferior to the active control agent and its safety profile is superior to the active control agent. To test the null hypothesis that 0 H : not NS , appropriate statistical tests should be derived under the null hypothesis. The derived test statistics can then be evaluated for achieving the study objectives with a desired power under the alternative hypothesis. The selected sample size will ensure that the intended trial will achieve the study objectives of (i) establishing non-inferiority of the test treatment in efficacy and (ii) showing superiority of the safety profile of the test treatment at a pre-specified level of significance.
Note that for testing H0 :not NS versus : Ha : NS , the alternative hypothesis is that the test treatment is non-inferior (N) in efficacy and superior (S) in safety. Thus, the null hypothesis is not NS, i.e., the test treatment is inferior in efficacy or the test treatment is not superior in safety. Thus, the null hypothesis actually consists of three subsets: (i) the test treatment is inferior in efficacy and superior in safety; (ii) the test treatment is non-inferior in efficacy and not superior in safety; (iii) the test treatment is inferior in efficacy and not superior in safety. It would be complicated to consider all these three subsets when derive appropriate statistical test under the null hypothesis.
It also should be noted that in the interest of controlling the overall type I error rate at the α level, appropriate α levels (say α1 for efficacy and α2 for safety) should be chosen. Switching from a single hypothesis testing to a composite hypothesis testing, sample size increase is expected.
Testing Composite Hypothesis of Safety and Efficacy
For illustration purpose, consider the following composite hypothesis that H0 : not NS versus Ha : NS, (1) where represents testing for non-inferiority in efficacy and S is for testing superiority in safety
Derivation of Statistical Test Under the Composite Null Hypothesis
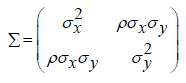
To test the null hypothesis that , appropriate statistical tests should be derived under the null hypothesis. Let X and Y be the efficacy and safety endpoint, respectively. Assume that (X ,Y ) follows a bi-variate normal distribution with mean (μx, μy) and variance-covariance matrix Σ i.e., where
Suppose that the investigator is interested in testing noninferiority in efficacy and superiority in safety of a test treatment as compared to a control. The following composite hypotheses may be considered:
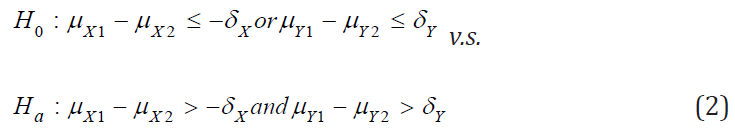
where 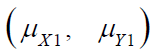 and
and 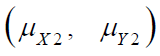 are the means of X ,Y)
for the test treatment and the control, respectively, and δX and
δY are the corresponding non-inferiority margin and superiority
margin. Note that δX and δY are positive constants. If the null
hypothesis is rejected based on a statistical test, we conclude that
the test treatment is non-inferior to the control in efficacy endpoint
X, and is superior over the control in safety endpoint Y.
are the means of X ,Y)
for the test treatment and the control, respectively, and δX and
δY are the corresponding non-inferiority margin and superiority
margin. Note that δX and δY are positive constants. If the null
hypothesis is rejected based on a statistical test, we conclude that
the test treatment is non-inferior to the control in efficacy endpoint
X, and is superior over the control in safety endpoint Y.
To test the above composite hypotheses, suppose that a
random sample of (X ,Y ) is collected from each treatment arm. In
particular,  are
are  , which is the
random sample from the test treatment, and
, which is the
random sample from the test treatment, and  are
are  , which is the random sample from
the control treatment, where i.i.d. stands for independent and
identically distributed. Let
, which is the random sample from
the control treatment, where i.i.d. stands for independent and
identically distributed. Let  and
and  be the sample means of X
in the test treatment and the control, respectively. Similarly,
be the sample means of X
in the test treatment and the control, respectively. Similarly,  and
and  are the sample means of Y in the test treatment and the control,
respectively. It can be verified that the sample mean vector
are the sample means of Y in the test treatment and the control,
respectively. It can be verified that the sample mean vector  follows a bi-variate normal distribution. In particular,
  follows
 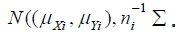 . Since
  and
and  are independent bi-variate
normal vectors, it follows that
are independent bi-variate
normal vectors, it follows that 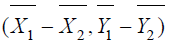 is also normally
distributed as
is also normally
distributed as  For simplicity,
we assume Σ is known, i.e., the values of parameters
For simplicity,
we assume Σ is known, i.e., the values of parameters  and
are known. To test the composite hypothesis H0 for both efficacy
and safety, we may consider the following test statistics
and
are known. To test the composite hypothesis H0 for both efficacy
and safety, we may consider the following test statistics
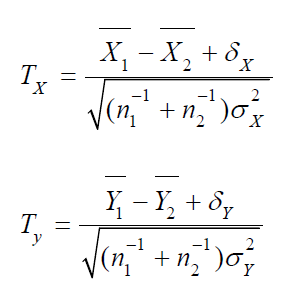
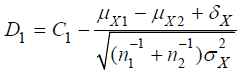
Thus, we would reject the null hypothesis H0 for large values of TX and TY. Let C1 and C2 be the critical values for TX and TY , respectively. Then, we have

where (UX, UY) is the standard bi-variate normal random vector, i.e., a bi-variate normal random vector with zero means, unit variances and a correlation coefficient of ρ.
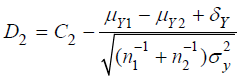
Under the null hypothesis 0 H that 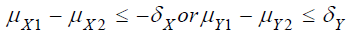 , it can be shown that the upper limit of
 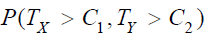 is the
maximum of the two probabilities, i.e.,
is the
maximum of the two probabilities, i.e., 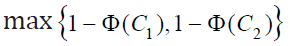 ,where Φ is the cumulative distribution function of the standard
normal distribution. A brief proof is given below. For given constants
,where Φ is the cumulative distribution function of the standard
normal distribution. A brief proof is given below. For given constants
 and
and  and a standard bi-variate normal vector
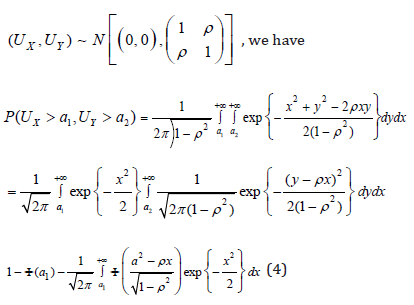
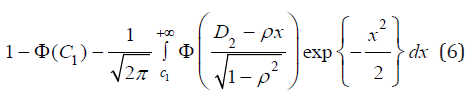
Since the joint distribution of (UX, UY) is symmetric, (4) is also equal to
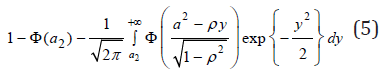
Based on (5), 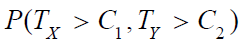 can be expressed by (4) and
(5) with and replaced by
can be expressed by (4) and
(5) with and replaced by
and
respectively. Under the null hypothesis H0 that
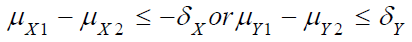 , it’s true that either
  . Since integrals in (4) and (5) are positive, it follows that

To complete the proof, we need to show for anyε  and
and
 , and given values of other parameters, there exists values of
 and
and  such that (6) is larger than
 and
and
 . Let . Then
  becomes
For  , there exists a negative value K such that when
  , for any x in
For sufficient large  , it can happen that
  .
Therefore, for sufficient large
.
Therefore, for sufficient large  . For
ρ ≤ 0, express the integral in (7) as
. For
ρ ≤ 0, express the integral in (7) as  , where
ϵ is chosen such that 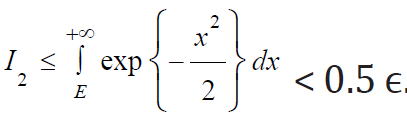 .The first inequality
holds as the cumulative distribution is always ≤ 1. For a chosen
value of ϵ, the argument for ρ > 0 can be applied to prove I1 <0.5
ϵ for sufficient large
.The first inequality
holds as the cumulative distribution is always ≤ 1. For a chosen
value of ϵ, the argument for ρ > 0 can be applied to prove I1 <0.5
ϵ for sufficient large  . Hence,
  is
greater than
is
greater than  for
for  and sufficient large
  . Similarly, it can be proved that
 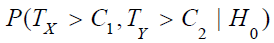 is
greater than
is
greater than
 for
for  and sufficient large
  . This completes the proof.
Therefore, the type I error of the test based on TX and TY
can be controlled at the level of α by appropriately choosing
corresponding critical values of C1 and C2. Denote by Zα the
upper α - percentile of the standard normal distribution. Then, the
power function of the above test is 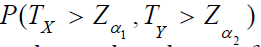 which
can be calculated from (5) and the cumulative distribution function
of the standard bi-variate distribution.
which
can be calculated from (5) and the cumulative distribution function
of the standard bi-variate distribution.
The Impact on Power Calculation for Sample Size
Fixed Power Approach
In practice, when switching from testing a single hypothesis (i.e., based on a single study endpoint such as the efficacy endpoint in clinical trials) to testing a composite hypothesis (i.e., based on two study endpoints such as both safety and efficacy endpoints in clinical trials), increase in sample size is expected. Let X be the efficacy endpoint in clinical trials. Consider testing the following single non-inferiority hypothesis with a non-inferiority margin of δX:

Then, a commonly used test is to reject the null hypothesis 01 H
at the α level of significance if TX > Zα. The total sample size for
concluding the test treatment is non-inferior to the control with
1 − β power if the difference of mean 
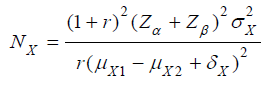
Where
 is the sample size allocation ratio between
the control and test treatment [4]? (Table 3) gives total sample
size (NX) for test of non-inferiority based on efficacy endpoint
X and total sample size (N) for testing composite hypothesis
based on both efficacy endpoint X and safety endpoint Y, for
various scenarios. In particular, we calculated sample sizes for
α =0.05, β =0.20, 1 2 0.3 μY − μY −δY = , = 1, and several values
of
is the sample size allocation ratio between
the control and test treatment [4]? (Table 3) gives total sample
size (NX) for test of non-inferiority based on efficacy endpoint
X and total sample size (N) for testing composite hypothesis
based on both efficacy endpoint X and safety endpoint Y, for
various scenarios. In particular, we calculated sample sizes for
α =0.05, β =0.20, 1 2 0.3 μY − μY −δY = , = 1, and several values
of 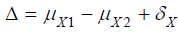 and other parameters. For a hypothesis
of superiority of the test treatment in safety, i.e., the component
with respect to safety in the composite hypothesis, the preceding
specified values of type I error rate, power, and
and other parameters. For a hypothesis
of superiority of the test treatment in safety, i.e., the component
with respect to safety in the composite hypothesis, the preceding
specified values of type I error rate, power, and 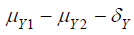 and
σY requires a total sample size NY =275.
and
σY requires a total sample size NY =275.
For many scenarios in Table 3, the total sample size N for test of the composite hypothesis is much larger than the sample size for test of non-inferiority in efficacy (NX). However, it happens in some cases that they are the same or their difference is quite small. Actually, N is associated with the sample sizes for individual test of non-inferiority in efficacy (NX) and of superiority in safety (NY), and the correlation coefficient (ρ) between X and Y. When large difference exists between NX and NY, N is quite close to the larger of NX and NY and has little change along with change in ρ . In this numerical study, for NX = 69 and 39 (<< 275), N is mostly equal to 275; for NX = 1392 and 619 (>>275), the difference between N and NX is 0 or negligible compared with the size of N. At the preceding four scenarios, change in correlation coefficient between X and Y has little impact on N. On the hand, the larger of NX and NY is not always close to N, especially when NX and NY close to each other. For example in Table 3, when both NX is equal to 275 (=NY), N is 352 for ρ =0.5, and 373 for ρ =0. In addition, the results in Table 3 suggest that the correlation coefficient between X and Y is unlikely to have great influence on N, especially when the difference between NX and NY is quite substantial. The above findings consistent with the underlying ‘rule’: when the two sample sizes are substantially different, taking N as the larger of NX and NY will ensure the powers of two individual tests for efficacy and safety is essentially 1 and 1 − β , ‘resulting’ in a power of 1 − β for test of the composite hypotheses; when NX and NY is close to each other, taking N as the larger of NX and NY will power the test of composite hypotheses at about (1 − β )2 . Therefore, a significant increment in N is required for achieving a power of 1 − β .
Fixed Sample Size Approach
Based on the sample size in Table 3, power of the test of composite hypothesis H0 were calculated with results presented in Table 3, where P is the power of test of composite hypothesis with NX in Table 3. PM is the power of the same test with max (NX, 275). With sample size NX, the power of test of composite hypothesis is always not greater than the target value 80% as NX is always not larger than N in Table 4. In some cases that σX =1.5 > σY =1.0, NX =N. Hence the corresponding P=80%. However, P is less than 60% for many cases in our numerical study. The worst scenario is P = 4.3% when NX=39 for σX =0.5, ρ =-1 ad Δ =0.4.Therefore, test of composite hypothesis of both efficacy and safety using sample size NX which is for achieving a certain power in testing hypothesis of efficacy only, may not have enough power to reject the null hypothesis. Interestingly, testing the composite hypothesis with max(NX, 275), the power PM is close to the target value 80% in most scenarios. Some exceptions happen when NX is close to 275 (corresponding to ( Δ =0.3, σX =1.0), and ( Δ =0.4, σX =1.5 )) such that a significant increment in sample size from max(NX, 275) to N is required. This suggest taking N as the larger of the two sample sizes NX and NY for testing hypothesis of individual endpoint when one of the two is much larger, say, one-fold larger than the other (Table 4).

Table 1: Significant Withdrawals of Drug Products between 2000-2010.

Table 2: Composite Hypotheses for Clinical Evaluation.
Note: N=Non-inferiority; S=Superiority; E=Equivalence

Table 3: Comparison of Sample Size between Tests for Composite Hypothesis and Single Hypothesis.

Table 4: Power (%) of Test of Composite Hypothesis.
Concluding Remarks
In clinical evaluation of a test treatment in randomized clinical trials, the traditional (conditional) approach of testing single hypothesis for efficacy alone is not efficient because the observed safety profile could be by chance alone and may not be reproducible. Thus, testing a composite hypothesis which takes both safety and efficacy into consideration (e.g., testing non-inferiority in efficacy and testing superiority of safety as compared to a control) is recommended. In practice, sample size is expected to increase when switching from a single hypothesis testing (the traditional approach) to a composite hypothesis testing for clinical evaluation of a test treatment under investigation.
For illustration purpose, in this article, we assume that both efficacy and safety data (X ,Y ) are continuous variables which follow a bi-variate normal distribution. Statistical tests were derived under the framework of bi-variate normal distribution. In practice, efficacy and safety data (X ,Y ) could be either a continuous variable, a binary response, or time-to-event data. Similar idea can be applied (i) to derive appropriate statistical test under the null hypothesis and (ii) to determine the impact on power calculation for sample size requirement when switching from testing a single hypothesis (for efficacy) to testing a composite hypothesis for both safety and efficacy [5,6]. It, however, should be noted that closed forms and/or formulas for sample size calculation and the relationships between the single hypothesis and the composite hypothesis may not exist. In this case, clinical trial simulation may be useful.
References
- Chow SC, Shao J (2002) Statistics in Drug Research – Methodologies and Recent Development. Marcel Dekker Inc, New York, USA.
- FDA (1988). Guideline for the Format and Content of the Clinical and Statistical Sections of New Drug Applications. U.S. Food and Drug Administration, Rockville MD (editor).
- Wikipedia (2010). List of withdrawn drugs.
- Chow SC, Shao J, Wang H, Lokhnygina Y (2017) Sample Size Calculation in Clinical Research. 3rd Edition, Taylor & Francis, New York, USA.
- Chow SC, Huang Z (2019) Innovative thinking on endpoint selection in clinical trials. Journal of Biopharmaceutical Statistics 29(5): 941-951.
- Chow SC, Liu, JP (2013) Design and Analysis of Clinical Trials – Revised and Expanded, 3rd Edition, John Wiley & Sons, New York, USA.


 We use cookies to ensure you get the best experience on our website.