Research Article 
![]() Creative Commons, CC-BY
Creative Commons, CC-BY
Transmission Dynamics and Control of COVID-19 Pandemic: A Mathematical Modelling Study
*Corresponding author: Chacha M Issarow, Modelling and Simulation Hub, Africa, Department of Statistical Sciences, Faculty of Sciences, University of Cape Town, South Africa.
Received: August 11, 2020; Published: September 16, 2020
DOI: 10.34297/AJBSR.2020.10.001508
Abstract
Background: The coronavirus disease 2019 (COVID-19) pandemic remains a major global public health concern. It is assumed that the COVID-19 outbreak originated in Wuhan, China and spread worldwide as a result of international travel. Here, I used data from China to assess the impact of contact rate for COVID-19 transmission and decay of transmission rate due to implemented interventions for disease control.
Method: I developed a generalized susceptible-exposed-infectious-recovered (SEIR) compartmental model based on the disease clinical progression and interventions to explore the transmission dynamics of the global COVID-19 pandemic. I computed the basic reproduction number from the model to assess the epidemiology of the disease.
Results: I found that the number of asymptomatic was higher than symptomatic cases, and that COVID19 transmission is directly linked with contact rate between infectious and susceptible individuals. It shows that at high contact rate, disease peaked in a short period of time, and doubling time decrease with increasing contact rate. The curve of COVID-19 transmission was found to flatten with increasing decay of transmission rate due to interventions that have been implemented. The basic reproduction number computed in this study without intervention at the contact rate of 1.137 day-1 was found to be 4.9976, suggesting that the number of secondary cases resulted from introduction of a single infectious individual into naive susceptible population was increasing. At the decay transmission rate of 0.02 day-1, the basic reproduction number was 0.4534 and 0.04113 at the decay transmission rate of 0.04 day-1, implying that disease can be controlled with implementation of interventions.
Conclusion: The study shows that COVID-19 transmission was amplified by high contact rates between infectious and susceptible individuals, and that asymptomatic individuals might be super spreaders of the disease. It shows that the number of cases decreases with increasing decay of transmission rate due to earlier implementation of interventions.
Keywords: Coronavirus; Basic reproduction number; Mathematical modelling
Introduction
Coronavirus disease 2019 (COVID-19) is a major public health concern worldwide [1,2]. It is not well understood how the COVID-19 outbreak started and became the global pandemic as declared by the World Health Organization (WHO). However, it is assumed that COVID19 originated from seafood market in Wuhan, Hubei province in China where the outbreak began [3]. At the beginning of the outbreak, it was assumed that COVID-19 was only transmitted from animal-to-human, and that there was no proof of huma-to-human transmission. Apart from animal-to-human transmission as suggested previously, epidemiological data show that COVID-19 is transmitted by aerosols from human-to-human through breathing, talking, coughing and sneezing. The first case of COVID-19 was confirmed in December 2019 in the city of Wuhan and exported to many other countries worldwide as a result of international travel from Wuhan and mainland China [4,5]. Many countries therefore banned international travel from China and implemented national lockdown to limit the spread of COVID-19. It is crucial to understand the transmission dynamics of the infection in the early stages of a new infectious disease outbreak. However, since COVID-19 is a novel coronavirus, many countries might have delayed implementing interventions while trying to understand how the virus is transmitted and how to deliver treatment to infected individuals.
Previously, two other novel coronaviruses emerged as major global health threats, namely severe acute respiratory syndrome coronavirus (SARS-CoV) that spread to 37 countries causing more than 8000 infections and 800 deaths, and Middle East respiratory syndrome coronavirus (MERS-CoV) that spread to 27 countries causing more than 2494 infection and 858 deaths worldwide [6,7]. According to Johns Hopkins University, from December 30, 2019 to July 29, 2020, COVID-19 has spread in 188 countries with a total number of more than 16,747,268 confirmed cases and 660,593 deaths worldwide, indicating that COVID-19 might be more virulence and contagious than any other novel coronavirus.
Estimating the contact rates that can result in transmission provides insights into the infectious disease epidemiology [8,9] and enables us to assess whether the outbreak intervention measures have had an impact [10,11]. Furthermore, this can help to understand the risk of the disease to other countries [12] and inform design of interventions for disease control [5]. However, delay in appearance of symptoms due to the incubation period or asymptomatic carriers and delay in case confirmation due to detection and testing capability are just some of the challenges for disease control [13]. I used data from Wuhan and mainland China to assess the potential impact of contact rate for COVID-19 transmission and decay of transmission rate due to interventions implemented for disease control in other countries outside China using a mathematical modelling approach. Additionally, I computed the basic reproduction number (R0) from the model to assess the transmission dynamics and control of the COVID-19 pandemic.
Methods
Model design and development
To explore the transmission dynamics of the global COVID-19 pandemic, I developed a generalized susceptible-exposedinfectious- recovered (SEIR) compartmental model based on the disease clinical progression and interventions, such as home quarantine and hospital isolation (Figure 1). In the model design in terms of interventions, I made real-world assumptions that proportions of exposed-susceptible, exposed (latent) and asymptomatic individuals are quarantined at home, and that severe symptomatic, critical symptomatic and quarantined individuals who develop severe or critical symptoms become hospitalized. I parameterized the model using data from published studies that used data of confirmed cases of COVID-19 [14]. I computed the basic reproduction number using a next generation matrix approach to assess disease transmission. In the design of the model, I stratified the populations as susceptible individuals (S) who are at a high risk but not yet infected, exposed individuals (E) who are latently infected but not infectious, home quarantined individuals, including exposed-susceptible, exposed (latent) and asymptomatic or with mild infection but not yet severe or critical symptomatic (Q). Furthermore, I included asymptomatic individuals (Ia) who are infectious but with no symptoms, severe symptomatic individuals (Is) who are infectious with symptoms and may require oxygen, critical symptomatic individuals (Ic) who are infectious with symptoms and may require ventilation, hospitalized individuals (H) who are either critically or severely ill and recovered individuals (R) (Figure 1).
Based on the design of the model (Figure 1), recruitment due to either migration or birth move to a susceptible state at a rate Λ. Susceptible individuals are infected at a rate λ, which is the force of infection. A proportion of susceptible individuals, b become latently infected and move to an exposed state, and another proportion, 1-b is quarantined at home as a result of contact tracing. Exposed or latently infected individuals develop disease at a rate θ, of which 80% become asymptomatic, 15% severely symptomatic and 5% critically symptomatic infected individuals as suggested by the World Health Organization (WHO)0020[1,15]. Additionally, based on contact tracing, exposed individuals become home quarantined at a rate q. Asymptomatic or individuals with mild symptoms become quarantined at rate r or recover at a rate f. Home quarantined individuals move to hospital isolation at a rate x if they become either severely or critically infected. Severely infected individuals become either hospital isolated at a rate z or recover at a rate y. Critically infected individuals move to either a hospitalized state at a rate ω or a recovered state at a rate k. Hospitalized individuals with either severe or critical infection recover and move to recovered state at a rate δ. I assume that natural death occurs in all compartments at a rate μ, and death rate due to disease (d) occurs in asymptomatic, severe, critical and hospitalized states. Since the waning period of acquired immunity for COVID-19 is not well known, I assumed that recovered individuals become immune.
From the model in Figure 1, I developed the mathematical model as follows:
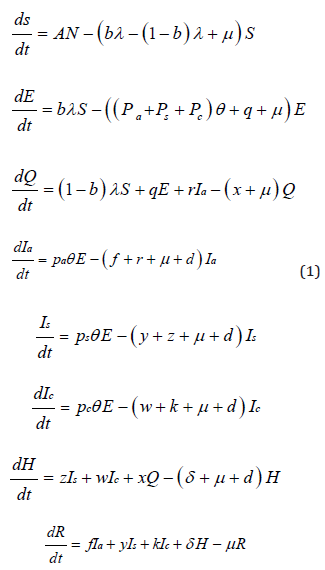
where λ is the force of infection, such that
 denotes the contact rate between infectious and susceptible individuals, N is the total
number of population, m is the decay of transmission rate due
to interventions implemented and t is the time interval since
disease outbreak. The model was simulated stochastically using
denotes the contact rate between infectious and susceptible individuals, N is the total
number of population, m is the decay of transmission rate due
to interventions implemented and t is the time interval since
disease outbreak. The model was simulated stochastically using  where β0 denotes the amplitude. M was assumed to be equal to zero if no interventions implemented.
Basic reproduction number
The basic reproduction number (R0) is the most important quantity in the predition of infectious disease epidemiology. If R0>1 it means disease transmission is increasing, and if R0<1 disease transmission is decreasing and it can be controlled [3,5].
In Equation 1, there are six infected states of E, Q, Ia, Is, Ic and H and I focused on a six-dimensional infected subsystem to compute the basic reproduction number using a next generation matrix approach. The transmission (G) and transition (V ) matrices of the linearized subsystem at disease free equilibrium, (S,E,Q,Ia,Is,Ic,H,R) = (N,0,0,0,0,0,0,0), are
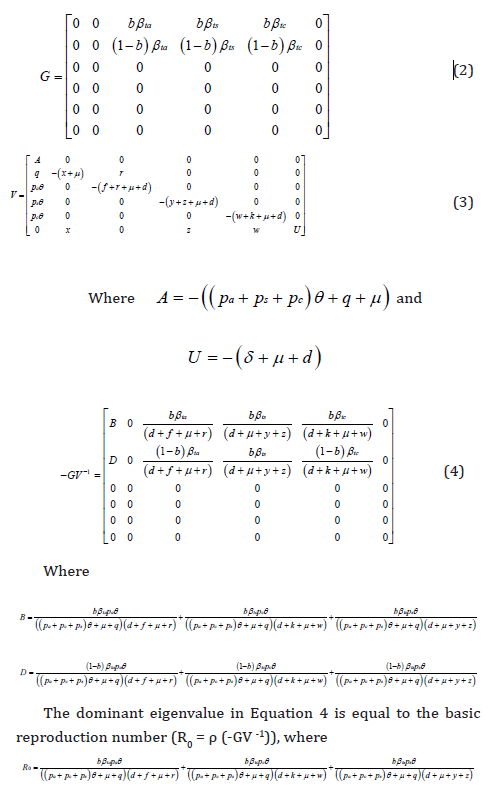
I computed the value of the basic reproduction number at the contact rate of 1.137day-1. by fitting the parameters values in Table 1 into Equation 5 and found that R0 = 4.9976 when the decay of transmission rate due to an implemented intervention, m = 0day-1, suggesting that disease transmission is increasing. Furthermore, I found that R0 = 0.4534 at the decay transmission rate, m = 0.02day- 1 and R0 = 0.04113 at the decay transmission rate, m = 0.04 day-1 implying that disease transmission can be controlled (Table 1).
Results
Contact rate defined as the number of contacts per unit time between infectious and susceptible individuals plays an important role in COVID-19 transmission. Figure 2 simulated from Equation 1 with varying contact rates (β = 1.137 -14.781 day-1) without interventions (e.g. transmission decay rate, m = 0 day-1) shows that COVID-19 transmission is directly linked with contact rate between infectious and susceptible individuals, suggesting that the number of cases increases with increasing contact rate. Additionally, at high contact rate, the disease peaks in a shorter period of time, for example at the contact rate of 1.137 day-1 disease peaked approximately 70 days, 2.192 day-1 peaked in 40 days, 5.356 day-1 peaked in 20 days and 14.781 day-1 peaked 10 days after initial infection. It shows that doubling time decrease with increasing contact rate (Figure 2). Additionally, Figure 2 shows that if effective interventions are not implemented, the second wave of COVID-19 is inevitable. It shows that the second wave of COVID-19 is linear proportional to the contact rate in the absence of interventions.
Figure 3 simulated at the constant contact rate of 5.356 day-1 with varying decay of transmission rates due to implemented interventions (m = 0.02-0.08 day-1) shows that implementation of effective interventions flatten the curve of the disease and prevents an occurrence of the second wave. It shows that earlier implementation of intervention amplifies the decay of transmission rate and the number of cases decreases. This implies that some countries managed to contain COVID-19 transmission by implementing interventions earlier at the time of disease outbreak. This study shows that effective interventions or a combination of more than one intervention flattens the curve faster than single intervention, for example, combination of mitigation [16].

Figure 1: Coronavirus disease 2019 (COVID-19) model. S = susceptible, E = exposed, Q = home qurantined, Ia = asymptomatic or mild, Is = severe symptomatic, Ic = critical symptomatic, H = hospitalized, R = recovered. Other parameters are described in Table 1.

Figure 2: Impact of contact rate for COVID-19 transmission with delayed interventions or when decay of transmission rate due to implemented interventions, m=0.

Figure 3: Showing that COVID-19 transmission decreases with increasing intervention. m denotes the decay of transmission rate due to implemented interventions.
The number of exposed individuals was observed to be the highest when transition time (incubation period) from infection to disease is estimated to be between 2 and 14 days. In this study, incubation period in this group (exposed) was estimated to be 5.1 days before transition to either asymptomatic or symptomatic disease (Table 1). Since incubation period seems to be long time, this group might be spreading disease before showing symptoms. The number of asymptomatic cases was observed to be higher than severe and critical symptomatic cases, suggesting that the vast majority of COVID-19 might be asymptomatic. Since they do not show any symptoms and interact with susceptible individuals on a daily basis, asymptomatic cases might be super-spreaders of the disease in the community. Many countries have implemented contact tracing and mass testing, but asymptomatic individuals may have been missed and the spread of the disease continued increasing. The number of severe and critical symptomatic individuals were observed to be lower than home quarantined and hospitalized individuals probably because the majority of severely and critically ill patients might be hospitalized as they may require oxygen or ventilation.

Table 1: Description of parameters and values used in the model development and simulation of the COVID-19 model.
The basic reproduction number computed in this study (Equation 5) at the contact rate of 1.137 day-1 was found to be 4.9976 without vaccination implementation, suggesting that the expected number of secondary cases resulted from introduction of a single infectious individual into susceptible population was increasing. Furthermore, I found the basic reproduction number of 0.4534 at the decay transmission rate of 0.02day-1 and 0.04113 at the decay transmission rate of 0.04 day-1 implying that disease can be controlled. This reflect the fact that implementation of effective interventions has a high impact on disease control and elimination.
Discussion
This study shows that COVID-19 transmission increases with increasing contact rate between infectious and susceptible individuals. This is reflected in the fact that many healthcare workers became infected and some died from COVID-19 in several countries due to high contact rate with infectious individuals at healthcare facilities. For example, regardless of wearing personal protective equipment (PPE), such as surgical marsks, it has been reported number of infections and deaths from COVID-19 among healthcare workers in working environments in Italy, China, UK, US, South Africa and many other countries.
The possibility of acquiring COVID-19 is linearly proportional to the contact rate between infectious and susceptible individuals. It is generally believed that social distancing of 2 m is a safe distance and many countries have implemented such social distancing. However, since COVID-19 is an airborne infectious disease as declared by the WHO, it can be transmitted up to a distance of 6 m through coughing and 8 m through sneezing, which makes the disease more complex for implemented preventive measures. Based on this notion, social distancing of 2 m may be regarded as safe, especially if wearing masks, since COVID-19 transmission cannot occur at this distance through breathing and talking. Social distancing remains a challenge in congregate settings, such as healthcare settings and schools with high number of interactions.
The basic reproduction number computed in this study without intervention at the contact rate of 1.137 day-1 was found to be 4.9976, suggesting that the number of secondary cases resulted from a single infectious individual introduced into susceptible population was increasing. Additionally, when intervention was implemented, I found the basic reproduction number of 0.4534 at the decay transmission rate of 0.02day-1 and 0.04113 at the decay transmission rate of 0.04 day-1 implying that disease transmission can be decreased.
Here, I have shown that implementation of effective interventions has high impact for disease control by amplifying the decay of transmission rate (Figure 3). This implies that implementation of more than one intervention, such as combination of mitigation may flatten the curve faster than a single intervention [16]. Many countries have implemented some interventions to combat COVID-19 transmission, such as social distancing, national lockdown, contact tracing and mass testing. However, regardless of these preventive measures, COVID-19 remains a public health and economic threat worldwide [17]. I found the number of symptomatic to be smaller than asymptomatic cases, suggesting that infected individuals might not have been identified and remain as super-spreaders in the community.
Competing interest
The author declares no competing interests.
Acknowledgement
I would like to thank the Fogarty Program for research training. Research reported in this publication was supported by the Fogarty International Center of the National Institutes of Health under Award Number D43 TW010559. The content is solely the responsibility of the author and does not necessarily represent the official views of the National Institutes of Health.
References
- Coronavirus disease 2019 (COVID-19) Situation Report-46.
- Lin Q, Zhao S, Gao D, Lou Y, Yang S, et al. (2020) A conceptual model for the coronavirus disease 2019 (COVID-19) outbreak in Wuhan, China with individual reaction and governmental action. Int J Infect Dis 93: 211-216.
- Chen TM, Rui J, Wang QP, Zhao ZY, Cui JA, et al. (2020) A mathematical model for simulating the phase-based transmissibility of a novel coronavirus. Infect Dis Poverty 9(1): 1-8.
- Epidemiological Data from the nCoV-2019 Outbreak: Early Descriptions from Publicly Available Data.
- Kucharski AJ, Russell TW, Diamond C, Liu Y, Edmunds J, et al. (2020) Early dynamics of transmission and control of COVID-19: a mathematical modelling study. The lancet infectious diseases.
- Wu JT, Leung K, Leung GM (2020) Nowcasting and forecasting the potential domestic and international spread of the 2019-nCoV outbreak originating in Wuhan, China: a modelling study. Lancet 395(10225): 689-697.
- Huang C, Wang Y, Li X, Ren L, Zhao J, et al. (2020) Clinical features of patients infected with 2019 novel coronavirus in Wuhan, China. Lancet 395(10223): 497-506.
- Camacho A, Kucharski A, Aki Sawyerr Y, White MA, Flasche S, et al. (2015) Temporal changes in Ebola transmission in Sierra Leone and implications for control requirements: a real-time modelling study. PLoS Curr 7.
- Issarow CM, Mulder N, Wood R (2017) Impact of effective contact rate and post treatment immune status on population tuberculosis infection and disease using a mathematical model. F1000Research 6(1817): 1817.
- Funk S, Ciglenecki I, Tiffany A, Gignoux E, Camacho A, et al. (2017) The impact of control strategies and behavioural changes on the elimination of Ebola from Lofa County, Liberia. Philos Trans R Soc Lond B Biol Sci 372(1721): 20160302.
- Riley S, Fraser C, Donnelly CA, Ghani AC, Abu Raddad LJ, et al. (2003) Transmission dynamics of the etiological agent of SARS in Hong Kong: impact of public health interventions. Science 300(5627): 1961-1966.
- Cooper BS, Pitman RJ, Edmunds WJ, Gay NJ (2006) Delaying the international spread of pandemic influenza. PLoS Med 3(6): e212.
- Aylward B, Barboza P, Bawo L, Bertherat E, Bilivogui P, et al. (2014) Ebola virus disease in West Africa–the first 9 months of the epidemic and forward projections. The New England journal of medicine 371(16): 1481-1495.
- Lauer SA, Grantz KH, Bi Q, Jones FK, Zheng Q, et al. (2020) The incubation period of coronavirus disease 2019 (COVID-19) from publicly reported confirmed cases: estimation and application. Ann Intern Med 172(9): 577-582.
- Report of the WHO-China Joint Mission on Coronavirus Disease 2019 (COVID-19).
- Ferguson NM, Laydon D, Nedjati Gilani G (2020) Impact of non-pharmaceutical interventions (NPIs) to reduce COVID-19 mortality and healthcare demand. London: Imperial College, 2020. A conflict of interest statement.\
- Tang B, Wang X, Li Q, Bragazzi NL, Tang S, et al. (2020) Estimation of the transmission risk of the 2019-nCoV and its implication for public health interventions. J Clin Med 9(2): 462.


 We use cookies to ensure you get the best experience on our website.