Opinion 
![]() Creative Commons, CC-BY
Creative Commons, CC-BY
On Random Center Grouping in Multicenter Clinical Trials
*Corresponding author: Weijia Mai, Department of Biostatistics and Bioinformatics, Duke University School of Medicine, 2424 Erwin Road, Hock Suite 1102, Durham, North Carolina.
Received: January 12, 2021; Published: January 26, 2021
DOI: 10.34297/AJBSR.2021.11.001667
Abstract
With the attention of achieving desired power within a pre-specified timeframe in clinical development, a multicenter trial is often conducted to expedite the patient recruitment. However, a multicenter trial with plethoric number of centers is very likely to result in numerous small centers, which will cause the problem of treatment imbalance (unequal number of patients per arm within a center) and/or center imbalance (a few large centers with a number of small centers). In practice, treatment imbalance within and between centers inevitably occurs regardless the randomization models and/or methods used. Treatment imbalance within center and/or center imbalance will not only (i) increase the probability of observing treatment-by-center interaction, but also (ii) decrease the power for detecting clinically meaningful difference (or treatment effect) of the test treatment under investigation. In this paper, we propose a method of determining whether an observed significant interaction is a false alarm and a method of random grouping for an unbiased and reliable assessment of treatment effect when significant treatment and center imbalance are observed. The impact of treatment and center imbalance will also be examined in terms of the potential loss of power.
Keywords: Treatment Imbalance; Center Imbalance; Treatment-by-Center Interaction; Simple Sampling without replacement
Introduction
As indicated in the 1988 guidance entitled Guideline for the Format and Content of the Clinical and Statistical Sections of New Drug Applications published by the United States Food and Drug Administration (FDA), adequate clinical trials need to be conducted in good control in order to provide ample evidence of the safety and effectiveness for endorsement of a new medication. In practice, a multicentered, randomized, well-controlled clinical trial is often considered for this purpose. When multiple clinical trials are concurrently conducted at various centers but follow the same protocol, these single trials can be viewed together as a single study called a multicenter trial. With the intention of achieving desired power within a pre-specified timeframe in clinical development, a multicenter trial is often performed to speed up the patient recruitment. There are two main purposes of using a multicenter clinical trial in clinical development: Firstly, it is to show that the clinical results are duplicable and not happening by chance from center to center. Secondly, it is to illustrate that the clinical results can be generalized to populations from different geographical locations. However, the occurrence of redundant small centers may result in treatment imbalance and center imbalance, which consequently cause treatment-by-center interaction and make it difficult for us to combine the centers for an overall assessment. In practice, it is suggested that appropriate statistical tests for treatment-by-center interaction should be performed.
As indicated in Chow and Liu [1], a multicenter trial is not equivalent to separate single- site trials, since the purpose is to gather data from different centers together and make an overall analysis. It is suggested that proper statistical tests for homogeneity across centers should be conducted to check possible quantitative or qualitative treatment-by-center interactions [2,3] before grouping data for an overall assessment of safety and effectiveness of the study medication. When significant treatment effect differences occur in different directions across centers, a qualitative interaction is said to occur. Whereas when the treatment differences are with different magnitude but still in the same direction across centers, a quantitative interaction, which is relatively less important comparing to qualitative interaction [4] is said to occur. Also, as pointed out by Guohua and Douglas (1997), an overall statistical inference regarding the treatment effect is not valid to be made if there is a substantial qualitative interaction between treatment and center, in which case that centers cannot be grouped, and the treatment effect must be assessed by study center.
For a multicenter trial, [5] posted the several questions, which are helpful for the design and analysis of multicenter trials. The first one is whether the existence of extremely small centers will affect the reliability of separate interpretation of results. Another helpful one is in contrast to the first question, which is whether large centers with large number of data will dominate the results of analysis. Moreover, whether there exist outliers in results is also an important question. Finally, is the question that we care most about, which is whether treatment-by-center interaction will cause the trial to be invalid. In this paper, however, our focus will be placed on statistical evaluation of random center grouping when a multicenter trial results in a number of small centers. In this paper, we propose a method of determining whether the observed significant treatment-by-center is a false alarm (which may be due to too many small centers) through center grouping based on the optimal selection of number proposed by [8]. Following Shao and Chow [8] idea, we also propose a method of random center grouping to handle the issue of treatment and center imbalance.
In the next section, following the idea of two-stage sampling strategy proposed by Shao and Chow (1993) [8] a rule of thumb for optimal selection of the number of centers is proposed. Section 3 discusses the impact of treatment imbalance on statistical power for testing treatment effect. Section 4 illustrates the use of center grouping for determining whether the observed significant treatment-by-center interaction (as a result of too many small centers) is a false alarm. In Section 5, we propose a method for center grouping when the multicenter trial results in a number of small centers followed by a simulation study of power change. The method utilizing random center grouping is proposed in Section 6. Section 7 compares the two methods of center grouping. An example concerning a multicenter trial for treating patients with breast cancer is given in the Section 8 to illustrate the application of the proposed methods. Discussions and concluding remarks are given in the last section.
The Selection of The Number of Centers
As mentioned in the previous section, one purpose of multicenter trial is to reduce the time consumption of patient recruitment process. The more the centers, the sooner the recruitment process and hence the quicker the study would be completed. Nevertheless, more centers would certainly result in small centers (i.e., fewer patients in each center).
Since for comparative clinical trials, comparisons are made between patients within the same center to test the treatment effects, if the number of patients in each center is too small, the assessments and inferences made may be statistically invalid and biased. We thereby intend to combine the data of small centers to form a larger dummy center. Nevertheless, it is required by both FDA and ICH guidelines that statistical tests for homogeneity across centers must be conducted in order to check for the existence of significant treatment-by-center interaction before pooling data. Therefore, under the situations where a qualitative treatmentby- center interaction is observed and tested to be significant, the sponsor may be required to examine the treatment effect of each center independently instead of pooling together due to statistical invalidation.
The increase in number of centers will certainly increase the chance for significant qualitative treatment-by-center interaction to occur, especially when both large and small centers exist.
The observed statistical significance may be due to two following reasons [9]:
Heterogeneity among centers: Some centers exhibit relatively large variability.
Heterogeneity across centers: Some centers do not constitute a representative sample of the target patient population.
Accordingly, the way to determine the optimal number of
centers is noteworthy for investigators. However, for simplicity
and convenience, centers are often grouped without considering
from statistical perspective in many multicenter trials. The method
of random grouping in this paper will based on the idea regarding
two-stage sampling strategy in clinical trials proposed by Shao and
Chow [8], we propose the following rule of thumb for selection
of the number of centers given that the total sample size of the
intended trial is N. We propose the rule of thumb that the number
of patients in each center should be at least equal to the number
of centers for achieving optimal statistical properties for treatment
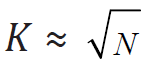
assessment. Thus, if the intended clinical trial calls for 𝑁 patients in total, it is suggested that around  study centers with around
patients in each be selected for achieving optimal statistical
properties for treatment assessment.
study centers with around
patients in each be selected for achieving optimal statistical
properties for treatment assessment.
The Impact of Treatment Imbalance on Power
Without loss of generality, consider a multicenter clinical trial with two treatments. In practice, sample size is often chosen for the purpose of detecting clinically meaningful significance at prespecified significance level with a desired power [10].
Under the assumption of normality, sample size of a balanced trial (i.e., same number of patients in each arm) is often calculated by:

with a power of
where the standard deviation of the random error is written as 𝜎, 𝑧𝛼 represents 𝛼𝑡ℎ quantile of a standard normal distribution, and Δ means the difference of clinical importance.
Since under normal distribution, the part 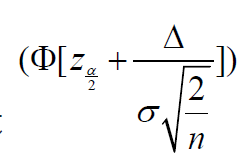 is very
small and negligible, for simplicity, the power can be rewritten as
follows
is very
small and negligible, for simplicity, the power can be rewritten as
follows
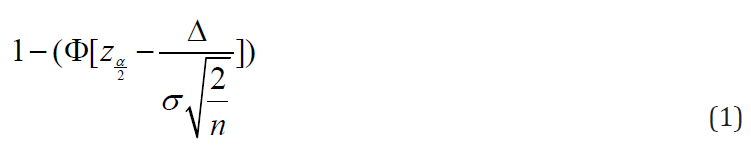
This expression of power is obtained by neglecting both center effect and the effect due to treatment and center interaction, hence is the optimal power that we can possibly get.
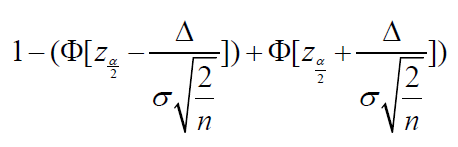
Treatment imbalance (i.e., different number of patients in each arm) is sometimes inevitable in spite of the plans of having treatment groups of same size, which may therefore cause differences among centers. Under these circumstances, the expression of power becomes

which is obviously less than the power of balanced trial. Hence in order to achieve the optimal power as shown in (1), we set (1) and (2) to be equal, which leads to
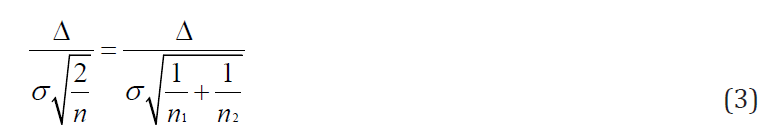
It is clearly that even if the sample size 𝑁 is fixed, 𝑛𝑖 , 𝑖 = 1,2, are not fixed, since we are not able to predict how many patients will
be in each center after the completion of the trial. Thus, from (3) we
can know that increasing total sample size 𝑁 is the only way to make the equation true (i.e., to achieve optimal power) when variance 𝜎 is assumed to be unchanged. It is noteworthy that the variance of
the test statistic calculated with equal number of patients in each
center will be the same as if it is a single center trial. Hence, the
minimum variance of test statistics is achieved since 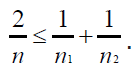 .
.
Interaction Detection Using Center Grouping
Statistical test for homogeneity across centers is the most common way to detect potential interaction between treatment and center, however, center grouping provides another way of doing this.
Suppose there are 5 centres: 3 small ones with 4, 4 and 2 patients respectively, 2 large ones with 12 and 10 patients respectively. Following are two different scenarios:
Scenario 1: As we can see from figure 1, the result of one small center is different from others, which possibly cause significant interaction. One way to check the significance of interaction is to do the F test, and we can get the following table 1, from which we know that the interaction is significant as p value is less than 0.05. Now we combine the first 3 small centers and remark them as center 1, center 4 and 5 will remain the same and be remarked as center 2 and 3. The effects after center grouping is as following figure 2 shows, which matches with the conclusion that we drew from the F test result since interaction still exists after center grouping.

Figure 1: Plot of treatment effects before grouping.

Figure 2: Plot of treatment effect after grouping.

Table 1: Results of interaction test.
Scenario 2: In this scenario, there is again one small center provides opposite trend compared to other centers, and cause interaction to occur, which can be seen in figure 3. Then by conducting F test, we get the following results which suggest that there is no significant interaction (table 2). Again, we combine the three small centers and do the analysis, figure 4 illustrates that the interaction disappears after center grouping, which matches with the outcome of F test. Thereby we conclude that the method of detecting interaction using center grouping is valid, and if the interaction disappears after grouping, we are then able to make a general assessment of the drug across centers.

Figure 3: Plot of treatment effect before grouping.

Table 2: Results of interaction test.

Figure 4: Plot of treatment effect before grouping.
Center Grouping
Without loss of generality, consider this two-way factor random effects model [6]:
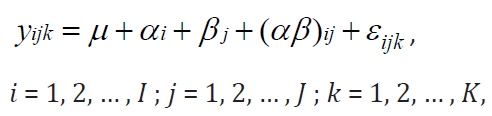
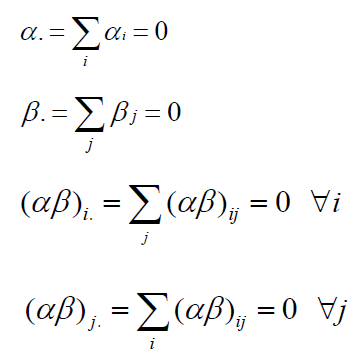
where 𝜇 is the general mean, 𝛼𝑖 = 𝐴𝑖 − 𝜇 is the main effect of the 𝑖𝑡ℎ level of 𝐴 with 𝐴𝑖 to be the fixed effect due to the 𝑖𝑡ℎ treatment (factor A), 𝛽𝑗 = 𝐵𝑗 − 𝜇 is the main effect of the 𝑗𝑡ℎ level of 𝐵 with 𝐵𝑗 to be the random effect due to the 𝑗𝑡ℎ center (factor B). We then define 𝜇𝑖𝑗 to be the cell mean and thereby define random effect due to interaction to be (𝛼𝛽)𝑖𝑗 = 𝜇𝑖𝑗 − 𝜇 − 𝛼𝑖 − 𝛽𝑗. Following are some constraints on this model:
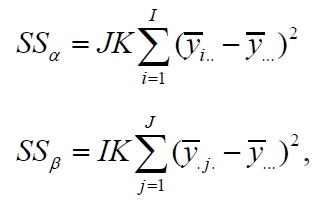
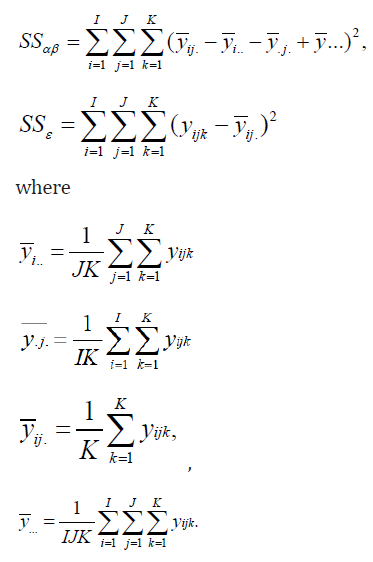
Both αi , βj are independently identically normally distributed with variance σ2A and σ2B and 𝜖𝑖𝑗𝑘 is the random error which is also independently identically normally distributed with mean 0 and variance 𝜎2 [7]. Then as indicated in Scheffé (1959), the sum of squares is calculated as follows:
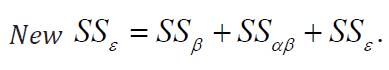
If centers (factor B) are combined, then it is easy to show that the new ssε becomes
Therefore, we can get
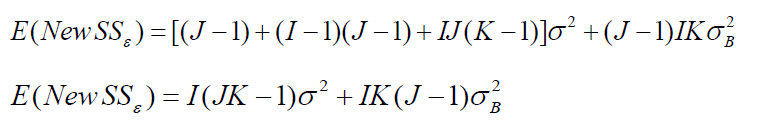
which implies that
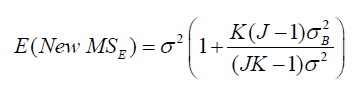
From these expressions, we make following conclusions. First,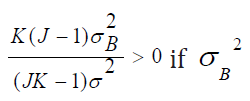 is not 0. Meanwhile,
 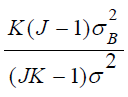 increases as number of centers (𝐽) being combined increases, and
 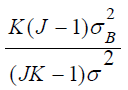 also depends upon the similarity of centers (
 ) being combined.
Based on this expression, it can be deduced that the change in 𝑀𝑆𝐸
might depend on not only 𝐼, 𝐽, 𝐾, but also on the ratio of
) being combined.
Based on this expression, it can be deduced that the change in 𝑀𝑆𝐸
might depend on not only 𝐼, 𝐽, 𝐾, but also on the ratio of  . Before
combining the J centers, the treatment effect can be tested by
. Before
combining the J centers, the treatment effect can be tested by
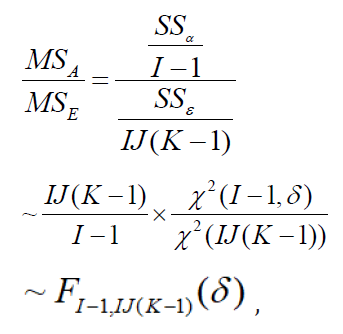
which follows a non-central F distribution under alternative
hypothesis with non-centrality parameter 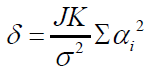 and
degrees of freedom 𝐼 − 1 and 𝐼 𝐽 (𝐾 − 1).
and
degrees of freedom 𝐼 − 1 and 𝐼 𝐽 (𝐾 − 1).
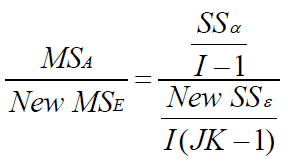
After grouping, we can test the treatment effect by using the new 𝑆𝑆𝜖:
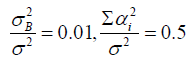
We used simulation based to 20,000 iterations to generate
tables illustrating the power before and after center grouping. As
discussed above, since 𝐼, 𝐽, 𝐾, the ratio  and 𝛿 might affect the test results, we change these values and summarized the results of
power analysis in (Table 3-5). When conducting simulations, 𝜎2 is
set to be 1, σ2A
and σ2B are then set according to the ratios. In the
tables, 𝑝1 denotes the power before grouping, 𝑝2
and 𝛿 might affect the test results, we change these values and summarized the results of
power analysis in (Table 3-5). When conducting simulations, 𝜎2 is
set to be 1, σ2A
and σ2B are then set according to the ratios. In the
tables, 𝑝1 denotes the power before grouping, 𝑝2
denotes the power after grouping, which is the power within
each dummy center. The relative improvement is demonstrated by 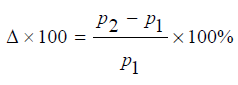
Since even combining some small centers into a dummy center can have power increased, then it is certain that by grouping all dummy centers together, we can get a power which is significantly higher than before. We can thereby use the relative improvement in power as an indicator of the center grouping effect, and we aim to combine centers in the manner of reaching maximum Δ.
From Tables 3-5, following statements can be concluded:
A. Power can increase significantly if the small centers are
properly grouped.
B. Maximum power increase in percentage (Δ) can be reached by
making appropriate choice of the number of centers in each
dummy center (𝐽) if sample size per arm (𝐾) of small centers is fixed.
C. Under some circumstances with certain simulated data,
however, power may also decrease after center grouping.

Table 3: Power Comparison.

Table 4: Power Comparison.

Table 5: Power Comparison.
Random Center Grouping
As mentioned above, the power of dummy centers could be higher than that of smaller centers, hence it is suggested to group these smaller centers together with the goal of increasing power. Since we would like to keep the generalizability of multicenter trial, it is not a good choice to group by geographical location although it is the easiest way to think of. The reason for this is that efficacy varies significantly between population groups with different demographic factors such as culture, environment, and income, therefore it is a better idea to group patients with different demographic factors together to remove the heterogeneity in results caused by these differences. It is recommended to form dummy centers by grouping small centers randomly, since the outcomes many be invalid with non- random center grouping [9]. We know that generally, the between-center variability can be evaluated by considering the following equation
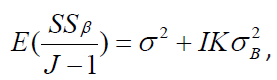 , therefore, we argue that achieving an
unbiased estimate for
, therefore, we argue that achieving an
unbiased estimate for  means that the randomization
is valid. Assume we would like to group 𝐽 small centers into some dummy centers each consists of 𝑛 small centers, we propose the following randomization method and believe it to be valid. First of
all, randomly permutate the index 𝑗 = 1, … , 𝐽 into 𝑗1, 𝑗2, … , 𝑗𝐽. Then we
assign first 𝑛 indices in 𝑗1, 𝑗2, … , 𝑗𝐽 to the first dummy center (Chow,
2011) and similar procedure for the rest dummy centers.
means that the randomization
is valid. Assume we would like to group 𝐽 small centers into some dummy centers each consists of 𝑛 small centers, we propose the following randomization method and believe it to be valid. First of
all, randomly permutate the index 𝑗 = 1, … , 𝐽 into 𝑗1, 𝑗2, … , 𝑗𝐽. Then we
assign first 𝑛 indices in 𝑗1, 𝑗2, … , 𝑗𝐽 to the first dummy center (Chow,
2011) and similar procedure for the rest dummy centers.
It is obvious that the above method for randomization is simple
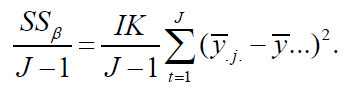
random sampling without replacement, hence according to [9], the mean of each center  within the dummy center can
be regarded as a simple random sampling without replacement
from a population of 𝐽 small centers each with mean 𝑦̅.𝑗., 𝑗 = 1 , … , 𝐽 .
Thus, the sum of squares within each dummy center can be written
as
within the dummy center can
be regarded as a simple random sampling without replacement
from a population of 𝐽 small centers each with mean 𝑦̅.𝑗., 𝑗 = 1 , … , 𝐽 .
Thus, the sum of squares within each dummy center can be written
as

Therefore  can be used to estimate
  . Lohr
(1999) proved that given
. Lohr
(1999) proved that given 
is an unbiased estimator for
Thus,
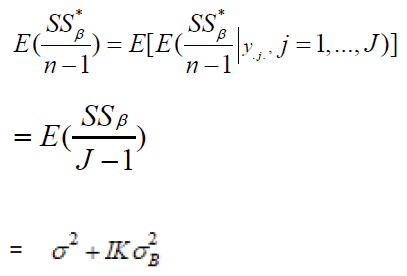
Thus, the randomization procedure that we proposed for center grouping is valid.
Procedure for Random Center Grouping
In this section, we will introduce two methods for random center grouping based on the idea of selecting an optimal number of centers for achieving optimal statistical properties for treatment assessment in multicenter trials proposed by Shao and Chow (1993). The proposed method under two scenarios is summarized below.
Scenario 1
Step 1: From the rule of thumb proposed by Shao and Chow
(1993), we start with the optimal selection of approximately
study centers with approximately patients in each center
if there are 𝑁 patients in total. Hence the first step is to calculate the value of to see around how many patients is optimal for a
center to have and how many centers should we have.
Step 2: Let 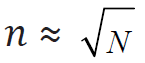 be optimal number of patients per center,
 be the optimal number of centers such that 𝑁 = 𝑛K. Then
the study sites with number of patients greater than or equal to
𝑛, or not much less than 𝑛 will retain and suppose the number of retained centers is 𝐾1. The remaining 𝐾𝑝𝑟𝑒𝑛𝑒𝑤 = 𝐾𝑝𝑟𝑒 − 𝐾1 centers
should be randomly grouped into 𝐾2 = 𝐾− 𝐾1 dummy centers if 𝐾𝑝𝑟𝑒
is the number of centers before grouping.
be the optimal number of centers such that 𝑁 = 𝑛K. Then
the study sites with number of patients greater than or equal to
𝑛, or not much less than 𝑛 will retain and suppose the number of retained centers is 𝐾1. The remaining 𝐾𝑝𝑟𝑒𝑛𝑒𝑤 = 𝐾𝑝𝑟𝑒 − 𝐾1 centers
should be randomly grouped into 𝐾2 = 𝐾− 𝐾1 dummy centers if 𝐾𝑝𝑟𝑒
is the number of centers before grouping.
If 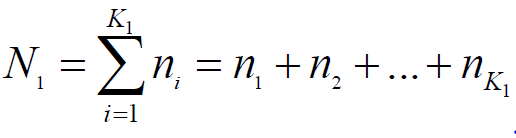 is the total number of patients
in the retained centers, then 𝑁2 = 𝑁 −𝑁1 would be the total number
of patients in the centers which need to be grouped. Hence,
is the total number of patients
in the retained centers, then 𝑁2 = 𝑁 −𝑁1 would be the total number
of patients in the centers which need to be grouped. Hence, 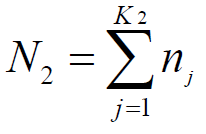 and it is optimal that we can have
 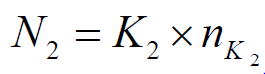 which means that all dummy centers have the same number of
patients
which means that all dummy centers have the same number of
patients  . However, the exact value of 𝐾2 should be determined
using the tables like Table 1-3, since we would like to maximize the
power increase.
. However, the exact value of 𝐾2 should be determined
using the tables like Table 1-3, since we would like to maximize the
power increase.
Scenario 2
Step 1: Step one here is the same as step one of Scenario 1.

Table 6: Comparison between two scenarios.
Step 2: Let be optimal number of patients per center,
be the optimal number of centers such that N=nK. Then
if some study sites have number of patients much greater than 𝑛, then these centers will retain and suppose the number of retained
centers is 𝐾1. The remaining 𝐾𝑝𝑟𝑒𝑛𝑒𝑤 = 𝐾𝑝𝑟𝑒 − 𝐾1 centers should be
randomly grouped into dummy centers such that the size of study
site after grouping is approximately equal to the size of retained
centers so that the overall power can be increased as mentioned
in the previous section. Similarly, the exact number of dummy
centers should be determined using tables like (Table 3-5) in
order to achieve a maximum increase in power. Following is a table
comparing the advantages and disadvantages of these two methods
(Table 6).
An Example
Here is a demonstration of the proposed method for doing center grouping in multicenter trials with the existence of small centers. The example used here is a real clinical trial testing a drug against placebo for treating patients with metastatic breast cancer, where the trial is comparative, parallel-group, randomized, and double-blinded. In the study protocol, 288 patients should be recruited in approximately 43 centers so that the desired statistical power for evaluation can be achieved, and therefore each center should have 6 to 7 patients. Although the 43 centers speeded up the patient recruitment process, 7 centers had more than 10 patients in each while the other 36 centers enrolled less than 10 patients each, which cause a significant variation among centers. In consequence, it is essential for these small centers to be grouped into dummy centers with similar size not only to address Lewis’ questions [5] but also to make an unbiased and reliable assessment on safety and efficacy of the test drug.
Since 288 patients in total suggests that √288 ≈ 17 would be the optimal number of patients in each center for the trial to have. As mentioned in the Section 6, the centers with more than 10 patients will remain as single centers. Secondly, grouping of the 36 centers with patients less than 10 must be put in consideration. Since among these 36 centers, 24 have patients in both treatment groups and 12 have patients in only one treatment group, we first consider grouping the 24 centers. Suppose
 has around 2 patients per treatment
group, then as it can be seen from table 6, if the size of the dummy
center is selected to be 2, i.e., 𝐽 = 2, the power will improve 11.262 %, i.e., Δ = 11.262 %. Whereas if 𝐽 = 3 or 𝐽 = 4 is selected, the value of Δ would be 8.005 % or 12.355 % respectively. As we aim to
maximize the improvement in power, according to the table, the size
of dummy center should be chosen to be 4. It is thereby suggested
to group these 24 centers into 6 dummy centers randomly using the
random method mentioned in Section 5 and each dummy center
will then contain 4 centers selected at random from the 24 small
centers. The total number of centers will be 13, and then randomly
assign the patients from the 12 centers with patients in only one
treatment group to the 13 centers. This example is summarized in
Table 7.
has around 2 patients per treatment
group, then as it can be seen from table 6, if the size of the dummy
center is selected to be 2, i.e., 𝐽 = 2, the power will improve 11.262 %, i.e., Δ = 11.262 %. Whereas if 𝐽 = 3 or 𝐽 = 4 is selected, the value of Δ would be 8.005 % or 12.355 % respectively. As we aim to
maximize the improvement in power, according to the table, the size
of dummy center should be chosen to be 4. It is thereby suggested
to group these 24 centers into 6 dummy centers randomly using the
random method mentioned in Section 5 and each dummy center
will then contain 4 centers selected at random from the 24 small
centers. The total number of centers will be 13, and then randomly
assign the patients from the 12 centers with patients in only one
treatment group to the 13 centers. This example is summarized in
Table 7.

Table 7: Example of Centre Grouping.
Concluding Remarks
As we discussed before, the observed significant treatmentby- center interaction may just be by chance alone or may be due to the existence of large number of small centers. We thereby introduce random grouping to provide a way to check false-positive of the observed treatment-by-center interaction. Also, by random grouping one can remove heterogeneity within/across centers and therefore achieve better statistical properties (e.g. power) to make statistical inference. The two scenarios discussed in Section 7 provides the optimal ways for grouping under two different circumstances, and the selection of method should base on the actual situation of centers after the clinical trials. There are certain limitations to the methods that we proposed. Although we aim to increase the power through combining small centers, under some circumstances, however, center grouping can also decrease the power during simulation. Also, when doing the simulation, we assume the ideal case, which is to have same number of patients in each treatment group per center before and after grouping. Nevertheless, this is usually not the case in practice, hence it is possible in some real cases that the combined centers have number of patients still smaller than the optimal number of patients that we want to have in each center, but the power after combining centers is believed to increase in most cases.
References
- Chow SC, Liu JP (1998) Design and Analysis of Clinical Trials. (3rd edn) John Wiley & Sons, New York, pp: 892.
- FDA (1988) Guideline for the Format and Content of the Clinical and Statistical Sections of New Drug Applications. US Food and Drug Administration, Rockville, Maryland, USA.
- ICH (1995) Guideline for Structure and Content of Clinical Study Report. International Conference on Harmonization, Yokohama, Japan.
- Bayman EÖ, Chaloner K, Cowles MK (2010) Detecting qualitative interaction: A Bayesian approach. Statistics in Medicine 29(4): 455-463.
- Lewis JA (1995) Statistical issues in regulation of medicine. Statistics in Medicine 14(2):127-136.
- Siddhartha Nandy (2018) Chapter 19: Two-way ANOVA [lecture notes]. Applied Regression Analysis STAT 512.
- Scheffé H (1959) The Analysis of Variance. Wiley, New York.
- Shao J, Chow SC (1993) Two-stage sampling with pharmaceutical applications. Statistics in Medicine 12(21): 1999-2008.
- Chow SC (2011) Controversial Statistical Issues in Clinical Trials. Chapman and Hall/CRC Press, Taylor & Francis, New York.
- Chow SC, Shao J, Wang H, Lokhnygina Y (2018) Sample Size Calculations in Clinical Research. 3rd Edition, Chapman and Hall/CRC Press, Taylor & Francis, New York, 107(31-32): 552-556.
- Sharon L, Lohr (1999) Sampling Design and Analysis. Duxbury Press, Pacific Grove, CA 93950.
- Pan G, Wolfe DA (1997) Test for qualitative interaction of clinical significance. Statistics in Medicine 16(14): 1645-1652.


 We use cookies to ensure you get the best experience on our website.