Research Article 
![]() Creative Commons, CC-BY
Creative Commons, CC-BY
Optimal Machine Learning Methods to Forecast COVID-19 Cases
*Corresponding author: T Raja Rani, General Studies Department, Military Technological College, Muscat, Oman.
Received: November 17, 2020; Published: November 25, 2020
DOI: 10.34297/AJBSR.2020.11.001583
Abstract
The entire world is undergoing a hard-hitting scenario and trying to combat the COVID-19 by recent technological advancements, which involves machine learning chiefly. The forecasting demand has become a prerequisite as it helps the government officials and other organizations to make well-versed verdicts and impose pertinent measures to benefit the living conditions of the individuals around the globe. Consequently, the current paper focuses on four significant machine learning methods (Facebook Prophet, Auto Regression, Vector Auto Regression, and Holt-Winters), which help forecast the total confirmed and daily confirmed cases. Moreover, the paper reveals the ideal method for the future forecast based on the attained results and efficacy rate. The results of the study reveal the best methods for the considered countries based on the calculation of Error percentage. Out of the four Machine Learning models, AR and FB models stood out as the best methods when compared to the other two.
Keywords: Total Confirmed Cases, Daily Confirmed, Total Deceased, Total Recovery, Akaike Information Criterion, Bayesian Information Criterion
Introduction
In the current striking scenario, forecasting of COVID-19 cases has become quite essential. It helps to create awareness for both government and the public due to which scenario-planning tools take place in every other sector. Moreover, the public will take the utmost care to prevent themselves from nerve-racking disease. The forecasting techniques aid hospitals and organizations’ management to share the importance of social distancing, meet essential etiquettes, and better hospitalization and food facilities. It is important to use the accurate forecasting technique as the wrong adopted technique devastates billions’ lives and upshot the well-being, economy, and societal chaos on an at-greater scale.
Machine Learning is one of the Artificial Intelligence branches and a strategy for information examination that robotizes the logical model structure. The framework gains from information, recognize examples and settle on choices with less human interruption. Time Series Forecasting is a prominent area of machine learning and is used for many crucial predictions where time plays a major role. It is also known as extrapolation in the classical statistical handling of Time Series data. The current paper focuses on four main machine learning methods. Facebook Prophet, Auto Regression, Holt-Winters, and Vector Auto Regression are the time series forecasting methods, part of Machine Learning.
Facebook Prophet (FB)
The prophet method is an additive time series forecasting model where non-linear trends support weekly, yearly, daily seasonality, and holiday effects. The current method uses two leading programming languages called Python and R. However, the current paper got progressed by the Python programming language, where the method primarily builds the model. After this, predicts the actual, lower and upper limits of total or daily confirmed cases. Generally, the method is swift and irregular holidays are well-taken care of [1].
Moreover, an unknown forecast extension of the target limit automatically sets up the cap by logarithmic model instead of linear. However, the pre-defined data format gets preferred and requires tuning specific parameters manually in case of high irregular data. Further, at the time of modeling, no facility is provided to incorporate exogenous variables. The interval width of FB in our present work is 99%. Facebook developed it [2].
Auto Regression (AR)
The Auto Regression method is a linear regression general forecasting model and is quite flexible as it showcases various time-series patterns. One can easily visualize the stimulated AR progressions. It uses a linear combination of the given values for future forecasts. A proper lag estimation can be done using the AR method by using the Mean Square Error. As the value of lag increases, the rate of error decreases, and it depends on the value of Mean Square Error. Lower the Mean Square Error, accurate will be the predictions [3].
Holt Winters (HW)
Holt-Winters is one of the populous time series forecasting techniques. In 1957, the economist Holt introduced the “Double Exponential Smoothening” method, and the work got extended further in the year 1960 by Winter to capture seasonality. Thus, the seasonal additive method is popularly called Holt-Winters. The current paper involves double and triple exponential smoothing to attain the best forecasting outcomes. It helps in determining the central value to overcome complex seasonal patterns. Lower the Mean Square Error, accurate will be the forecasting. It is a powerful forecasting method, and its trend is of additive type.
Vector Auto Regression (VAR)
Vector Auto Regression method is one of the general forecasting models. The augmented Dickey-Fuller test (ADF test) will check whether the given data is stationary or non-stationary. Further, the optimal value of order P (lagged value) is attained. Based on the value of the order, the forecast of the data takes place. If the p-value exceeds 0.05, at a reasonable level of implication, the series turns out to be non-stationary [4].
Literature Review
Loannidis J et al. discussed the main reasons for the failure of forecasting and suggested some ways to fix a few problems for better forecasting results. Incorrect assumptions related to modeling and epidemiological features stood as fundamental causes for the poor forecasting results apart from errors, sensitivity factors, and absence of proficiency. They suggest gathering appropriate evidence to analyze and provide appropriate solutions, leading to better forecasting outcomes. Consideration of modeling using predictive distributions along with multiple dimensions further helps besides the continual reappraisal of models. One needs to calibrate analytical intuitions and verdicts when considering extreme values as inputs for future forecasts. Further, the author recommended a holistic approach to avoid the irregularity of risks [5].
Ünlü R & Namlı E applied various machine learning techniques such as Support Vector Machines, Prophet, Long-Short Term Memory, and Holt-Winters to study the confirmed and mortality cases for the top seven countries. The clustering of seven countries done by elbow and silhouette scores methods. The prophet model resulted in the lowest Root Mean Square value amongst all the models. Further, the paper estimates 150 days of confirmed and death cases in Turkey using the Prophet method [6].
Ardabili et al. suggests an alternative towards SIR and SEIR models. They are soft computing and machine learning models, including MLP and ANFIS, which helped generate promising outcomes. The paper suggests machine learning as an optimal tool to study the complex nature of the COVID-19 outbreak and confirms the latent of machine learning for future research. The paper discusses essential modelling tools such as Evolutionary algorithms that solve optimization problems through intelligent methods and the Genetic Algorithm, which solves specific data structure problems. Apart from RMSE, the correlation coefficient was found for using PSO and GA for five selected countries. GWO derived functions stood as the best predictor compared to others [7].
Preparation and Methodology
Preparation
Preparation is one of the essential steps for any research. Before the discussion of the Methodology of various Forecasting techniques, planning includes the following necessary steps:
a) Collection of COVID-19 data from various online resources [8] and to conduct well-research on the previous literature review to understand the necessary resources and software required.
b) To Perform the Forecasting study on Google Colab Platform (open source) using Python programming language where Stats Library included to ensure analysis of total confirmed and daily confirmed cases along with the efficacy.
c) Draw the obtained results, which include graphs, and further analyze the data to compute the critical parameters such as to meet the primary purpose of the research.
Methodology
The methodology is designed through problem definition and by meeting the essential requirements. The research successfully tracked different methodologies for four diverse types of Machine Learning methods, as discussed below.
Methodology of Facebook Prophet: Facebook Prophet is one of the easiest forecasting methods which generates high-quality forecasts. Firstly, imported necessary libraries and data set and ensured the data frame is segregated into two columns known as Date and Data. The date is denoted by ‘ds,’ and Data is denoted by ‘y’ respectively. There are 295 rows and two columns in the data frame. Now, the model is built with an interval width of about 99% confidence level. The built model is further trained and later fits the model to the best possible future data frame. Lastly, from the attained future data frame, forecasted the total confirmed and daily confirmed cases for India, the US, and Oman, respectively. The model forecasts the total number of cases in three different formats, typically called yhat, yhat_lower, and yhat_upper. Here, yhat_lower and yhat_upper denotes the lower limit and upper limit of the forecasted value of yhat.
Methodology of Holt Winters: Firstly, imported necessary libraries and data set. When computed, the data’s length is 295, where 80% of the data is considered for training and the rest, 20% for testing. Next, considered the test dataset to fit the model best using Exponential Weighted Moving Average, Stats model, and Double exponential Stats model. There found a huge difference between EWMA and SES with tested values. However, DES gives the best approximation with the actual value. Further, the model was fit exponential smoothing, and required predictions were generated for the test value. Lastly, mean square error and mean absolute error got computed to best fit using exponential smoothing, and future forecasts of the total confirmed and daily confirmed cases were determined.
Methodology of Auto Regression: Auto Regression is a linear combination of seasonal predictors. It runs against a set of lagged values of order p. Firstly, imported necessary libraries and data set. When computed, the length of the data is 295, where 80% of the data is considered for training and the rest, 20% for testing. Further, appropriate test predictions got calculated with minimal Mean Square Error (MSE) of AR. Finally, the total confirmed and daily confirmed cases were forecasted.
Methodology of Vector Auto Regression: Firstly, two different data sets imported and joined. Later, the necessary libraries were imported. Applying the Augmented Dickey-Fuller test (ADF test) on the given data checked whether the data is stationary or non-stationary. If the data set was found non-stationary, it was changed to stationary with the help of the syntax transformed.diff(). Moreover, the grid search for the order p was done using AR of VAR model considering the trained data, which obtained the least AIC value, which gets confirmed as the best value of order p. Thus, the VAR model’s close-fitting is achieved for the order p, also known as the VAR model’s lagged value. Lastly, with the attained value of lag, the future forecasted value gets calculated.
Results and Analysis
The current section focuses on the forecasting of the COVID-19 cases using classical machine learning models for the three countries (i.e., India, US and Oman). Over the past few months, much insightful work was done on COVID-19, and the optimal data got congregated for the present study from the World Health Organization (WHO) portal. The data got collected starting from 22nd January 2020 to 11th November 2020 to drive the future forecasts forward [8].
Study of COVID Cases for Three Countries
As of 16 November 2020, the total number of confirmed cases throughout the world reached 53,766,728 million. Table 1 in the Analysis Section presents the total confirmed, recovered and death statistics. However, we confined our attention to forecast Total confirmed and Daily cases (positive cases).
Classical Machine Learning Methods
The study bounds to forecast the total and daily confirmed cases using important ML methods such as FB, AR, VAR and Holt-Winters. Further, a few important parameters got considered for the declaration of the powerful ML method.
Results of Facebook Prophet: Forecasting was done using the FB model on 30 November 2020 as viewed from. According to the total and daily confirmed cases, it is confirmed that the US is hitting its peak when compared to India and Oman. Oman has the least number of confirmed cases when compared to other countries. It implies that all precautionary measures need to US. depict the total confirmed cases in India, US and Oman, respectively.

Table 2: Time Series Analysis with Facebook Prophet Library.

Figure 1: Forecasting total confirmed cases in India.

Figure 2: Forecasting total confirmed cases in US.

Figure 3: Forecasting total confirmed cases in Oman.
From the below figures, it is evident that data of daily confirmed cases in Oman got scattered broadly, and it enflamed the difficulty level of prediction to attain future forecasting results. Moreover, the figures depict the daily confirmed cases in considered countries. The number of confirmed cases in India and Oman seems to decline by 30 November 2020. Figure 5 gives a clear sign of the start of the second wave in the US because of which several cases are expected to reach its peak by 30 November 2020.

Figure 4: Forecasting total confirmed cases in Oman.

Figure 5: Forecasting Daily confirmed cases in US.

Figure 6: Forecasting Daily confirmed cases in Oman.

Table 3: Time Series Analysis with Stats Library.
Results of Holt Winters: Forecasting was done using the Holt-Winters model on 30 November 2020 as viewed from Table 3. According to the numbers of total and daily confirmed cases, it is deep-rooted that the US is hitting its peak when compared to India and Oman. Oman has the least number of confirmed cases when compared to other countries. The residents of US need to abide by the informed precautions from the government of the US. Figures 1-3 depict the total confirmed cases in India, US and Oman, respectively.

Figure 7: Forecasting Daily confirmed cases in Oman.
Figure 7 depicts 20% of the testing data of India from 14 September to 11 November 2020. It is visible that EWMA (Exponential Weighted Moving Average) and SES (Single Exponential Smoothening) are in a linear trend and overlapping each other. However, found a massive error concerning the total confirmed testing data. Consequently, Double Exponential Smoothening method (DES) applied because of which, DES and total confirmed trend lines got very near to each other. The forecasting model is simply in the form of a straight sloped line extending from the recent data point. As Holt-Winters method is a “Triple Exponential” method, introduced smoothening factor and forecasted the total confirmed cases of India from 12-30 November 2020 as seen in the figure below.

Figure 8: Forecasting TC in India.

Figure 9: Testing Data of India (DC).

Figure 10: Forecasting DC in India.
Figures 9 & 10 depict the testing data and forecasting data of daily confirmed cases which got procured in the same manner as that of the total confirmed data. The same applies to forecasting TC and DC cases of US and Oman. The Figures related to the US and Oman can be seen below.

Figure 11: Forecasting TC in US.

Figure 12: Forecasting DC in US.

Figure 13: Forecasting TC in Oman.

Figure 14: Forecasting DC in Oman.
Results of Auto Regression: From Table 4, forecasting was done using the Holt-Winters model on 30 November 2020. According to the numbers of total and daily confirmed cases, it is deep-rooted that the US is hitting its peak when compared to India and Oman. Oman has the least number of confirmed cases when compared to other countries.

Table 4: General Forecasting Model (AR).

Figure 15: Testing TC in India.
Figures 15-16 depict the testing data and forecasting data of total confirmed cases using Auto Regression for India. Initially, the test data set for India got fit as AR1 model with a maximum lag of 1 and because of which obtained high Mean Square Error value (i.e., 684618). Finally, the model got best-fitting as AR12, which represents the total number of lags (i.e., lags = 12). At this point, the Mean Square Error is minimal as compared to previous and following lags. Lower the Mean Square Error value, appropriate predictions through AR gets generated.

Figure 16: Forecasting TC in India.

Figure 17: Testing TC in US.

Figure 18: Forecasting TC in US.
Figures 17-18 depict the testing data and forecasting data of total confirmed cases using Auto Regression for the US. The same method as that for India followed to forecast the US data. The model got best-fitting as AR12, which represents the total number of lags (i.e., lags = 12).

Figure 19: Testing TC in Oman.

Figure 20: Forecasting TC in Oman.
Figures 19-20 depict the testing data and forecasting data of total confirmed cases using Auto Regression for Oman. The same method as that for India followed to forecast the Oman data. The model got best-fitting as AR11, which represents the total number of lags (i.e., lags = 11).

Figure 21: Forecasting DC in India.

Figure 22: Forecasting DC in US.

Figure 23: Forecasting DC in Oman.
Figures 21-23 depict the forecasting data of daily confirmed cases for three countries which got procured similarly that of the total confirmed data.

Table 5: General Forecasting Model (VAR).
Results of Vector Auto Regression: Forecasting was done using the Holt-Winters model on 30 November 2020 as viewed from Table 5. According to the numbers of total and daily confirmed cases, it is deep-rooted that the US is hitting its peak when compared to India and Oman. Oman has the least number of confirmed cases when compared to other countries.

Table 6: ADF Test for TC.
Augmented Dickey-Fuller Test performed on given data to check whether the data is stationary or non-stationary. Data was non-stationary till it reached the fourth difference (No.of Differences= 4). At this point, data has a unit root as it was non-stationary. Further, we acquired the above-shown results as data has no unit root and turned out as stationary.

Table 7: Grid Search.

Table 8: Grid Search.
We have found order p for the combination of two countries, India & US as well as India & Oman as the combination is a prerequisite in the VAR model. The order of p is dependent on the minimal AIC (Akaike Information Criteria) value. Once, the value of the order is set, best-fit of the model takes place for the same order, p and further forecasting was done as shown in figures below. Finally, the result summary got acquired and can be seen below in Table 8.

Figure 24: Forecasting TC in India.

Figure 25: Forecasting TC in Oman.

Figure 26: Forecasting TC in US.
Analysis of Best Forecasting Models for Three Countries
The current section treasures the best forecasting model considered for individual countries. Thus, meeting the primary aim of the research paper.
Forecasting Analysis for India: shows the actual and forecasted total confirmed cases for four models, and shows the percentage error to determine the efficiency of each model. The best forecasting model to predict the TC cases for India is “AR”.

Table 9: Comparing the results of the Forecasting models of Total Confirmed cases for India.

Table 10: Error Calculation for Forecasting methods in India.
Forecasting Analysis for US: Table 11 shows the actual and forecasted total confirmed cases for four models, and Table 12 shows the percentage error to determine the efficiency of each model. The best forecasting model to predict the TC cases for the US is “FB”.

Table 11: Comparing the results of the Forecasting models of Total Confirmed cases for US.

Table 12:Error Calculation for Forecasting methods in US.

Table 13: Comparing the results of the Forecasting models of Total Confirmed cases for Oman.

Table 14: Error Calculation for Forecasting methods in US.
Table 13 shows the actual and forecasted total confirmed cases for four models, and Table 14 shows the percentage error to determine the efficiency of each model. The best forecasting model to predict the TC cases for Oman is “AR”.

Table 15: Overall Forecasting Analysis.
From Table 15, highlighted total confirmed cases as per the efficacy of the forecasting models, are to be expected on 30 November 2020.

Figure 27: Analysis of DC cases.
Analysis of Daily Confirmed Cases: Figure 27 depicts the daily confirmed cases for the three countries, where the US overtook the other countries by a step ahead in terms of numbers. Further, it seems to appear that Oman has the least number of confirmed cases from the above figure. However, the most affected country will get decided on by comparing the confirmed, recovery and death cases with a respective total population of each country.
Overall Analysis for India:

Figure 28: Overall Analysis for India.
Overall Analysis for US:

Figure 29: Overall Analysis for US.
Overall Analysis for Oman: Figures 28-30 reveal the Overall statistics of India, US and Oman individually based on the essential parameters such as confirmed cases, rate of recovery and deceased cases. India is the least affected country compared to other countries (Figure 29).

Figure 30: Overall Analysis for Oman.
Overall Analysis for Three Countries:

Table 1:
The following critical points were noticed from the table above:
A. Considering the TC, TR and TD (i.e., Total Confirmed, Total Recovered & Total Death) cases, the US stood as the most affected country.
B. Even though, Oman is not marked as the affected country according to the per cent of TC, TR and TD, there is still an alarming call for residents of Oman though population is minimal compared to that of India and the US. The residents of Oman need to abide by the informed precautions from the government of Sultanate of Oman to avoid a hike in cases.
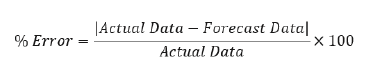
Discussion
For the current study, relevant data collection was done from [8]. AR and FB models seem to be the best methods out of the four. It is due to the nature of data that resulted in the VAR method could not reach the potentials, even though it is a powerful method. The percentage error calculation helped to decide the best method. It is calculated, as shown below:
The following are the precautionary measures to be implemented by the people globally.
1) Wear a mask
2) Maintain 6 feet of social distance
3) The area needs to be cleaned prior to touching the surface and after
4) Implement the habit of frequent hand wash
5) Stay home in case of feeling sick
6) Avoid gatherings
7) Consume Vitamin C & D
The future work involves the Deep learning time series methods to forecast COVID 19 data, Trend analysis and Future price predictions.
Conclusion
The current research paper has successfully forecasted the total confirmed and daily confirmed cases using four essential Machine Learning techniques which comprises Facebook Prophet, Auto Regression, Vector Auto Regression and Holt-Winters respectively for three different countries (India, US and Oman). The results of the study reveal the best methods for the considered countries based on the calculation of Error percentage. The US surpassed the other two countries and stood as the most affected country. The overall comparison reveals that India is combating against COVID-19 effectively. Considering total population as a significant factor, Oman seems to be in the menace zone, and necessary stringent measures provided by the government of Oman must be followed by the residents of Oman to subdue the effects of the pandemic. Out of the four Machine Learning models, AR and FB models stood out as the best methods when compared to the other two.
Acknowledgement
The authors want to acknowledge the management of esteemed institutes for support. Firstly, Military Technological College, Oman, for the constant support and encouragement on the current research area. Further, we would like to thank the management of BITS Pilani, Hyderabad, India, and the National University of Science and Technology, Oman, for the backing and encouragement to drive the significant research work forward through extended collaboration across different countries.
Biographies

Figure 31:
Dr Raja Rani is currently working as a Deputy Head of the General Studies Dept at Military Technological College, Oman and part of a Visiting Fellow Research at Portsmouth University, UK. Further, published several research papers in reputed National and International journals along with the conferences held at UK, Hong Kong, Oman and India. She worked as a peer reviewer of research papers in two international journals of Fluid Dynamics and worked as a co-author for a book published in 2014, entitled: Approximate Analytical Methods for Solving Ordinary Differential Equations, CRC Press (Taylor& Francis Group). She holds 26 years of experience in teaching Engineering Mathematics for under-graduates and post-graduates. Moreover, worked as an Assistant and Associate Professor in various Engineering colleges in India and current research interests are in mathematical modelling with applications to real-world problems focusing on heat and mass transfer (for porous and non-porous medium), bio-fluids, control systems engineering, fractional differential equations, machine and deep learning.

Figure 32:
Dr T S L Radhika is working as an Assistant professor in BITS Pilani, Hyderabad Campus, India. An applied mathematician by education and statistician by training she works on mathematical and statistical models for understanding some physical and natural phenomenon. Currently, she is working on models for human arterial blood flow and fluid transport in porous bodies in nonconventional coordinate systems, the spheroidal and bipolar.

Figure 33:
Shalini Pukkella currently pursued BEng Computer-Aided Mechanical Engineering (Hons) at the National University of Science and Technology, Oman (affiliated to Glasgow Caledonian University, UK). She Secured a CGPA of 3.79 out of 4. Partakes keen interest in vital research and participated in many student activities and college events on the campus. She worked as a treasurer of ASME on behalf of NUST University. She interned at Glasgow Caledonian University, Scotland, during her final year of study. The first research publication was made in the International Research Journal of Engineering and Technology for the paper named “Design and Development of Pick and Place Arm Robot.”
Conflict of Interest
The authors declare that there is no conflict of interest.
References
- J Taylor S, Ben L (2017) Prophet: forecasting at scale. PeerJPreprints.
- (2020) Facebook’S Open Source Forecasting Tool, Prophet. Cartesian Consulting.
- P Tutorials (2020) What Is an Autoregressive Model?. 365 Data Science.
- Maitra S (2020) Vector Autoregressive For Forecasting Time Series. Towards data science.
- Ioannidis J, Cripps S, Tanner M (2020) Forecasting for COVID-19 has failed. International Journal of Forecasting.
- Unlu R, Namlı E (2020) Machine Learning and Classical Forecasting Methods Based Decision Support Systems for COVID-19. Computers, Materials & Continua 64(3): 1383-1399.
- Ardabili S, Mosavi A, Ghamisi P, Ferdinand F, Varkonyi Koczy A. et al. (2020) COVID-19 Outbreak Prediction with Machine Learning. medRxiv 13(10): 249.
- (2020) Novel Coronavirus (COVID-19) Cases Data. HDX.


 We use cookies to ensure you get the best experience on our website.