Research Article 
 Creative Commons, CC-BY
Cardiac Output Determination at Superficial Skin Level Based on a Noninvasive Magnetic Device
*Corresponding author: Dra. Martha Alicia Hernández González. Division de Investigación en Salud, Unidad Médica de Alta Especialidad Hospital de Especialidades No. 1 CMN Bajio, Instituto Mexicano del Seguro Social, Leon, Guanajuato, Mexico. Blvd Adolfo Lopez Mateos esq. Av. Insurgentes sin número. Col. Los Paraísos. CP 37320. León, Guanajuato. México.
Received: April 21, 2021; Published: April 29, 2021
DOI: 10.34297/AJBSR.2021.12.001765
Abstract
There are several methods for the determination of the Cardiac Output (CO), one of the most common is the Thermodilution (TD) technique which consists in inserting a Swan-Ganz catheter into the circulatory system. We show results for the measurement of the CO using a noninvasive magnetic device.
Methods: This protocol was carried out in two steps: A) A first step of validation (10 patients) in order to evaluate the influence of weight, height, age, or sex in the CO measurements. Those patients underwent cardiac catheterization without coronary artery disease (5 male, 5 female). B) A second step, the testing, with 35 patients who did not enter in the validation step, was done as follow: After placing the magnetic marker on subject’s neck, over the acarotid artery pulse, Measured pressure curves were obtained every 30 seconds: 5 records for aspiratory inhalation and 5 records for aspiratory exhalation. After methodology validation, the testing step was made with two measures in each one of the subjects. Statistical analysis was made with correlation and using the Bland-Altman test.
Results: The result of the validation step had an excellent correlation (R2 = 0.997). In the test step, 35 patients met the inclusion criteria and entered the study: 26 men and 9 women with ages between 48 and 63 years, average 57 ± 4.3 years. Cardiac output was measure a) by thermodilution 6.6 ± 1.51L and b) with our device 7.03 ± 2.10 L. The correlation coefficient between the two methods was 0.72 (p <0.0001).
Conclusion: An estimation of the CO by using a magnetic based device is presented in this work; this device can offer a distinction of recording curve shapes for arterial and venous pressure like those recorded by catheterization at skin level. The device can provide a noninvasive, easy and fast measurement of the CO.
Background
The Cardiac Output (CO) is the volume of blood pumped by the heart per minute (L/min). CO is a function of heart rate and stroke volume. The Stroke Volume (SV) is the volume of blood, in milliliters (mL), pumped out of the heart with each beat. The CO monitoring provides insightful information, which is used as a guide for the treatment of patients with hemodynamical instability, hypoxia, shock, and multiple organs failure [1-6]. The CO presents variations among patients and, even, in the same subject. This is due to physical activity, metabolism, body size, Body Mass Index (BMI) and age, among others. There are several methods for the determination of CO, one of the most common is the Thermodilution (TD) technique [7,8], which consists of inserting a Swan-Ganz catheter into the circulatory system. The measurement, by intermittent pulmonary artery, is considered as the reference cardiac output-monitoring standard, against which all new cardiac output-measuring devices are compared. For reliable results, this evaluation is performed at least three times [4,9].
Methods
In the Cardiac Catheterization Laboratory of Highly Specialized Medical Unit (HSMU) No.1 belonging to the Mexican Institute of Social Security (IMSS), a procedure to measure the CO, based on a noninvasive magnetic device, was tested in patients between 50-68 years old, all of them with access to measure CO by Thermodilution (TD) due to clinical conditions. Those patients undergoing emergency surgery, generalized edema, pulmonary edema, pleural effusion, Chronic Obstructive Pulmonary Disease (COPD), congestive heart failure, arrhythmia, tricuspid regurgitation, intracardiac shunt, hemodynamic instability (Heart Rate > 120 beats/ min, systolic blood Pressure < 90mmHg and/or mean arterial pressure < 60mmHg, and urine output < 0.5mL/kg/hour). An intra-aortic balloon pump support situation was excluded because it is known that these events can significantly affect these kind of measurements [10].
Each patient, enrolled in this study, signed a written consent before carrying out the measurements, which were performed according to the Treaty of Helsinki for studies in humans. It is important to point out that the procedure does not present any risk to the patient because it is a noninvasive procedure and because he/ she is not exposed to any ionizing radiation. This study is registered in the local Ethical Committee, number 2010-1001-28.
This protocol was carried out in two steps: A) a validation step (10 patients) to evaluate the influence of weight, height, age, or sex in the cardiac output measurements who underwent cardiac catheterization without coronary artery disease and B) a testing step with 35 patients who did not enter the validation step with two measurements performed in each patient.
Study Protocol
The technique to place a magnetic marker was described in Cordova-Fraga et al. [3] (Figure 1). Each volunteer was asked to be placed in a semi-fowler position, then the carotid artery (right or left) was identified by palpation and auscultation, and a magnetic marker (3mm diameter×4mm height) was placed on the skin just above the artery’s location (Figure 2). A KMZ10 magnetic sensor, in contact with the volunteer’s skin (outer of the artery skin location) was fixed, taking care that the magnetometer was aligned with the magnetic marker. Without exerting more pressure than the base and the magnetic sensor weight on the neck of the person, the magnetometer is separated by an average distance of 2.5cm from the magnetic marker in every patient. The magnetic marker is light enough to not crush the blood vessel (5g), but the intensity of the magnetic moment (μ = 0.13Am2) is yet enough to generate an excellent signal over to environmental magnetic noise.
Figure 2: Superposition of signals obtained with the PPC and polygraph and made the switch from units of volts to millimeters of mercury in the PPC signal.
The magnetic signal is registered with a high signal-to-noise ratio, such that an additional analogical filtering is not required to read that signal. The signal can be detected and read in real time. Mechanical action of the blood in the arterial walls disturbs the magnetic marker such that it generates a variable magnetic field that increases as the marker approaches the sensor and decreases if it goes away from it.
Validation Step
In this validation study, 10 patients underwent cardiac catheterization without coronary artery disease (5 male, 5 female). Then, after placing the magnetic marker, the pressure curves were repetitively measured, every 30 seconds, according to the following order: 5 records for aspiratory inhalation and 5 records for aspiratory exhalation, with an apnea lapse. It was asked an apnea lapse of around 30s. During determination of each pulse wave data, the thermodilution cardiac output were simultaneously recorded. These measurements were performed on the left side of the neck and suprasternal area. Some of them was also included alternate position: semi-fowler and supine.
Validation of the obtained signals is carried out estimating the correlation coefficient of the reproducibility of the signal (crosscorrelation of a signal with itself) using mathematical procedures for processing biological signals, first among the same individual (auto- correlation) and then correlate measurements between healthy subjects and patients.
A first evaluation of the signal was performed, recording apnea and normal segments, in order to assure the reproducibility and its autocorrelation. For this purpose, measurements were obtained in expiratory and inspiratory phases, such as was done with the TD method.
Testing Step
After methodology validation, the testing step was performed in 35 subjects all of them with access to measure CO by Thermodilution (TD) due to clinical conditions, with two measures performed in each patient.
Statistical Analysis
For repeatability tests between measurements, there is a phase shift in the signals, so that, to establish their correlation between them. The area under the curve of each signal was estimated and established a correlation area. Subtracting point to point from the integrated curves, there is a correlation over 0.9 and p values well below 0.05. Obtaining an excellent correlation and thus validating the measurements using this device. For the calibration test, the Figure 2 shows one of the curves obtained simultaneously with the PPC and the polygraph in a cardiac catheter intervention, considered the gold standard method.
We analyzed dependent samples using the t-Student test, Pearson correlation coefficient and Bland-Altman test, a p<0.05 was considered as significative.
Results
Validation Step
In Figure 3, a typical PPC signal is shown. The area under the waveform pulse, takes the diastolic level as a baseline, and it is hypothesized to be proportional to the SV. The real value of the SV, taken from TD evaluation, is correlated with the averaged area under the pulse waveforms, obtaining the following relationship. SV = (-0.006 ± 0.008) + (10.5 ± 0.7) * Area, R2 = 0.957. Due to the small value of the independent term of the line, which in this case, is consistent with zero, the important coefficient is the slope of the correlation. The direct ratio SV/Area approximates with a good precision the slope of the linear regression. While it is calculated for each subject, it does not correlate with any of the anthropometric parameters under consideration (weight, height, BMI) nor the age. This result indicates that the skin and subcutaneous characteristics of the evaluation point are not relevant compared to the device characterization; that is, the ratio depends only on the geometrical and electrical parameters of the device.
This can be understood because the arterial volume changes are reflected in the outer surface level changes, free of internal pressure and mechanical stress. The wall dimensions of the artery could probably be important, but this was not evident in this group of patients or the device’s parameter dominates. Therefore, in this case, the proportional coefficient can be estimated with an initial group of patients and used for most of the patients with similar characteristics of our patient group. The average rate SV/Area value is taken to calculate the characteristic factor of the device that relates to the areas under the pulse waveform (mV × sec) and the SV (l/pulse) for CO evaluation. Table 1 shows the comparative data of the TD method and the PPC method in 10 patients in aspiration apnea. There is an average of four measurements with each procedure for each patient.
The results for both methods: TD and PPC, as well as the data for the differences (PPC - TD) follow a normal distribution, either using Shapiro-Wilk or Kolmogorov-Smirnov tests for normality.
Figure 4: Validation test for Cardiac Output results comparing both methods TD and PPC. There are not statistically significant differences between methods (t = -0.66, p = 0.55).
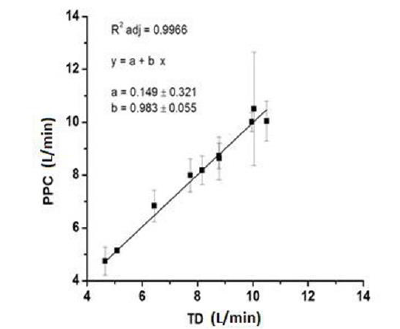
Figure 5: Validation step. Linear regression between TD and PPC results, taking the SD of PPC data as the errors and the TD averages as the true value for each patient.
Taking the whole data as dependent paired samples, the authors did not find any statistically significant difference between results, comparing both methods (Figure 4). The results for each method in a repetitive assessment of each patient corroborates that the variation of repetitive evaluations in one patient is, by far, larger than the resultant differences between the methods. The average standard deviations are 2.05 for TD and 1.98 for PPC, in both cases this represent 25% of the average CO results. Nevertheless, if we take the averaged TD result as the true value for CO and PPC data, they have an excellent correlation (R2 = 0.997), (Figure 5).
Taking the TD method as the gold standard, Bland-Altman diagram shows an average difference between methods of 0.066 representing only 0.8% of the average TD result (Figure 6). At the same time two standard deviations of the result differences (0.5353) represent the 6.6% of the average TD result. That is, the new method would establish 95% of the time, a result that differs from that obtained using TD method, with no more than 6.6% of the real value.
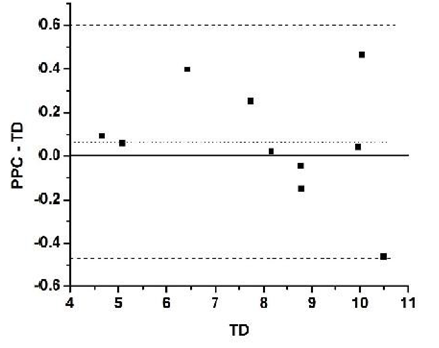
Figure 6: Validation step. Bland Altman diagram for PPC vs. TD results taking TD as gold standard (true value).
Testing Step
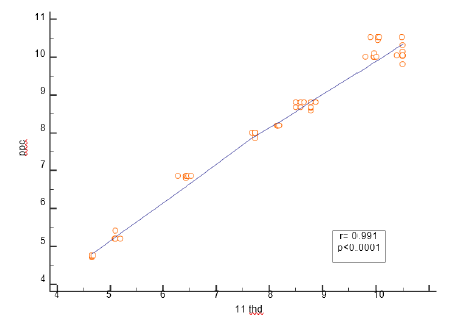
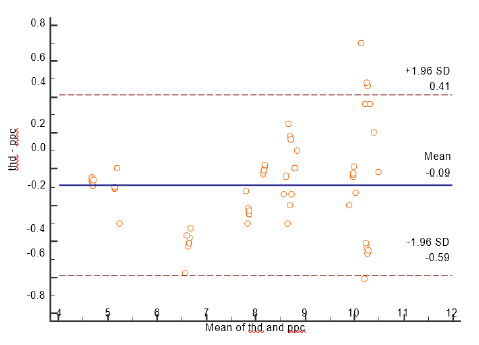
We reviewed 72 patients, but only 35 who met the inclusion criteria for entrance into the study. 26 men and 9 women with ages between 48- and 63-years average 57 ± 4.3 years comprised the population of this study. 12 (34%) had the diagnosis of diabetes mellitus and 14 had (40%) arterial hypertension. Cardiac output was measured by thermodilution 6.6 ± 1.51 l and without device, CO was 7.03 ± 2.10. The correlation coefficient between the two methods was 0.72 (p <0.0001) (Figure 7) We observed that the PPC sub estimates the value of the thermodilution cardiac output by 0.09L when we used the Blant- Altman analysis, and no extreme values are reported (Figure 8).
Discussion
Historically, the Fick Method [11] was the first method to measure cardiac output, in which arterial and mixed venous blood samples are simultaneously obtained for the determination of the oxygen consumption [11]. The NICO TM system (Novametrix Medical Systems, Wallingford, USA) is a system based in bioimpedance. The thoracic electrical bioimpedance does not directly measure the LV GC but extrapolates it through the global conduction velocity of an electrical stimulus, through the integration of multiple signals generated by the pulsatile flow of the aorta and the resistance to application of electric current. The continuous measures of changes in the impedance, caused by the fluctuation of blood volume throughout the cardiac cycle, make it possible to measure, calculate and continuously monitor the VS, the GC, the myocardial contractility and the state of the total thoracic fluid [9,12].
One less invasive thermodilution-based technique consists of the Pulse-Induced Cardiac Output Device (PiCCO) system. It applies the Fick principle to carbon dioxide (CO2) in order to obtain CO measurements in intubated, sedated, and mechanically ventilated patients. This device includes the need for intubation, mechanical ventilation with fixed ventilator settings and minimal gas exchange abnormalities. This technique should only be applied in a precisely defined clinical setting to mechanically ventilated patients [13].
Some non-invasive studies have shown that hemodynamic forces have a relationship with the pulse pressure [3]. It has also been noted that with the increment of the subject’s age, an increment of cardiovascular risks has been observed, an increase of the aortic pressure [7,8,10,11,14-17]. Currently, there are several methods used for the measurement of blood pressure: a cardiac catheterization technique for arterial and venous pressure in graphical and digital mode; and the sphygmomanometer for arterial pressure in digital mode. The second one is widely used; however, the cardiac catheterization technique is also able to record venous pressure and is therefore considered the gold standard in these assessments despite its evident invasiveness. It exposes the patients to a high dose of X-ray radiation and demands highly trained personnel as well as special patient areas for implementation [8]. In Bucklar, Kaplan & Bloch [18], the authors have presented a realtime signal processing technique for inductance cardiograph along with software for acquisition, display, filtering and ECG- triggered ensemble averaging of inductance signals.
Tjin et al. [19] have reported a continuous cardiac output monitoring system to allow the real-time measurement of the cardiac output. Using a sensor that comprises a laser Doppler velocimeter and an impedance measurement unit. The author shows more accurate results than the measurements taken by the TD catheter. Other interesting works to determine the CO have been reported [20-27]. The main advantage of the cardiac catheterization technique is that it presents an objective record of venous blood pressure; nevertheless, cardiac output calibration via trans pulmonary TD requires the insertion of a central venous line [28]. Due to the high costs and need for highly specialized medical personnel and well-equipped facilities, in 2011, Cordova T et al. [3,29,30] reported the validation of a new and noninvasive device, pending for patent, that records blood pressure in healthy subjects and patients, the Pulse Pressure Cardiac Gauge (PPC).
An estimation of the CO by using this device is presented in this work; this device called PPC can offer a distinction of recording curve shapes for arterial and venous pressure like those recorded by catheterization, but at skin level. The PPC analysis is based on the principle that SV can be continuously estimated by analyzing the arterial pressure waveform obtained from an arterial line. The device can provide a noninvasive, easy and fast measurement of the CO. Magnetic field measurement provides an excellent way to observe the oscillations of blood vessels due to blood pressure changes. This oscillation waveform relates the blood pressure with the flow of blood pumped by the heart. In this way the magnetic device, called PPC magnetometer provides information (voltagetime) about the changes in arteries or veins due to the blood pressure.
The maximum value of each wave is proportional to the systolic pressure and minimal to the diastolic pressure. The dicrotic wave is related to the backflow of blood, related to the second part of the arterial pulse occurring during diastole of the heart. The information, of course, ought to depend on subject’s health status, physical conditions of the arteria and skin characteristics. As far as it is known, there is no database that suggests the possibility that the central pressure has been measured with a non-invasive method. The PPC device has an advantage in this point because, when a magnet is properly positioned on a vein close to the heart, according to the anatomy, its motion can be recorded in the form of a voltage-time signal, considering the magnet as an extension of the skin where it is placed. For healthy subjects, this vein is best seen in a semi-fowler position. For calibration of a PPC device using the cardiac catheterization technique in the arteries, a recorded waveform of the blood pressure recorded can be associated. The form of the curve for both methods is qualitatively similar.
The PPC device can differ in some of the measurements, which can be explained by the use of ejection fraction as a constant in the TD method (70mL/min). Although most cases behave very close to this value, it can increase or decrease significantly. The variations of each method for one subject are by far, larger than the difference obtained between methods. This result confirms the hypothesis that the area under the waveform can be, in fact, considered as proportional to the SV value, fluctuating as expected; but, once calibrated for one subject or a group of subjects with similar anthropometrical characteristics, it is possible to avoid the invasive method.
Conclusions
The PPC device has shown an excellent signal to noise ratio, which allows obtaining a good pressure waveform, qualitatively and unequivocally like the waves of arterial and venous pressure obtained by invasive methods. It is important to point out that this waveform should be affected by i) anthropometrical characteristics, which are non-significant for the subject group studied in this work, ii) other body motions that can be controlled (for instance, respiration), and iii) device parameters. Nevertheless, a high correlation with pressure changes and features from usual techniques has been proven. Using the PPC device, it is possible to have an accurate estimate of cardiac output compared with the commonly used TD technique, which works by introducing a Swan Ganz catheter into the pulmonary; an invasive technique that entails certain risks for the patient. This new modality for evaluation of the CO is an excellent alternative that avoids the risks from inserting a catheter, having similar values and uncertainties as the gold standard technique.
Acknowledgments
Authors thanks the partial support to transversal projects under grant DAIP-2014/59023, Ing. Angel Lizbeth Piña-Ruiz and Lic. Ramón Humberto Solorio Hernández for the English revision.
Conflict of Interest
The authors declare that they have no conflict of interest.
References
- Marcelino P, Germano N, Marum S, Fernandes AP, Ribeiro P, et al. (2006) Haemodynamic Parameters Obtained by Transthoracic Ecocardiography and Swan-Ganz Catheter: a comparative study in liver transplant patients. Acta Medica Portuguesa 19(3): 197-205.
- Cabrera Schulmeyer MC, Vega Sepúlveda RA, Santelices Cuevas EG (2004) Intraoperative measurement of cardiac output by transesophageal echocardiography of transmitral flow. Revista Española Anestesiologia y Reanimacion 51(7): 367-372.
- Córdova Fraga T, Gómez Aguilar F, Bravo Arellano T, Hernández González MA, Solorio Meza S, et al. (2012) Biomagnetic Validation to Skin Level for Blood Pressure Curves and Venous. Open Journal of Applied Science 2(3): 128-134.
- Alhashemi JA, Cecconi M, Hofer CK (2011) Cardiac output monitoring: an integrative perspective. Critical Care 15(2): 443-456.
- Marik PE (2013) Noninvasive cardiac output monitors: a state-of the-art review. Journal of Cardiothoracic and Vascular Anesthesia 27(1): 121-134.
- Maldonado Móreles MA, Córdova Fraga T, Cano ME, Solorio Meza SE, Sosa MA (2008) Registration of Intravascular Pressure Curves: Magneto-Mechanical Evaluation. Medical Physics, AIP Conference Proceedings 1032(1): 302-305.
- Sanmarco ME, Philips CM, Marquez LA, Hall C, Davila JC (1971) Measurement of cardiac output by thermal dilution. The American Journal of Cardiology 28(1): 54-58.
- Pavek K, Boska D, Selecký FV, Sauberer A (1964) Measurement of cardiac output by thermodilution with constant rate injection of indicator. Circulation Research 15(4): 311-319.
- García X, Mateu L, Maynar J, Mercadal J, Ochagavía A, et al. (2011) Estimating cardiac output. Utility in the clinical practice. Available invasive and non-invasive monitoring. Medicina Intensiva (35)9: 552-561.
- Duque CO (2010) Monitoria Hemodynamics in the field of enformer de los pacientes in estado crytico con perfumai tisular inefectiva (Critical care nursery specialty Thesis (2010). Universidad de Antioquia, Facultad de enfermerí Medellín.
- Abudiab MM, Redfield MM, Melenovsky V, Olson TP, Kass DA, et al. (2013) Cardiac output response to exercise in relation to metabolic demand in heart failure with preserved ejection fraction. European Journal of Heart Failure 15(7): 776-785.
- Gaytán Martínez Z, García Piche M, Jiménez González A (2004) Medicine gastro cardioco for applications in docencia: compare dos technologies. Revista Mexicana de Ingeniería Biomédica (25)1: 78-91.
- Li T, Cai H, Pan H, Pu Q (2015) Cardiac output measurement using a modified carbon dioxide Fick method: comparison analysis with pulmonary artery catheter method and pulse induced contour cardiac output method. International Journal of Clinical & Experimental Medicine 8(3): 3530-3537.
- González J (2006) Mediciin invasiva del gasto cardiaco en las unidades de cuidados cryticos. Enfermería en Cardiología 38(2): 30-35.
- Hoeper MM, Maier R, Tongers J, Niedermeyer J, Hohlfeld JM, et al. (1999) Determination of cardiac output by the Fick method, thermodilution, and acetylene rebreathing in pulmonary hypertension. American Journal of Respiratory and Critical Care Medicine 160(2): 535-541.
- Van der Spoel AG, Voogel AJ, Folkers A, Boer C, Bouwman RA (2012) Comparison of noninvasive continuous arterial waveform analysis (Nexfin) with transthoracic Doppler echocardiography for monitoring of cardiac output. Journal of Clinical Anesthesia 24(4): 304-309.
- Gedeon A, Forslund L, Hedenstierna G, Romano E (1980) A new method for noninvasive bedside determination of pulmonary blood flow. Medical & Biological Engineering & Computing 18(4): 411-418.
- Bucklar GB, Kaplan V, Bloch KE (2003) Signal processing technique for non-invasive real-time estimation of cardiac output by inductance cardiography (thoracocardiography). Medical & Biological Engineering & Computing 41(3): 302-309.
- Tjin SC, Ho YC, Lam YZ, Hao J, Ng BK (2001) Continuous cardiac output monitoring system. Medical & Biological Engineering & Computing 39(1): 101-104.
- Kroon W, Bosboom M, Huberts W, Tordoir J, Vosse F (2012) Computational model for estimating the short- and long-term cardiac response to arteriovenous fistula creation for hemodialysis. Medical & Biological Engineering & Computing 50(12): 1289-1298.
- Bernstein DP, Lemmens HJM (2005) Stroke volume equation for impedance cardiography. Medical & Biological Engineering & Computing 43(4): 443-450.
- Wiard RM, Inan OT, Argyres B, Etemadi M, Kovacs GTA, et al. (2011) Automatic detection of motion artifacts in the ballistocardiogram measured on a modified bathroom scale. Medical & Biological Engineering & Computing 49(2): 213-220.
- Zhang G, Wu T, Song Z, Wang H, Lu H, et al. (2015) A mechanical chest compressor closed-loop controller with an effective trade-off between blood flow improvement and ribs fracture reduction. Medical & Biological Engineering & Computing 53(6): 487-497.
- Brands J, Vink H, Van Teeffelen JWGE (2011) Comparison of four mathematical models to analyze indicator-dilution curves in the coronary circulation. Medical & Biological Engineering & Computing 49(12): 1471-1479.
- Alcaraz R, Rieta JJ (2008) A non-invasive method to predict electrical cardioversion outcome of persistent atrial fibrillation. Medical & Biological Engineering & Computing 46(7): 625-635.
- Buell JC (1988) A practical costs-effective, noninvasive system for cardiac output and hemodynamic analysis. American Heart Journal 116(2): 657-664.
- Malossi ACI, Blanco PJ, Crosetto P, Deparis S, Quarteroni A (2013) Implicit coupling of one-dimensional and three-dimensional blood flow models with compliant vessels. Multiscale Modeling & Simulation 11(2): 474-506.
- Sharma V, Singh A, Kansara B, Karlekar A (2011) Comparison of transthoracic electrical bioimpedance cardiac output measurement with thermodilution method in post coronary artery bypasses graft patients. Annals of Cardiac Anaesth 14(2): 104-110.
- Stevens MC, Bradley AP, Wilson SJ, Mason DG (2013) Evaluation of a morphological filter in mean cardiac output determination: application to left ventricular assist devices. Medical & Biological Engineering & Computing 51(8): 891-899.
- Córdova T, Gómez F, Romero L, Hernández MA, Solorio S, et al. (2012) Magnetic vs. Sphygmomanometry Cardiac Pressure. International Journal of Bioelectromagnetism 14(1): 22-26.




 We use cookies to ensure you get the best experience on our website.