Research Article 
 Creative Commons, CC-BY
Confocal Raman Microscopy Analysis of Ceramic-Resin Cement Junction: New Self-Etching Ceramic Primer Compared with Classic Protocol
*Corresponding author: Hugo Lambert, Geophysical and Astrophysical Fluid Dynamics, University of Exeter, England
Received: February 25, 2020; Published: March 25, 2021
DOI: 10.34297/AJBSR.2021.12.001747
Introduction
Nowadays, ceramics are widely used in dentistry because of their biocompatibility, aesthetic suitability, and improved, simplified, and reliable adhesive bonding techniques [1,2]. Ceramic adhesive restoration (CAR) has become the preferred technique for the restoration of vital or endodontic teeth [3-6]. Ceramic pretreatment involves the creation of a microrough surface, followed by the application of a ceramic primer that facilitates its bonding with a hydrophobic resin cement [7]. Classic pretreatment includes etching with hydrofluoric acid (HF), followed by the application of a primer containing organo-silane to increase the surface energy [8]. However, HF can be toxic to the human body as well as the environment-imprudent users run the risk of suffering from acute and chronic symptoms [9,10]. To simplify the pretreatment, a new self-etching ceramic primer is proposed in this study, which can be used to replace the aforementioned process with a safer, onestep protocol [11,12]. This process, which conducts etching and salinization simultaneously, serves as a viable alternative to the classic protocol. Confocal Raman microscopy (CRM) is used to compare the efficacies and environmental impacts of the proposed method and the traditional one [13].
Materials and Methods
Preparation of samples
Ten lithium disilicate reinforced ceramic (e.max Press, Ivoclar Vivadent Schaan, Lichtenstein) discs were divided into two groups of five. Each disc was cut (Isomet 2000 Bueler, Lake Bluff, IL USA) to obtain 2 hemi disc to the same size. The classic protocol for intaglio ceramic treatment was applied on the first group (n = 5). The surfaces were first etched for 60s using 5% HF (IPS Ceramic Etching Gel; Ivoclar Vivadent, Schaan, Lichtenstein). Then they were rinsed with water for 30 s, ultrasonically washed for 1 min, and dried using oil-free compressed air in succession. Finally, a silane agent (Monobond Plus (MB+)); Ivoclar Vivadent, Schaan, Lichtenstein) was applied with a microbrush onto the etched intaglio surfaces for 60 s and the excess was dispersed using a strong stream of air. The proposed method, comprising the one-step application of ceramic primer, was applied to the second group (n = 5). The intaglio surfaces were first conditioned using the Mono bond Etch & Prime system (MEP; Ivoclar Vivadent, Schaan, Lichtenstein). The solution was applied using a micro brush for 20s, and then allowed to react for an additional 40s to ensure sufficient reaction. The entire sample was then rinsed off with water for 30s and dried using oil-free compressed air for 10s. The bonding procedure was then performed according to the manufacturer’s instructions. An identical bonding protocol was used for each sample, irrespective of the implemented intaglio treatment, using a dual-cure luting resin composite (Variolink Esthetic DC Neutral, Ivoclar Vivadent, Schaan, Lichtenstein) light-cured for 1min (Bluephase Style 20i, Ivoclar Vivadent, Schaan, Lichtenstein). Finally, samples were stored in distilled water.
Confocal raman microscopy
Raman spectra of the samples thus obtained were captured using a Witec Confocal Raman Microscope System alpha 300R (Witec Inc., Ulm, Germany). A doubled Nd: YAG laser (Newport, Evry, France) with a wavelength of 532 nm was used to instigate excitation during the microscopy. A x20 Nikon objective (Nikon, Tokyo, Japan) was used to focus the incident laser beam on each sample. Using a piezoelectric table, the acquisition time of each single spectrum was set to 5s. As each image was of 200×200 resolution, an aggregate of 40000 spectra were obtained corresponding to each. Data acquisition was performed using Image Plus software from Witec.
The reference spectra on the ceramic, glue, and resin cement were obtained. Then, each representative spectrum was obtained by averaging 10 acquired spectra over a constant integration time of 10 s/spectrum using a 20x objective. These 2D images were reconstructed using the K-means cluster analysis function (WITec® Project 2.04, Ulm, Germany). K-means clustering was employed to divide the data into k mutually exclusive clusters. This method identifies the clustering in which objects within each cluster are as close to each other as possible and as far away from objects in other clusters as possible. Finally, K-means cluster analysis (KMCA) was conducted using the Witec Project Plus software (Ulm, Germany).
Results
CRM: Single spectra
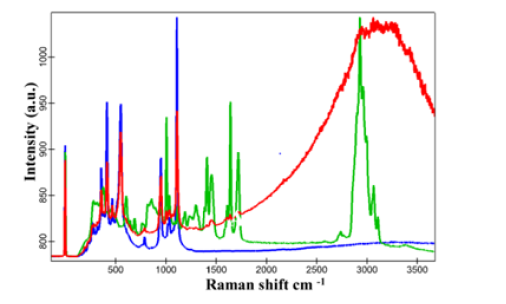
Ceramic material: The Raman active mode of e.max ceramic is depicted in figure 1 (denoted by the blue line). The spectrum is characterized by peaks between 450 and 1100 cm-1. The profile of the curve is given by the Raman scattering of silicate glass with peaks assigned to Si-O stretching vibrations in SiO4 tetrahedra. The structural unit of SiO4 tetrahedra could be different (Q species), according to the crystallization rate for example. The curve is characterized by a main peak of Si-O (Q3 conformation) at 1100 cm-1. 1035 cm-1 peak is also a Q3 conformation. A 934 cm-1 peak is a Q2 conformation. Therefore, the overall spectrum represents the Raman active mode of lithium disilicate ceramic.
Glue material: Figure 1 depicts the Raman active mode of glue (denoted by the green line). Well-defined peaks are observed to be clustered in the spectral region between 500 and 1800 cm-1, and a broad band is centered at 2950 cm-1 (νa(CH2), νs (O-CH3), and νs (α-CH3)) [14]. The Variolink aesthetic resin cement is composed of monomer mixtures of UEDMA, Bis-GMA, and TEGDMA. These resin cement materials consist of an organic phase comprising the resin matrix (ether group, C-O-C, at 1115 cm-1; alkyl group at 1180 and 1450 cm-1; carbonyl group, C=O, at 1720 cm-1; and aromatic ring at 812 cm-1), viscosity reducers, co-initiators of polymerization (C-N bond at 1240 and 1292 cm-1), and various additives. The organic matrix is incorporated with different types of inorganic fillers. Finally, the peaks at 1638 and 1610 cm-1 correspond to the reactive aliphatic C=C stretching of the vinyl group in the acrylates and methacrylates and the unreacted aromatic rings in the Bis- GMA molecule, respectively. These two peaks are commonly used to calculate the degrees of conversion of monomers. Thus, the overall spectrum represents the Raman active mode of the resin cement.

Figure 1: Average spectra of three clusters belonging to the relevant zones-green corresponds to glue, blue corresponds to ceramic, and red corresponds to the penetration zone.
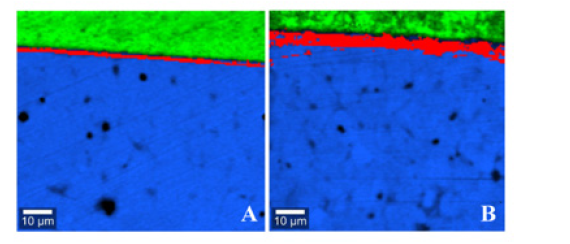
CRM: Raman imaging: Raman images of the two samples are depicted in (figures 2(a, b)). A clear delineation is apparent between the resin cement (upper side) and the ceramic (lower side). KMCA was used to isolate a specific area corresponding to characteristic peaks of both materials (denoted by the red line in figure 1). This spectrum was observed to contain the main peaks of ceramic (at 497, 529, and 1100 cm-1) that are associated with the characteristic peaks of the Raman active mode of resin cement (at 1000 and 3000 cm-1). This specific region illustrates the penetration process, including elements of both ceramic and resin cement following surface treatment using MB+ and MEP. The Raman images depicted in figure 2 emphasize the differences in penetration thickness- MEP samples (n =5) exhibited a minimum thickness of 1 μm and MB+ samples (n=5) exhibited thicknesses exceeding 4μm. Further, these differences are consistent because of the milder acidity of MEP, which induces partially glassy matrix dissolution compared to HF [15]. Nevertheless, the bond strength was not observed to be affected by the less-pronounced adhesive interlocking [15].

Figure 2: Raman imaging of ceramic-resin cement interface treated with (A) EP and (B) HF, followed by MB+.
Conclusions
CRM-based topological analysis was used to visualize the distributions of different compound concentrations via 2D hyperspectral mapping. Further, the ceramic-resin cement interface was chemically evaluated, both quantitatively and qualitatively, using the traditional protocol and the proposed alternative. Within the limitations of this study, a penetration process was observed at the ceramic-resin cement interface under both pretreatments. The penetration thickness was 1μm and 4μm for MEP (n=5) and MB+ (n=5) samples, respectively. Our observations indicate the viability of MEP as a satisfactory alternative. Further mechanical tests are required to corroborate this conclusion.
Acknowledgments
The authors are grateful to the manufacturing company, Ivoclar-Vivadent (Schaan, Lichtenstein), for the generous donation of the materials tested in this study. The authors declare no potential conflicts of interest with respect to the authorship and/or publication of this article. Raman microscopy analysis during this study was realized using the EDMOS platform which was created with the financial support of the Region Occitanie (France) and the European Regional Development Fund (ERDF).
References
- Xia H, P Pi Cart, Montresora S, Guob R, Li J C, et al. (2018) Mechanical behavior of CAD/CAM occlusal ceramic reconstruction assessed by digital color holography. Dent Mater 34(8): 1222-1234.
- El-Mowafy O, Brochu JF (2002) Longevity and clinical performance of IPS-Empress ceramic restorations--a literature review. J. Can. Dent Assoc 68(4): 233-237.
- Fages M, Stephane C, Pierre S, Jacques R, Patrick I, et al. (2017) Glass Ceramic CAD/CAM crowns and severely altered posterior teeth: a three levels study. J Mater Sci Mater Med 28(10): 145.
- Fages M, Bennasar B (2013) The endocrown: A different type of all-ceramic reconstruction for molars. J Can Dent Assoc 79: 140.
- Fages M, Raynal J, Tramini P, Cuisinier F, Durand JC (2017) Chairside Computer-Aided Design/Computer-Aided Manufacture All-Ceramic Crown and Endocrown Restorations: A 7-Year Survival Rate Study. Int J Prosthodont 30(6): 556-560.
- Fages M, Bennasar B, Raynal J (2017) Minimally Invasive All-Ceramic Preparation for the Occlusal Face: The ‘V Preparation’. Compend. Contin Educ Dent 38(2): e5-e8.
- Dejak B, Mlotkowski A (2008) Three-dimensional finite element analysis of strength and adhesion of composite resin versus ceramic inlays in molars. J Prosthet Dent 99(2): 131-140.
- El-Damanhoury HM, Gaintantzopoulou MD (2018) Self-etching ceramic primer versus hydrofluoric acid etching: Etching efficacy and bonding performance. J Prosthodont Res 62(1): 75-83.
- Özcan M, Allahbeickaraghi A, Dündar M (2012) Possible hazardous effects of hydrofluoric acid and recommendations for treatment approach: a review. Clin Oral Investig 16(1): 15-23.
- Dapieve KS, Renan VazM, Rafaela OP, Cornelis J, Kleverlaan et al. (2020) One-step ceramic primer as surface conditioner: Effect on the load-bearing capacity under fatigue of bonded lithium disilicate ceramic simplified restorations. J Mech Behav Biomed Mater 104: pp 103686.
- Murillo-GF, Palma-DR, De Goes MF (2018) Effect of acid etching on tridimensional microstructure of etchable CAD/CAM materials. Dent Mater 34(6): 944-955.
- Dimitriadi M, Zinelis S, Zafiropoulou M, Silikas N, Eliades G (2020) Self-etch silane primer: Reactivity and bonding with a lithium disilicate ceramic. Materials (Basel) 13(3): 1-16.
- Durand JC, Jacquot B, Salehi H, Margerit J, Cuisinier FJG (2012) Confocal Raman microscopy and SEM/EDS investigations of the interface between the zirconia core and veneering ceramic: The influence of a liner and regeneration firing. J Mater Sci Mater Med 23(6): 1343-1353.
- Kerdoncuff H, Pollard MR, Westergaard PG, Petersen JC, Lassen M (2017) Compact and versatile laser system for polarization-sensitive stimulated Raman spectroscopy. Opt Express 25(5): 5618-5625.
- de Siqueira FSF, Veridiana SC, Michel W, Rosa Ana CM, Rosa Ana CM, et al. (2019) Effect of self-etching primer associated to hydrofluoric acid or silane on bonding to lithium disilicate. Braz Dent J 30(2): 171-178.


 We use cookies to ensure you get the best experience on our website.