Research Article 
 Creative Commons, CC-BY
An Automated Approach to Identify RNA Editing Sites
*Corresponding author: Mohannad AL-Saghir, Department of Biological Sciences, College of Arts and Sciences, Ohio University, Zanesville, Ohio, USA.
Received: June 01, 2021; Published: June 10, 2021
DOI: 10.34297/AJBSR.2021.13.001841
Abstract
RNA-editing is one type of post transcription modifications on RNA sequences. To detect RNA-editing, one method is to compare mature mRNA (or cDNA) with the sequences in the coding region. In most existing studies, the coding region sequences were extracted from the reference genome, and therefore SNPs are also detected during this comparison. In this study, both the coding region sequences and the mature mRNAs or cDNAs were from the same genome. Therefore, the detected variations from the mature mRNAs and the coding regions would be either RNA-editing sites or sequencing errors. We developed an automated and computational approach to identify RNA editing sites and the clusters with highly frequent RNA-editing sites. The results of our computational approach provided a candidate list of genes that are most likely to contain the coding regions that represent RNA editing sites. The results also showed that most of the “A-to-G” editing sites located in the 3’ regions, followed by transcript and exonic regions. Moreover, we have provided a visualization of the editing sites within genes and chromosomes. Since the experimental clinical studies to identify the RNA editing sites are very resource intensive in terms of cost, time, and efforts, so our results will be used to define the initial candidate list of genes that should be experimentally tested.
Keywords: RNA Editing, mRNA, Genes, cDNA
Introduction
RNA editing is a broad definition for any process that changes the content of the RNA molecule. It has been observed within tRNA, mRNA, and rRNAs in a variety of species [1], which supports the theory of an evolutionary adaptation. Methods of editing usually include an insertion or deletion to a monomer or base and can change the protein that was initially coded from the DNA. RNA editing is a method of repairing and correcting sequences that may contain protein sequences and could harm the cell or organism in question [2].
As explained by Benne 1996, mRNA editing can be divided into two subcategories: insertion and deletion edits or substitution and conversion edits [3]. Insertion edits include those initially found in trypanosomes and are most often a U insertion, though more recent research has shown C, A, and G insertions as well. Substitution edits conserve the nucleotide or monomer, but substitute with a different pair. These substitutions have a profound impact on the correct functioning of the protein itself, as can be seen in mammalian B apolipoprotein. At pair 6666 the nucleotide is edited from C to U which creates a stop codon. This creation creates two separate proteins which function independently in lipid metabolism [3]. Without this edit, the originally coded sequence would have created an entirely different protein that may or may not have been usable by the cell. This interaction can possibly be explained as a method of regulating production of certain proteins, by editing post transcriptionally the cell has the option of producing two smaller proteins or the originally coded protein.
There are several methods to identify RNA editing sites such as, the separate samples and pooled samples methods, which depend on the RNA sequencing data without the need for matched genome sequencing [4]. GIREMI is another method that uses allelic linkage and generalized linear models to differentiate between RNA editing sites and genetic variations in a single RNA-seq sample [5]. RNA Editor is a method that developed a clustering algorithm to identify the distribution of editing sites [6]. Researchers at [7] used two parameters developed a prediction method to predict the distribution of RNA editing sites using two parameters called Hits Per Billion-mapped-bases (HPB) and Potential SNP Score (PPS).
The current work aims to develop an automated approach to identify RNA editing sites and the clusters with highly frequent RNA-editing sites.
Materials and Methods
Oncomine Database Analysis
RNA-seq data were obtained from the school of medicine at the University of Pittsburgh. The RNA-seq data were isolated from hepatocytes (cells of the main parenchymal tissue of the liver and different from liver tissues), which excluded all other cell types from the liver. The sequencing was performed on three unrelated mice with b6 background. The dataset includes 197123 records. Every record has detailed information such as chromosome, region, reference allele, gene name, and gene version.
Mouse SNPs were extracted and genes annotation information from Ensemble database V80, which is a publicly accessible database in which sequence data are integrated with the gene annotation. It aims to predict gene locations [8].
Comprehensive relational database was built to integrate our needed information about mouse SNPs and genes annotation. This database expediates the process of searching and querying the mouse data and permits efficient comparisons with our dataset. To perform the comparison between our generated mouse database and the data from the school of medicine, we used the chromosome as the first matching criterion, then we used the region as the second criterion to identify the strand (forward or reverse) and the distribution of editing sites.
Three methods of analysis were performed on the genes: first one is based on the total number of genes (unique ones), which counts the number of occurrences of each gene regardless of the count of each occurrence. The second kind of analysis is based on the total number of editing sites (events, not counts). The third kind of analysis is based on the ratio of counts and coverage of the editing sites. For each kind of analysis, we identified the list of top ranked genes according to a certain threshold. Additionally, we performed a statistical analysis on the editing sites and determined the location distribution of these editing sites, which means the range of the editing sites in bp, 3’, 5’, CDS, and Exon region. After that, we visualized our results to show the overall picture of RNAediting sites and density. The three methods are further discussed in the following paragraph.
In first method, the total of editing sites in each gene was considered regardless of the count for each occurrence. For example, if editing site number 1 has a count of 500, then we count this editing site one time. In the second method, the count of editing sites in each occurrence was considered. In the third method, the ratio of count and coverage was used to select the top ranked genes. We used a threshold value of 0.45, which means that we considered the editing sites that have a ratio >= 0.45. X-axis represents the genome positions and y-axis represents the count of editing sites.
After comparing the three methods, we found some discrepancies in the distribution of editing sites. The justification for this discrepancy is that the list of top ranked genes is different in the three methods. To identify the best method, we compared our results with the clinical results, and we have found that combining the three methods together will produce better results.
To get a complete view of the distribution of editing sites in the different regions, we have combined the three lists of top ranked genes in one set as provided in the following expression:
Top ranked genes =Top ranked genes list1U Top ranked genes list2 U Top ranked genes list (1)
Where Top ranked genes list1 is the list of top ranked genes using method 1 and so on. U means union.
Finally, we provided the distribution of editing sites in each gene (Gene-based analysis). We selected the top ranked genes.
Results and Discussion
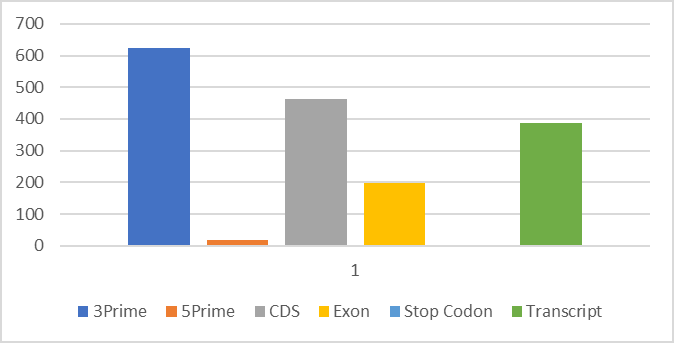
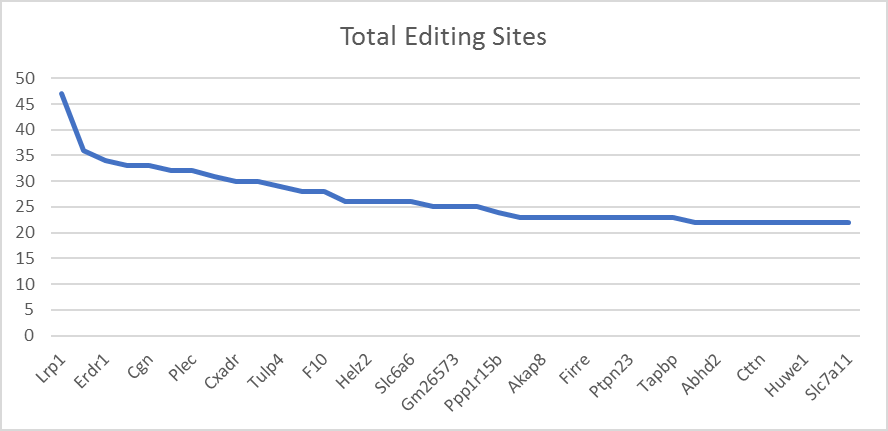
Our dataset has around 8000 distinct genes. The top ranked genes were selected according to several criteria including, total number of editing sites, count of editing sites, and the ratio of count and coverage. Based on our analysis, the results, as shown in Figure 1, most of the editing sites are “A-to-G” editing sites and located in the 3’ regions, followed by CDS and transcript and then Exon regions. In Figure 1, x axis represents the region category and y axis represents the count of the editing sites (Figure 1). Figure 2 shows an overview of editing sites across the genes in our dataset, where x axis represents gene names and y axis represents the number of editing sites (Figure 2).
Analysis Using First Method
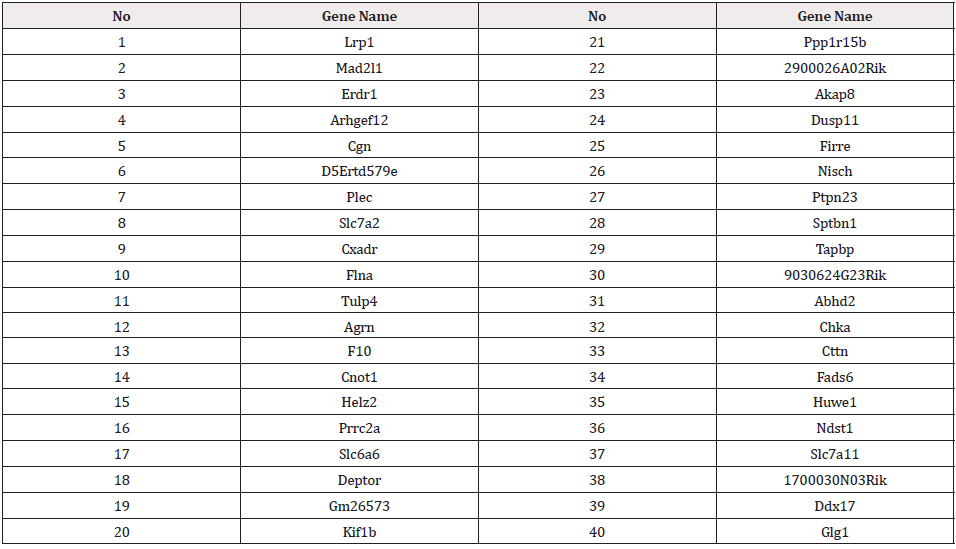
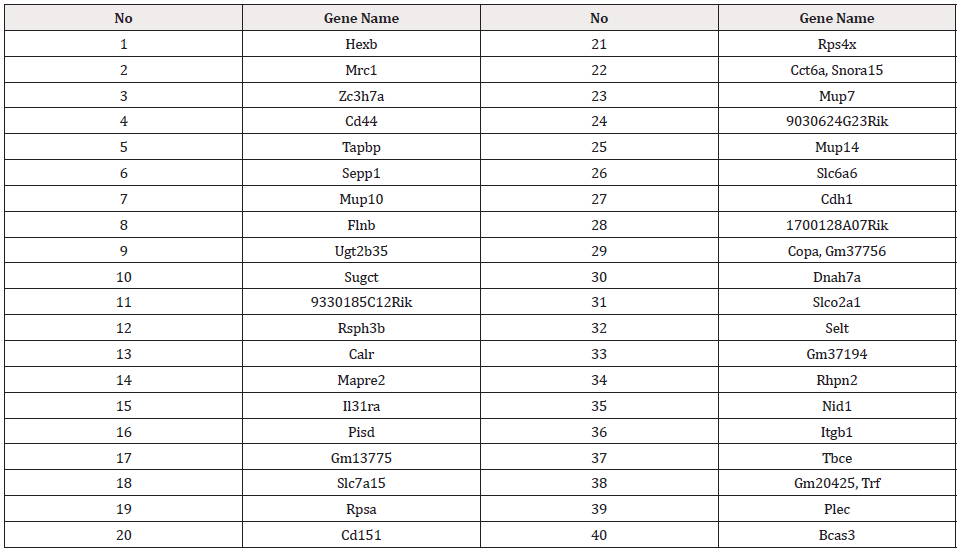
The top ranked 40 genes according to method 1 are shown in Table 1.
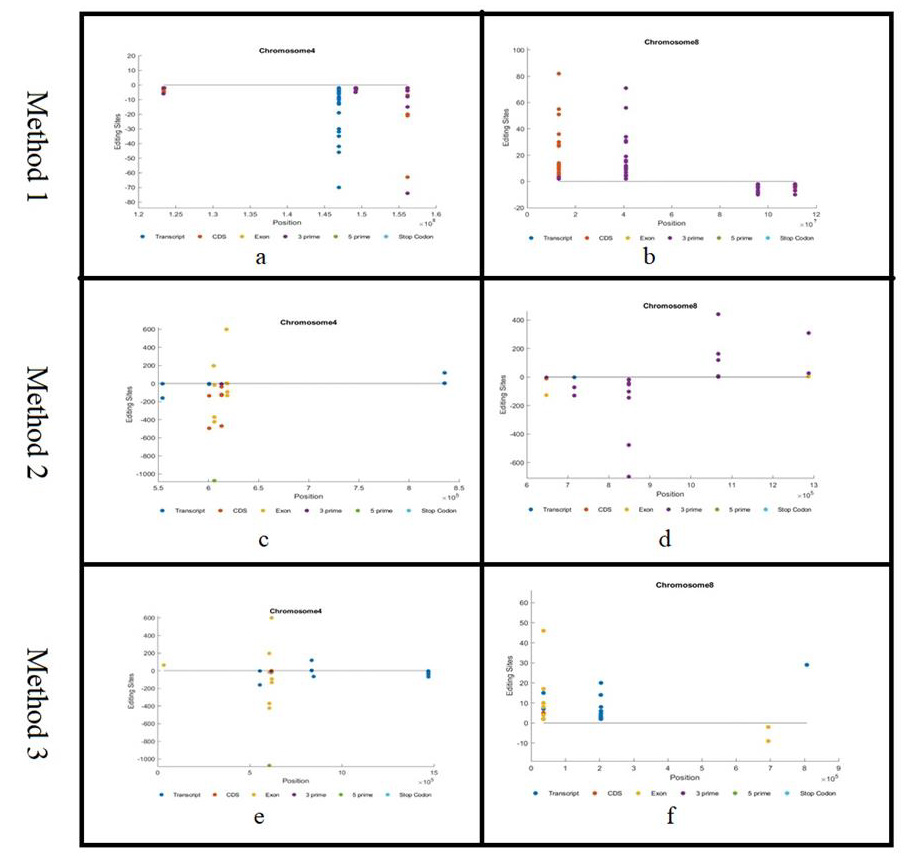
We built a distribution for each chromosome. Each distribution provides information about genetic regions, the count of editing sites, and strand (Figure 3a-3f). For example, Figure 3b shows the distribution of editing sites in chromosome 8. The x-axis represents the region, and the y-axis represents the number of occurrences of each editing sites. From this figure, we can notice that most of the editing sites are in the forward direction, in which positive direction of y-axis reflects the forward strand and the negative direction reflects the reverse strand. Most of the editing sites are in the 3’ region. The editing sites are clustered in different regions. As shown in Figure 1, the 3’ is clustered into three distinct regions and the CDS is clustered in one region.
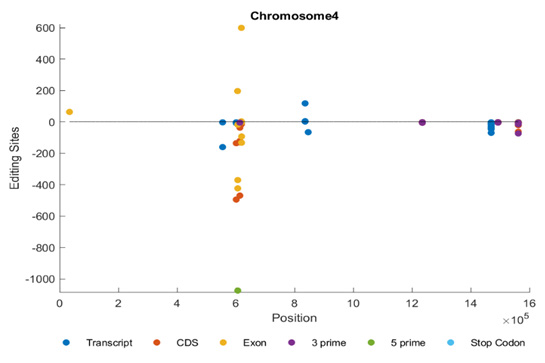
Figure 3a shows the distribution of editing sites in chromosome 4. We can notice that the editing sites are distributed among the transcript, CDS and 3’ regions. We can also notice that all of them are in the reverse strand.
Analysis Using Second Method
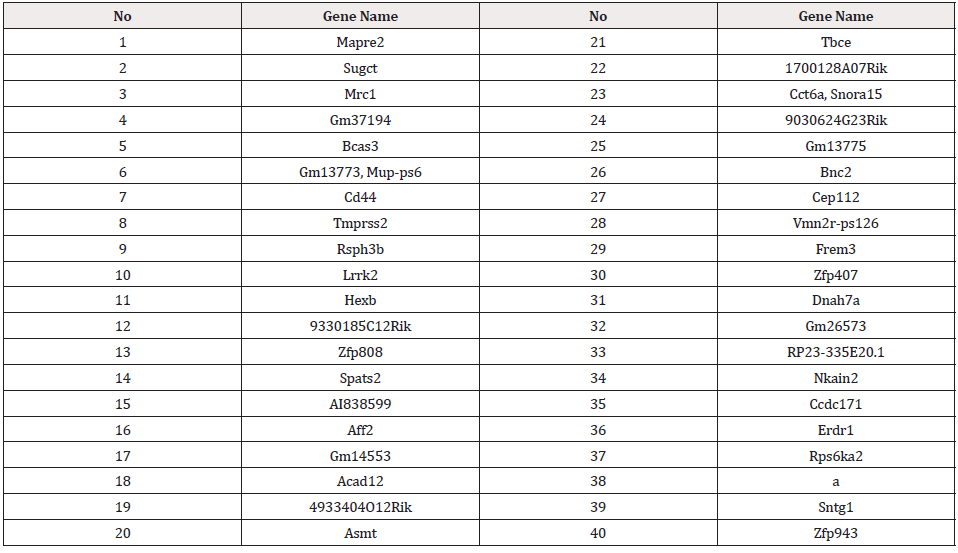
Table 2 shows the top ranked genes according to the second method.
As examples of the distribution of editing sites in each chromosome using method 2, we provided a representation of chromosomes 4 and 8. Figure 3d shows the distribution of editing sites in chromosome 8. The x-axis represents the region, and the y-axis represents the count of the editing sites. From this figure, we can notice that the editing sites are in the forward and reverse directions. Positive direction of y-axis reflects the forward strand, and the negative direction reflects the reverse strand. It is apparently clear that the distribution of editing sites in this figure is different since we consider different set of genes. Most of the editing sites are in the 3 prime regions.
Figure 3c shows the distribution of editing sites in chromosome 4. The editing sites are distributed in both positive and negative strands. They are also distributed among the transcript, CDS, exonic, and 3’ regions.
We can notice that distribution of editing sites in methods 1 and 2 are different since we are using different set of genes because of using different criteria.
Analysis Using Third Method
Table 3 shows the top ranked genes according to method 3.
Figure 3f shows the distribution of editing sites in chromosome 8. Form this figure, we can notice the editing sites are distributed among transcript and exonic regions.
Figure 3e shows the distribution of editing sites in chromosome 4. The editing sites are distributed among transcript and exonic regions.
Figure 4 shows the distribution of editing sites using the combination of all top ranked genes. We can notice that the editing sites are clustered into certain regions (Figure 4).
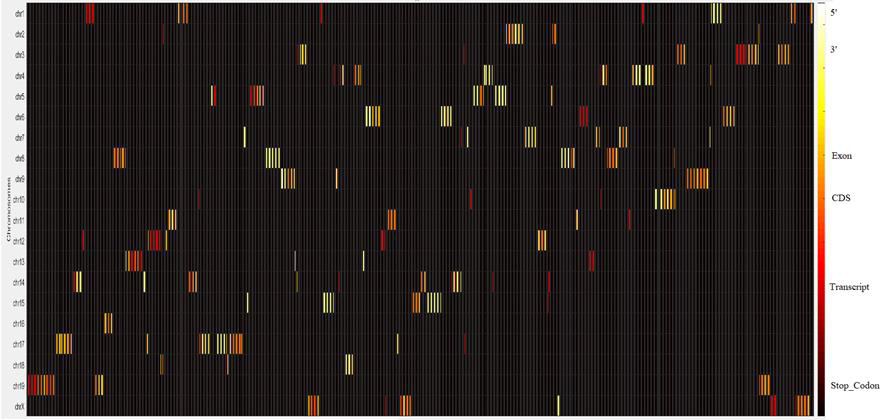
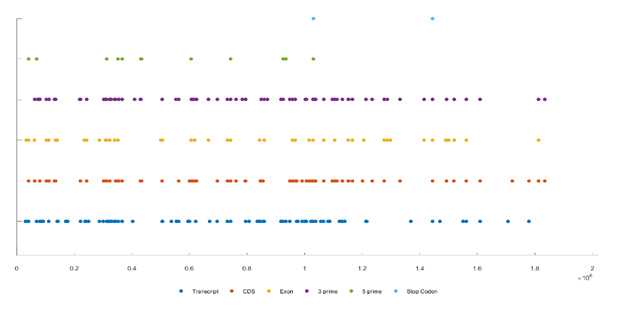
Figure 5 shows the distribution of editing sites across all genes and regions. X-axis represents the relative positions in the genome and y-axis represents the chromosomes. Different colours reflect different types including, transcript, CDS, exon, 3’, 5’, and stop codon. Most of the editing sites are in the 3’ region (yellow color). This figure provides a complete visualization of the distribution of editing sites across all chromosomes (Figure 5).
Gene-based Analysis
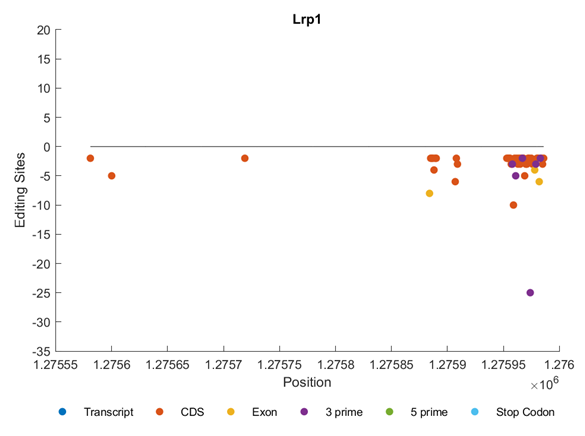
Figure 6 shows the distribution of editing sites within gene Lrp1. We can notice that the editing sites are clustered in different regions including CDS, Exon, and 3’. All of them are in the reverse direction (Figure 6).
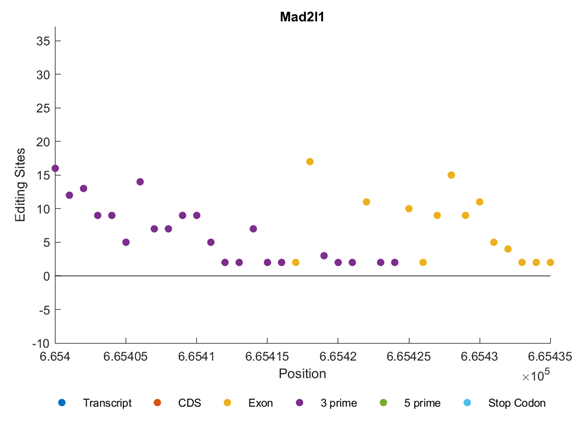
Figure 7 shows the distribution of editing sites in Mad211 gene. We can notice that the editing sites are clustered into Exons and 3’ regions. All of them are in the forward direction (Figure 7).
Figure 8 shows the distribution of all editing sites of the top ranked genes within the genetic regions. The figure gives an overview of editing sites distribution in each genetic region (Figure 8).
In our study, we found 7954 distinct genes expressed in primary hepatocytes. It is known that RNA editing is a relative rare event in the RNA pool, and it only occurs to certain RNA molecules at certain adenosine residuals. Thus, identify the edited genes and the RNA editing sites would be very challenging. Analysis of our RNA seq data found A-to-G mismatch sites, the potential editing sites. However, the experimental testing of every single gene is very time and resource consuming. To confirm the editing events, it needs to provide a candidate list of genes that are most likely to contain the coding regions that represent RNA editing sites. In our computational study, we provided three methods to get the candidate genes and we assigned a score for each gene. Based on our computational methods, we selected the top 40 ranked genes using each method. After that, we found the intersection between the top 40 genes from each method and then we provided the list of genes that are at least mentioned in two methods. Based on the intersection, we got a list of 20 genes. These candidate genes were tested through lab experiments. Experiments could positively confirm our list of 20 genes. This implies that our computational methods are very helpful and able to save time and effort by (20/7954=0.0025) times.
Conclusion
In this research, we developed an automated approach that identifies RNA editing sites and the clusters with high frequent RNA-editing sites. The top ranked genes were selected according to several criteria including, total number of editing sites, count of editing sites, and the ratio of count and coverage. We found that the ratio of count and coverage can provide more accurate results. Based on the current results, most of the editing sites are “A-to-G” editing sites and located in the 3’ regions, followed by CDS and transcript and then exonic regions. Additionally, we have provided a spatial visualization of the editing sites within genes and chromosomes.
In the future, we aim to perform a similar study on different species and determine whether they have the same patterns or there are any species-specific patterns.
Data Availability
All datasets generated or processed during this study are available upon reasonable request from the corresponding author.
Conflict of Interest
The Author(s) declare(s) that there is no conflict of interest.” If there are potential conflicts of interest.
References
- Ouyang Z, Liu F, Zhao C, Ren C, An G, et al. (2028) Accurate identification of RNA editing sites from primitive sequence with deep neural networks. Sci Rep 8(1): 6005.
- Su A, L Randau (2011) A-to-I and C-to-U editing within transfer RNAs. Biochemistry (Mosc) 76(8): 932-937.
- Benne R (1996) RNA editing: how a message is changed. Curr Opin Genet Dev 6(2): 221-231.
- Ramaswami G, Zhang R, Piskol R, Keegan LP, Deng P, et al. (2013) Identifying RNA editing sites using RNA sequencing data alone. Nat Methods 10(2): 128-132.
- Zhang Q, X Xiao (2015) Genome sequence-independent identification of RNA editing sites. Nat Methods 12(4): 347-350.
- John D, Weirick T, Dimmeler S, Uchida S (2017) RNAEditor: easy detection of RNA editing events and the introduction of editing islands. Brief Bioinform 18(6): 993-1001.
- Zhu S, Xiang JF, Chen T, Chen LL, Yang L (2013) Prediction of constitutive A-to-I editing sites from human transcriptomes in the absence of genomic sequence. BMC Genomics 14: 206.
- Ruffier M, Kähäri A, Komorowska M, Keenan S, Laird M, et al. (2017) Ensembl core software resources: storage and programmatic access for DNA sequence and genome annotation. Database (Oxford) 2017(1): bax020.



 We use cookies to ensure you get the best experience on our website.