Research Article 
![]() Creative Commons, CC-BY
Creative Commons, CC-BY
Simulation of a multiscale model of the Heart
*Corresponding author: Paniagua ED, CardioForma LLC Houston Texas, Berkeley, US.
Received: July 12, 2021; Published: July 21, 2021
DOI: 10.34297/AJBSR.2021.13.001894
Abstract
The heart is comprised of four chambers, which function due to pressure changes across each chamber during the cardiac cycle. When observed at the microscopic level, these pressure changes are generated by calcium and troponin C binding in the cross-bridge cycle of a sarcomere. This binding creates a ratchet and stroke interplay which creates contraction in the muscle. This contraction exerts a force which in the heart causes the chambers to generatea force. This force creates pressure changes to move the fluid (blood) from one chamber to another. The method used in this report incorporates these considerations to model the pressure volume curves of the left ventricle and left atrium. The other chambers are modeled using the elastance theory. This article includes a literature review of several aspects of the cardiovascular system from the molecular to the anatomical level and simulates the cardiovascular system using a multiscale model inspired from previous articles and compliments what has been previously described [1–9]. Data acquired will be reproduced and analyzed using MATLAB.
Background
Human Heart
The heart from a fluid dynamics perspective can be viewed as two pulsatile pumps. One pump consists of the right atrium and right ventricle, and the other pump consists of the left atrium and left ventricle (Figure 1). Each chamber (atrium or ventricle) has a valve (tricuspid, pulmonary, mitral, and aortic) which allows flow only in one direction and works as function of pressure gradients across each valve due to chamber contractions and expansions. Out of the four valves, only one valve is a bi-leaflet valve (mitral) having only two cusp or pockets (Figure 1b). The rest of the valves are tri-leaflet having three cusps. The aortic and pulmonary valves are similar in design and material properties [12]. The mitral and tricuspid valve are similar in appearance, both are held by chords of tendinea. However, the mitral valve has significantly higher transvalvular pressures (~110mm Hg) than the tricuspid valve (~15 mm Hg)
Cross Bridge Cycle
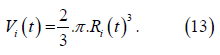
The cross-bridge cycle is the process that causes muscle contraction. Under tension, the muscle contracts, this contraction is due to shortening of the sarcomere. In the sarcomere, there are actin and myosin filaments. Actin is a protein polymer surrounded by tropomyosin and troponin molecules. The cycle has four steps (Figure 2), step one is the cross-bridge formation where the myosin head strongly attaches to an actin filament. Step two is the power stroke, ADP is released from the myosin head causing the power stroke. Step three is the cross bridge detachment where ATP binds to myosin, breaking the cross-bridge. Step four, ATP gets hydrolyzed into ADP and inorganic phosphate this causes the myosin head to cock. When inorganic Phosphate is released the myosin head weakly binds to the actin filament [13].

Figure 1: The human heart showing (a) all four chambers and (b) the four heart valves (aortic, mitral, pulmonary, and tricuspid valve). Images obtained from Mayo Clinic and A.D.A.M.
Cardiac Cycle
The cardiac cycle has two phases with respect to pressures, the systolic and the diastolic phase (Figure 2). When the left ventricle begins to contract, it causes a raise in pressure in the ventricular chamber. Once the pressure in the left ventricle is greater than the pressure in the aorta, the aortic valve begins to open. At this moment, the systolic phase begins. When the aortic valve is fully closed, the systolic phase ends and the diastolic phase begins. With respect to flow across the aortic valve, there are three phases to consider: forward flow, closing, and the leakage phase. The forward flow phase consists of the flow going across the valve, beginning of systole. The closing phase is the regurgitant flow across the valve during the closing of the leaflets. The leakage phase is measured when the valve is fully closed. During a normal heart rate (70 beats per minute), the systolic phase has a duration of approximately 35%of the cardiac cycle and the diastolic phase has a duration of approximately 65%. The ventricular pressure changes from approximately 5 mm Hg during diastolic phase to peak pressure of approximately 120 mm Hg during systolic phase [14]. The aortic mean pressure in the diastolic phase is approximately 90 mm Hg and during systolic phase approximately 110 mm Hg. Figure 3 illustrates the aortic and ventricular pressure as well as the flow as function of time. The timing of the aortic valve opening (AO) and closing (AC) is illustrated.

Figure 2: Cross-bridge cycle. [13]

Figure 3: The cardiac cycle across the aortic heart valve [14]
Pressure Volume Curve
P-V loops were first used in the late 1700s by James Watt and John Southern to calculate the work performed by steam engines. Later, this principle was applied to medicine for understanding cardiovascular physiology, beginning with Otto Frank’s studies of pressure volume relationships in the late 1800s [2,3]. These studies contributed to the development of the Frank-Starling law, which states “that the energy of contraction, however measured, is a function of the length of muscle fibers” prior to contraction (Figure 1) [4]. As early as the 1950s, Sarnoff and Berglund estimated stroke work as the mean arterial pressure minus the mean left atrial pressure multiplied by stroke volume (SV), and they plotted that value as a function of filling pressure. They found a non-linear curve of ventricular function with an initial steep rise [5]. In the 1960s, Hiroyuki Suga discovered that various curves for end-systolic pressure volume relationship (ESPVR) fell on a straight line [6- 8]. In the 1980s, Kass and others used conductance catheters to contribute invaluable work on human cardiac physiology [9-11].
The main function of the heart is to drive blood from one chamber to another. Blood must travel from the veins to the right atrium, cross the tricuspid valve and enters the right ventricle leading to the lungs and returns to the left side of the heart exiting to the aorta. In each chamber, this is a function of pressure and volume. Pressure is the driver of blood from one chamber to another, and volume defines how much blood was transferred. Figure 4 shows atypical pressure volume (PV) curve.

Figure 4: left ventricle pressure volume curve.
From Figure 4, the left ventricular (LV) volume is plotted on the x-axis and LV pressure (mmHg) is plotted on the y- axis. For the purpose of explanation, the cycle will be divided into four phases and four points corresponding to the four limbs of the curve. Phase “a” is the end diastolic pressure volume relationship (EDPVR), which is the filling phase for the ventricle. At point 1, the mitral valve closes and ventricular pressure begins to rise. This point represents enddiastolic volume. There is no change in volume in phase “b”, which is also called iso-volumetric contraction. At point 2, the ventricular pressure exceeds the aortic pressure, thus the aortic valve opens and the ventricle starts ejecting blood into aorta (phase c). At point 3, the aortic valve closes and ventricular relaxation begins, which also represents end- systolic pressure. As the ventricles begin to relax, the pressure drops to point 4 without a change in volume. This phase “d” is also referred to as iso-volumetric relaxation.
This interest dates back to the 1900s with Henderson, 1960s and 1970s with Starlin, Katz, Suga, and Sagawa [15,16,17]. Figure 5 is seminal work done by Suga and Sugawa in 70s.

Figure 5: Pressure volume curves of the ventricle in a canine model obtained from Suga [5,6]. (a) Control and pressure volume changes due to Epinephrine. (b) shows a constant mean arterial pressure.
Methodology
The model used is a multi-scale cardiovascular system model. This model begins with the intracellular calcium concentration in the atrium and ventricle, which is then used to characterize the sarcomere behavior and concentration of cross-bridges. Figure 6 shows the block diagram of the model and Table 1 shows the model variables meaning and units which are used below from [1].

Figure 6: Diagram of the inputs and outputs of the model. [1]

Table 1: Model variables
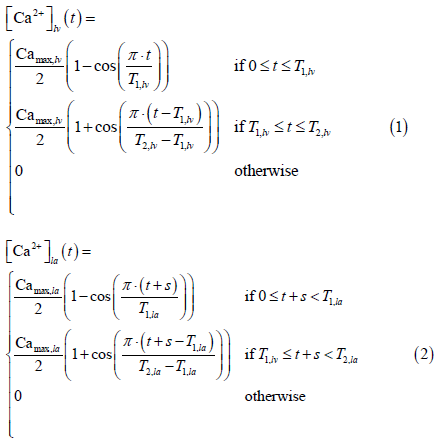
Calcium Inputs
The reference curves were generated by Antoine and others, the left ventricle data is taken from experiment studies of Ferrets [1], and the model for the left atrium are from human atrial cell simulations of mathematical models [1]. These models account for a heart cycle of 0.45s. The equations for the left ventricle and left atrium are as follow:
LV & LA sarcomere model
The sarcomere model used in this work was presented by Negroni and Lascano [18]. The equations are as follow:
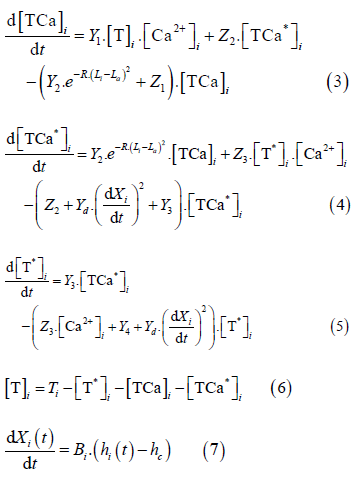
Where the subscript I denotes either LV or LA.
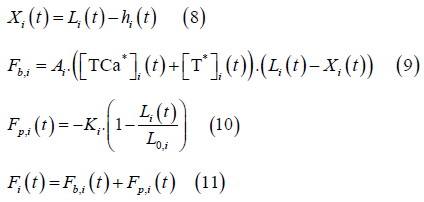
Cardiac Chamber Model
Pressure 𝑃i in the cardiac chamber is computed using Laplace’s Law:
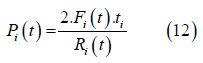
Where 𝐹i is the total force generated vy the equivalent sarcomere, 𝑡i is the thickness and 𝑅i is the radius of the chamber. This equation will be used to model the left ventricle and left atrium. The chamber volume equation is:
The relationship between the micro and macroscopic scales are made assuming radial deformation of the ventricle is equal to deformation of sarcomere:
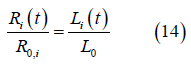
Where 𝑅0,i is the unstressed chamber radius and 𝐿0” is the unstressed sarcomere length.
Cardiovascular Model
The cardiovascular model is shown in Figure 7. This model uses seven chambers, which are the left ventricle (LV), left atrium (LA), aorta (Ao), pulmonary vein (PV), pulmonary artery (PA), right ventricle (RV), and vena cava (VC).
In each chamber there are variables to consider, pressure, volume, resistance, and elastance. From one chamber to another there are resistances (valves and blood vessel resistance) to consider. There is the tricuspid valve (tc), pulmonary valve (pv), pulmonary resistance (pul), pulmonary vein resistance (prox), mitral valve (mt), aortic valve (av), and systemic resistance (sys).
The chambers Ao, VC, PA, and PV are represented by Pironet as passive where the pressure equation is a function of elastance and volume as shown:
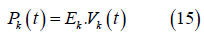

Figure 7: Cardiovascular model incorporating seven chambers (LA, LV, RV, Ao, VC, PA, & PV). [1]
Where 𝑃k is the elastance and is the volume. the subscript k denotes Ao, VC, PA, PV. The pressure equation for the RV is also described using the elastance concept:
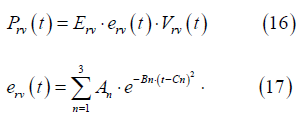
Where erv (t) is time varying elastance Gaussian function of the
RV and 𝐸rv is a normalized constant. 𝐴n, 𝐵n,
𝐶n and are constants.
The flow equation is defined by:
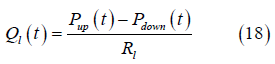
Where 𝑃up and 𝑃down is the pressure above and below the valve, respectively. 𝑅l is the resistance and 𝑙 = 𝑠𝑦𝑠, 𝑝𝑢𝑙, 𝑚𝑡, 𝑎𝑣, 𝑡𝑐, 𝑝𝑣. The heart valves (aortic, mitral, pulmonary, and tricuspid) are modeled as diodes. This assumption assumes the valves are considered ideal, thus they do not have a closing or leakage volume. Equation 18 is modified to:
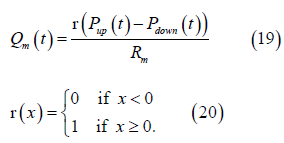
Where r is the ramp function. The volume of the chamber is derived from the continuity equation:
Where 𝑄in and 𝑄out. are the flows coming in and out of the chamber, p = LV, LA, Ao, RV, PA, PV.
Results/ Discussion
The simulation was done in MATLAB using the numerical integration scheme using the ode15s provided in MATLAB. The maximum allowed time-step was 0.001s with a relative error tolerance of 0.0001. The maximum number of iterations was 100 thousand, total time 100 seconds. This model was done through the use of experimental work performed on canines. The parameter for the model is provided in the appendix.
Calcium inputs and Sarcomere model
The intracellular calcium concentrations in the left ventricle and left atrium is shown in Figure 8A. The concentration of troponin C bound with calcium for cross-bridge attachment and detachment is shown in Figure 7B and 8C, respectively for the left ventricle and left atrium. The concentration of troponin C not bound with calcium for cross- bridge attachment and detachment is shown in Figure 8D, 8E, respectively for the left ventricle and left atrium.
From Figure 8, the calcium concentration in the left atrium and left ventricle has a time delay. The delay is of 0.055s after calcium centration is zero for the left atrium. The duration of calcium concentration in the LA is short (~0.03s) compared to the LV (0.10s), roughly three times larger for the LV, which would be necessary for ventricular contraction. This is also true for the amount of troponin C that bounds and not bounds for the attachment and detachment of the cross-bridge cycle. The LV has more muscle, thus containing more sarcomeres, and needing more calcium and Troponin C for contraction.
The force generated by the sarcomere is shown in Figure 9.
From Figure 9, the sarcomere force in the LV resembles the left ventricular pressure waveform. The passive force remains close to zero and the active force is the driver for contraction. For the LA, the passive force varies throughout the cardiac cycle. The passive force is responsible for filling of the LA and goes negative during contraction. The active force in the LA is only active during contraction of the chamber, which counter acts the negative passive force generated, followed by returning to zero. Observing the total force of the LA, more force is generated by the sarcomere during filling than contraction.
The pressure and flow plots across all four heart valves are shown in Figure 10. These valves are the aortic, mitral, pulmonary, and tricuspid valve.
From Figure 10, the heart can be separated into two sections left (Figure 9A 9B) and right (Figure 9C D). The ventricles and atriums contract almost simultaneously, however, there is a slight delay. When comparing the aortic and pulmonary valves, the aortic valve opens followed by the pulmonary valve and the aortic closes before the pulmonary. The flow across the aortic valve begins with a sharp rise followed by a decreased slope. The flow across the pulmonary also begins with a sharp rise, however, the flow curve has a double hump (Figure 9C). This double hump slightly modifies the pressure waveform with a minor plateau followed by an increase in pressure.
Comparing the mitral and tricuspid valve, the tricuspid valve opens first and closes last (Figure10D). The mitral flows towards mid of the cycle has a sharp upstroke which is cause by the active sarcomere contraction (10B). The flow across the tricuspid valve has a squarer shape to it (Figure 10D).

Figure 8: Calcium and troponin C concentrations. (A) [𝐶𝑎!”] intracellular concentration. (B) Cross-bridge attachment of the concentration of troponin C that bounds with [𝐶𝑎!”]. (C) Cross-bridge detachment of the concentration of troponin C that bounds with [𝐶𝑎!”].(D) Cross-bridge attachment of the concentration of troponin C that does not bounds with [𝐶𝑎!”] . (E) Cross-bridge detachment of the concentration of troponin C that does not bounds with [𝐶𝑎!”].

Figure 9: (A) left ventricle and (B) left atrium sarcomere force showing passive, active, and total force generated. Units are in mN/mm²

Figure 10: pressure gradients and flow rates across all four valves. (A) Aortic, (B) mitral, (C) pulmonary, and (D) tricuspid flow. Units are in mm Hg and ml/s
The volumes used for the seven-chamber model are shown in Figure 11.
From Figure 11, when the ventricles contracts at roughly 70.2s a rise in volume is observed (Figure 11A, C, D, E, G). On the contrary, when the atriums contract, there is a decrease in volume (Figure 8B, F). this is due to volume entering and leaving each chamber.
The pressure volume curves for the left ventricle, left atrium, and right ventricle is shown in Figure 12.

Figure 11: Chamber volumes. (A) aortic, (B), left ventricle, (C) left atrium, (D) pulmonary vein, (E) pulmonary artery, (F) right ventricle, (G) vena cava.
From Figure 12, the pressure volume curves can characterize the changes a chamber in the heart undergoes. The left ventricle depicts the function of the aortic and mitral valve (Figure 9A). The right ventricle shows the function of the pulmonary and tricuspid valve (Figure 9B). The left atrium’s pressure volume curve creates two loops. These loops are identified by ”a” and “v” (Figure 9C), where “v” loop is a volume dependent waveform and “a” is pressure generated wave [1,19,20].
Following this work, it has been mentioned that the timevarying elastance theory has limitations in accounting for adequate pressure volume curves [21]. This is due to the EDPVR or ESPVR only capturing a certain group parameter and if deviated from those parameters the curves would not correlate. Thus, incorporation of the sarcomere to the model more accurately simulates pressure volume curves with different parameters as shown in Figure 12. However, it is important to note that time-varying elastance theory has been used for ~40 years and papers from Suga and Sagawa have been cited over 1,000 times.

Figure 12: Pressure volume curves of the (A) left ventricle, (B) right ventricle, and (C) left atrium. AC and AO is aortic closed and open, MO and MC is mitral open and closed, PO and PC is pulmonary open and closed, and TO and TC is tricuspid open and closed

Figure 13: Pressure volume loops showing the variations of end systolic pressure volume relationship (ESPVR) [1][9].
Conclusion
In conclusion, pressure volume loops provide useful information about cardiac physiology and energetics that can aid in diagnosing and monitoring the progress of patients with cardiac diseases. To address this many years experimental and numerical models have been done. Newer models seem to account the use of sarcomeres to more adequately depict the PV loops. In this report following the work done by Pironet, the pressure volume curves were generated using a model that accounts for the intracellular calcium and troponin C attachment and detachment of the cross- bridge cycle causing sarcomere contraction force (passive and active). This model accounts for seven chambers (aortic, left ventricle, left atrium, pulmonary vein, pulmonary artery, right ventricle, and vena cava.
Appendix
Parameter Values
Table 2
Table 3

Table 2: Model parameter values (Part A) [1]

Table 3: Model parameter values (Part B) [1]
References
- Pironet A, Dauby P, Paeme S, Kosta S, Chase G, et al (2013) Simulation of left atrial function using a multi-scale model of the cardiovascular system. Plos One 8(6).
- Frank O (1895) Zur Dynamik des Herzmuskels. Z Biol 32: 370-447.
- Otto F (1959) On the Dynamics of Cardiac Muscle. American Heart Journal 58(3): 467-478.
- Allen DG, Kentish JC (1985) The cellular basis of the length-tension relation in cardiac muscle. Journal of molecular and cellular cardiology 17(9): 821-840.
- Sarnoff SJ, Berglund E (1954) Ventricular function. I. Starling's law of the heart studied by means of simultaneous right and left ventricular function curves in the dog. Circulation 9(5): 706-718.
- Suga H (1969) Time course of left ventricular pressure-volume relationship under various end diastolic volume. Japanese heart journal 10(60): 509-515.
- Suga H (1971) Theoretical analysis of a left-ventricular pumping model based on the systolic time-varying pressure-volume ratio. IEEE transactions on bio-medical engineering 18(1): 47-55.
- Suga H, Sagawa K (1972) Mathematical interrelationship between instantaneous ventricularpressure-volume ratio and myocardial force- velocity relation. Annals of biomedical engineering 1(2): 160-181.
- Kass DA, Yamazaki T, Burkhoff D, Maughan WL, Sagawa K (1986) Determination of left ventricular end-systolic pressure-volume relationships by the conductance (volume) catheter technique. Circulation 73(3): 586-595.
- Kass DA, Midei M, Brinker J, Maughan WL (1990) Influence of coronary occlusion during PTCA on end-systolic and end-diastolic pressure-volume relations in humans. Circulation 81(2): 447-460.
- Kass DA, Wolff MR, Ting CT, Liu CP, Chang MS, et al. (1993) Diastolic compliance of hypertrophied ventricle is not acutely altered by pharmacologic agents influencing active processes. Annals of internal medicine 119(6): 466-473.
- Stradins P, Lacis R, Ozolanta I, Purina B, Ose V, et al. (2004) Comparision of biomechanical and structural properties between human aortic and pulmonary valve. European Journal of Cardio-thoracic surgery 26(3): 634-639.
- Silverthorn, Unglaub D, et al. (2010) Human Physiology: an Integrated Approach. London: Pearson.
- Chandran KB, et al. (2012) Biofluid Mechanics: the Human Circulation. CRC Press, Taylor & Francis Group.
- Suga H, Sagawa K, Shoukas AA (1973) Load Independence of the Instantaneous Pressure-Volume Ratio of the Canine Left Ventricle and Effects of Epinephrine and Heart Rate Ratio. Circulation Research 32(3): 314-322.
- Suga H, Sagawa K (1974) Instantaneous Pressure-Volume Relationships and their Ratio in the Excised Supported Canine Left Ventricle. Canine Left Ventricle and Effects of Epinephrine and Heart Rate Ratio. Circulation Research 35(1): 117-126.
- Henderson Y (1906) Volume curve of the ventricles of the mammalian heart, and the significance of this curve in respect to mechanics of the heart beat and filling of the ventricles. Am J Physiol 16: 325-367.
- Negroni JA, Lascano EC (1996) A cardiac muscle model relating sarcomere dynamics to calcium kinetics. Journal of molecular and cellular cardiology 28(5): 915-929.
- Matsuda Y, Ogawa H (1983) Importance of left atrial function in patients with myocardial infarction. Circulation 67: 566-571.
- Nygren A, Fiset C, Firek L, Clark JW, Lindblad D, et al. (1998) Mathematical model of an adult human atrial cell: the role of K+ currents in repolarization. Circulation Research 82: 63-81.
- Pironet A, Desaive T, Kosta S, Lucas A, Paeme S, et al. (2013) A multi-scale cardiovascular system model can account for the load-dependence of the end-systolic pressure- volume relationship. Biomedical Engineering Online 12.


 We use cookies to ensure you get the best experience on our website.