Mini Review 
 Creative Commons, CC-BY
Techniques and Instruments used for Implementing Risk Management in a Medical Laboratory
*Corresponding author: Remona Eliza David, Department of Laboratory Medicine, George Emil Palade University of Medicine, Pharmacy, Science and Technology of Targu Mures, 38 Gheorghe Marinescu Street, Targu Mures, 540139, Romania, Tel: + 40 740- 168508
Received: May 15, 2021; Published: May 21, 2021
DOI: 10.34297/AJBSR.2021.13.001821
Keywords: Risk management; SIPOC; Process map; FMEA; Risk matrix; FTA
Introduction
Due to development and the diversity of services offered by the medical laboratories, hospitals and companies producing medical equipment, and due to globalization, which makes the market competition to be tougher and tougher, within one organization it was developed a series of specific management systems, compounds of global management system. At this point, there is no domain in which risk management is not granted a specific importance. One of the domains in which risks can have serious effects is the quality management system.
This paper is trying to create radiography of the risk evaluation methods and techniques used in different industries with the purpose of highlighting the advantages (strengths) and disadvantages (weaknesses) applying them in comparison with the opportunities and difficulties (threats) existing at a given point in the medical laboratory. However, it has to be mentioned that not the methods and the techniques are the most important, but the attitude towards risk.
Why is the Risk Management Necessary?
Each of us encountered numerous difficulties that prevented reaching the desired objective, saying: “If I had known that this was going to happen, I would have acted in a different manner”. When we say this, we express our regret that we have not identified the risk in order to take the necessary measures, and this became a state which led to consequences (impact) over what we have established to accomplish. Even if we are aware of risk existence and the worry to prevent the risks is not something new, we must find answers to the questions: “Why is a risk management necessary?” and “Which is the risk management implementing methodology?”
State of the Art
In the medical laboratory, risk management applied to the total testing process (TTP) represents, only for a few years now, an accreditation requirement mentioned in the SR EN ISO 15189:2012, section 4.14.6, even if it is applied in medicine from the beginning of 1980s. However, ISO 15189:2012 does not mention a risk management implementation methodology [1]. This, gives the laboratories the possibilities to get familiar with the notions of risk and risk management and thus, to be able to choose the appropriate methods for the risk management.
A recent publication of European Federation of Clinical Chemistry a Laboratory Medicine (EFLM) Working Group for the Pre-analytical Phase (WG-PRE) states that the authors of the standard ISO 15189:2012, intentionally they did not mention how medical laboratories could fulfill the accreditation requirements, and offer them an expert guidance [2].
The purpose of integrating the process of identification in the quality management, according to the description of ISO 15189:2012 (section 4.2) and ISO 22367:2020 (the section 4.2), evaluation and treatment of risks and opportunities is to guide the medical laboratory to a preventing aproach, having as outcome the increase of efficiency and effectiveness of its management system. ISO 22367:2020 (Annex A), which offers guideline for the risk management implementation in the laboratory quality management, introduced the term “risk-based thinking” (that is not present in ISO 15189:2012) and it is mentioned the fact that relevant information from the laboratory’s examination processes should be continuously monitored, analyzed and used for the risk evaluation reviewing referring to the term “preventing action” (ISO 15189:2012, section 4.11) [1,3].
In SR EN ISO 9001:2015, the term “preventing action” was replaced with the term “risk-based thinking”, thus allowing prescriptive demands reduction and their replacement with performance-based demands [4]. We mention that the term “riskbased thinking” was also present in the previous editions to the present international standard. Risk-based thinking determines a more realistic approach of the medical laboratories objectives and implementing of some measures that could lead to reaching the proposed targets and performance increasing. Risk-based thinking is something that laboratories do automatically in their daily activities.
Considering the changes made in the latest versions of the ISO 9001:2015 and ISO 22367:2020, we can consider that these changes represent the transition to a new version of ISO 15189, in which we can find clearer specifications of the risk management, and why not, abandoning the term “preventive action” for the term “risk-based thinking” [1,3,4]. Medical laboratories can implement processes based on methodologies and guidelines of some specific standards, such as:
I. SR ISO 31000:2018 – Risk Management – Guidelines [5];
II. SR EN CEI/ISO 31010:2020 – Risk Management - Risk
assessment techniques [6];
III. SR Ghid ISO 73:2010 – Risk Management – Vocabulary
[7];
IV. ISO/IEC Guide 51:2014: Safety aspects – Guidelines for
their inclusion in standards [8];
V. CLSI EP18 – Risk Management Techniques to Identify and
Control Laboratory Error Sources [9];
VI. CLSI EP 23 – Laboratory Quality Control Based on Risk
Management [10].
SR ISO 31000:2018 and ISO 22367:2020 describe in detail, systematically and logically the risk management process but there is no standard methodology for their implementation in the medical laboratory [3,5]. CLSI standards offer more detailed and practical guidelines for the medical laboratory than ISO standards.
Therefore, the laboratories must decide to adopt their own methodology or to modify the available methodologies by applying other techniques and standards for a practical approach of risk management in the analyzed processes.
We asked ourselves the question ”What should we do to fulfill the standard’s demand to implement risk management?”, and suddenly we realized that we do not know how this process actually takes place and who does what.
In our laboratory for instance, we adopted a risk management design recommended by ISO 31000:2018, which divides the risk management process in 5 stages (planning risk management process, risk identification, risk analyses, elaborating risk response plan, risk monitoring and control) which we were able to develop as practical as possible, using the most appropriate risk management instruments [5].
Risk Management Instruments
From the beginning we took into consideration that the most important stage of risk management is risk identification (which could happen and does not comply to the acreditation demands or has the potential to affect pacients, clients or employee’s safety) for the process of interest.
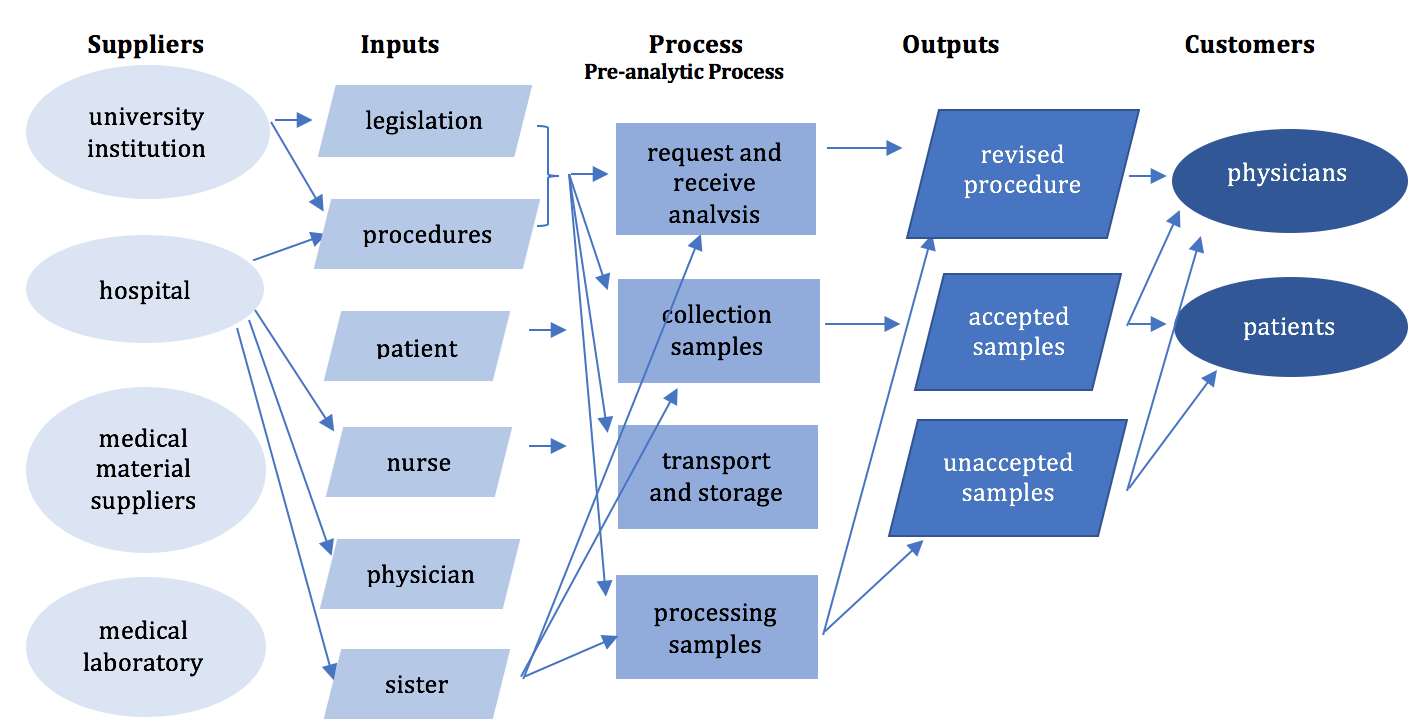
Before starting the improvement activity of a process, it must be understood the process importance and contribution in order to achieve the desired objectives. SIPOC diagram (Figure 1) is a method that offers an overview image of the process, the direction of the information flow, as well as the beneficiaries of the process [11].
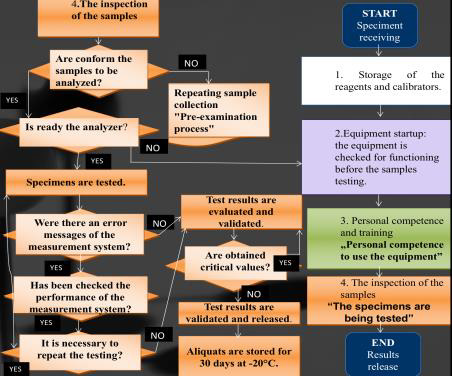
A practical approach is to identify the main stages or the process activities and then to decide the order in which they will take place, thus designing the process map (Figure 2). After that, each step or activity is assessed to identify the possible undesired events (possible nonconforming events or risks), most of the times during the brainstorming meetings (Figure 3). The brainstorming result represents the list of potential undesired events, these could be grouped and graphically represented as Isikawa diagram or “fishbone” diagram [11].
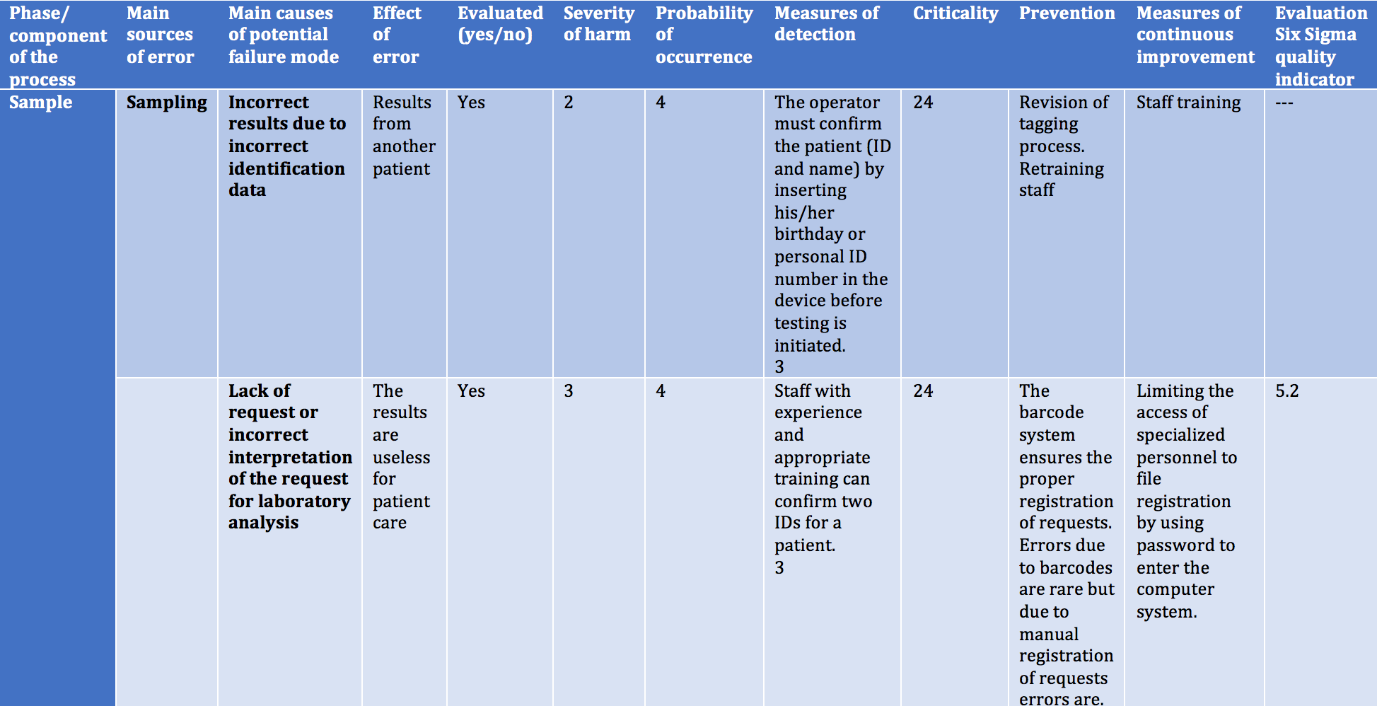
Once the potential nonconforming events have been identified, the risk associated can be then evaluated. FMEA/FMECA technique (Figure 4) priorities the possible nonconforming events taking into consideration their probability of appearance and the impact that they can have over the initial objectives [9,12,13].
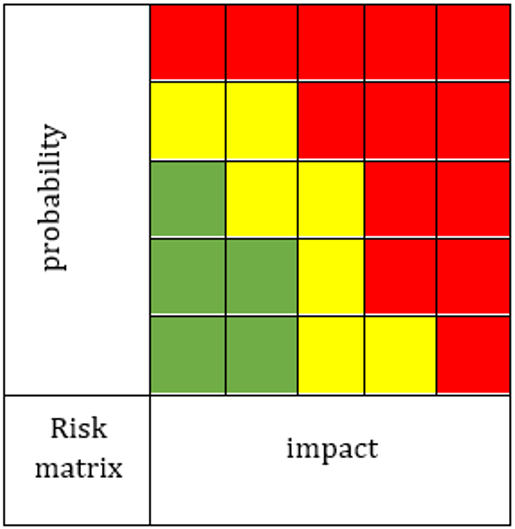
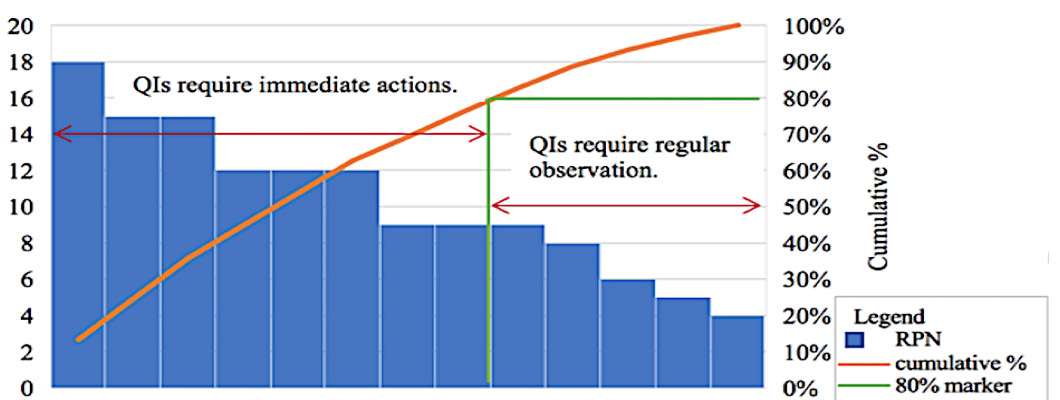
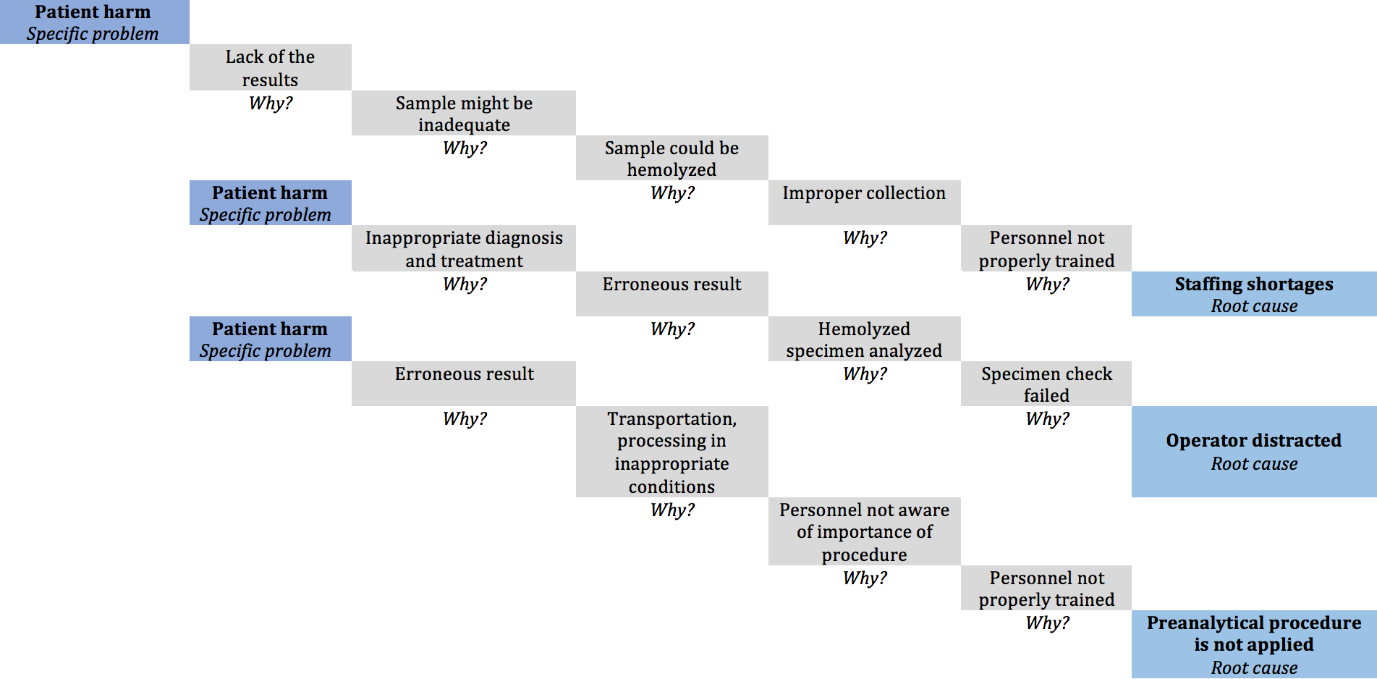
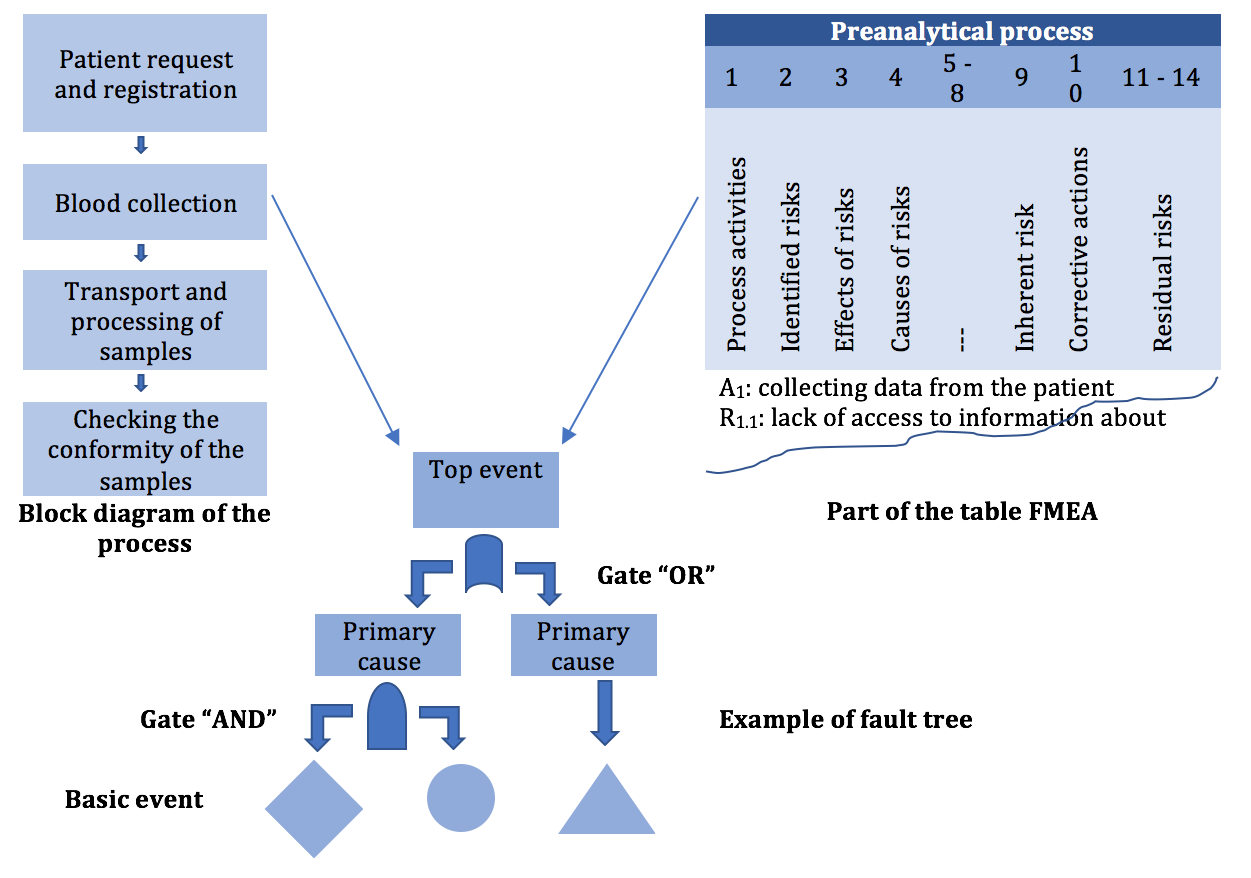
For the potential nonconforming events from the Risk Matrix and Pareto diagram (Figure 5 & Figure 6), with a high impact over achieving the objectives, the measures that will be implemented follow risk reduction to an acceptable level [6]. After possible nonconforming events (risks) list establishment and their prioritization based on NPR (Risk Priority Number), next is improvement opportunities identification phase. Choosing and implementing the right measures, to reduce the probability/ frequency of appearance or nonconforming events impact, depends on identification and understanding the main causes using “Five Whys” and/or “Fault Tree Analysis” instruments (Figure 7 & Figure 8). The details about the techniques and instruments mentioned can be found described below in the manuscript [3,11].
Techniques and instruments of risk management [6,11]
a. Allows the identification of the basic elements or variables
of a process.
b. Provides an overview of the process and, thus allows
understanding its influence on other processes.
c. Establishes from the beginning the context of conducting
the process: existing procedures, general methodologies,
definitions, legal regulations, constraints (legislative, financial,
personnel or time), decision criteria.
Strengths: Attendance of all stakeholders
Weaknesses: Some stakeholders may not have enough time to
participate to the discussions.
To remember: By the time the SIPOC diagram is completed
we know “who”, “with what”, “how”, and “for whom” carries out an
activity in the process.
a. It is a graphical representation that describes the
sequence of activities that take place over time.
b. It is a working document to identify much more easily
nonconformities, incidents, delays in decision-making, loss of
time, personnel or financial resources; all this can generate
errors in the process.
Strengths: Provides an overview of the main activities of the
process.
Weaknesses: It is not recommended that the process map
be drawn up by a single person or by people unfamiliar with the
process, who have their own opinions on what is “best”.
To remember: The process map is the essential step for
identifying and analyzing risks, “root cause” analysis and improving
quality.
a. It is a technique that encourages free discussion between
team members and involves the systematic gathering of
opinions from all members.
b. Emphasizes imagination, being useful in identifying
potential nonconforming events and replacing a list with as
many events as possible, which will be analyzed later.
Strengths: It is easy to implement and involves stakeholders.
Weaknesses: Some team members may dominate the
discussions while other members, although they have valuable
opinions, are not “allowed” to present them.
To remember: It is an unstructured technique, and the lack of
skills and knowledge of some of the participants does not ensure
the identification of all risks.
a. It is a technique used to identify activities and processes
that can vary, and thus could prevent the achievement of
objectives.
b. Key steps in preparing the FMEA table:
i. for each activity included in the map of the process we
identified the possible nonconforming events associated with
them;
ii. identifying the consequences (impact) that occur when
possible events materialize (severity assessment scale);
iii. identification of causes (mechanisms of occurrence)
(probability assessment scale);
iv. determining the effectiveness of existing control
measures to detect the causes or potential nonconforming
events (detectability assessment scale).
Strengths: Identifies possible undesirable events, their
causes and effects on the process and presents them in an easy-tounderstand
form.
Weaknesses: a. It is difficult for personnel who does not have
sufficient knowledge and experience to use the FMEA technique.
b. It is time consuming.
To remember: The FMEA is a table in which for each possible
nonconforming event only the cause and effect are presented.
In practice, the connection between cause and effect is not
limited only to the sequence of the three connected elements:
“cause-possible nonconforming event-effect”.
a. Risk matrix is a matrix consisting of the combination
between the scale of the probability of occurrence of the causes
leading to the nonconforming event and the scale of severity of
effects (risk exposure assessment scale).
b. The risk exposure assessment scale is no longer
unidirectional, as in the case of probability or severity, but a
two-dimensional (matrix type).
c. Matrix lines describe the variation of probability, and
columns the variation of impact; risk exposure occurs at the
intersection of rows with columns.
d. It can be represented both in ordinal form and in cardinal
form:
1. low risk exposure values are colored green;
2. moderate risk exposure values are yellow;
3. high risk exposure values are colored red.
Strengths: The elaboration of the “risk profile” provides an
overview of the organization from the perspective of risks.
Weaknesses: It is popular among managers because it provides
a simple display of data, but does not allow the differentiation of
common causes from specific ones that lead to the occurrence of
critical and low risks.
To remember!: Risk tolerance is the “amount” of risk that the
laboratory is willing to expose to at any given time.
Risk exposure is significant only as compared to risk tolerance.
If the inherent risk exposure is lower than the risk tolerance, no
control measures are required.
If the risk exposure is higher than the risk tolerance, risk control
measures are required so that the residual risk is accepted.
Who establishes the risk tolerance limit?
The management of the laboratory, being an act of managerial
responsibility;
The decision is passed down to the lower hierarchical levels.
How is the tolerance limit established?
It is a serious problem because it involves striking a balance
between the “cost” of control measures and the “cost” of exposure
if the risk materializes. Risk profile is a grouping of identified,
assessed and ranked risks in relation to the magnitude of the
deviation of the risk exposure from risk tolerance.
a. It is also known as the “80/20 rule”, considering that 20%
of the existing causes generate 80% of the effects.
b. It is a graphical representation that highlights the most
frequently encountered nonconforming events in descending
order, from the highest frequency to the lowest frequency.
c. Allows the laboratory to focus on those errors,
nonconformities or complaints that have the greatest impact on
the achievement of objectives, and provides support in decision
making.
d. The comparison of Pareto diagrams made before and
after taking corrective actions allows the evaluation of the
effectiveness of measures to reduce the frequency and / or
impact of the nonconforming event.
Strengths:
a. prioritization of nonconforming events
b. streamlining the use of limited resources
Weaknesses: access to information
To remember: It is not correct for a nonconforming event with
a high severity and low frequency to be classified in the same way
as an event with a low severity and high frequency.
One solution is to use “Nested Pareto chart”, where the events
with the highest severity are classified according to the decreasing
frequency, followed by the events with medium severity classified
descending, etc.
a. This technique reminds us of childhood, when there is a
continuous bombardment of questions that begin with “Why?”.
b. It is a technique most commonly used in medical systems
to analyze the root cause.
c. After compiling the exhaustive list of potential
nonconforming events (FMEA) and the Pareto chart, the next
step was to determine the root cause by asking the question
“Why?” the occurrence of the nonconforming event was not
prevented, going further “Why?” the nonconforming event
was not detected and then we asked ourselves “Why?” existing
control measures could not prevent harm to the patient.
d. Problem 1: 5 times “Why?”
Minoura, one of the specialists at Toyota Motors, considers
that when the “Why” number is higher, difficulties may arise
in prioritizing the identified causes, influenced by previous
personal experience.
e. Problem 2: the name “root cause analysis”:
Suggests the existence of a single cause that determined the
peak event.
We must not limit ourselves to the arbitrary number in the title
of the technique (more or less than 5 questions “Why?” may be
needed.
In laboratory medicine, a complex specialty, the occurrence of
a nonconforming event is rarely the result of a single root cause.
Strengths: It is complementary to other quality improvement
techniques, such as the fault tree analysis.
Weaknesses:
a. The technique is not simple, but simplified.
b. The efficiency of the technique has been proven in a
completely different context than the medical field.
c. Lack of minimum training in engineering, human factors or
ergonomics
To remember: “Any answer refers to a question, to a question
aroused in the answer.” Nicolae Iorga
a. It is a technique for identifying and analyzing the causes
that can contribute to the occurrence of a nonconforming event
(SR EN 31010: 2010).
b. It is a graphical representation in the form of a tree, which
illustrates the causes leading to the peak event and their logical
relationship with the peak event.
c. In practice, the connection between cause and effect is
not limited only to the sequence of the 3 connected events:
“cause-nonconforming event-effect”, the cause of a possible
nonconforming event may become a possible nonconforming
event at another stage of the evaluated process.
d. A possible nonconforming event can cause a chain of
effects.
e. FTA is recommended as an addition to the FMEA.
Strengths: It identifies simple failure modes, but also specific
combinations of events in complex processes.
Weaknesses: Analysis of the root cause in health systems can
be influenced by interpersonal relationships between different
hierarchical levels, so the final reports do not always reflect the
discussions taking place during the investigations.
To remember: The lack of personalization of the root cause
analysis for the medical field means that the possibility to learn
from the occurrence of a nonconforming event is not conducted, so
its purpose to prevent a similar event is not achieved and becomes
only a procedural requirement.
Conclusion
This paper shows how linkages between the techniques and instruments of risk management can reveal information, that otherwise remains obscured, about the process of interest and offers the possibility to improve its quality.
Conflict of Interest
The authors have no conflicts of interest to declare.
References
- IOS (2012) ISO 15189:2012: Medical laboratories – requirements for quality and competence. International Organization for Standardization, Geneva, Switzerland.
- Vermeersch P, Frans G, Von Meyer A, Costelloe S, Lippi G (2021) How to meet ISO15189:2012 pre-analytical requirements in clinical laboratories? A consensus document by the EFLM WG-PRE. Clin Chem 59(6): 1047-1061.
- IOS (2020) ISO 22367:2020: Medical laboratories – Application of risk management to medical laboratories. International Organization for Standardization, Geneva, Switzerland.
- Romanian Standards Association (2015) ASRO document SR EN ISO 9001:2015: Quality management systems. Requirements. This standard is identical with the International Standard EN ISO 9001:2015. International Organization for Standardization, Geneva, Switzerland.
- Romanian Standards Association (2018) ASRO document SR ISO 31000:2018. Risk management - Guidelines. This standard is identical with the International Standard ISO 31000:2018. International Organization for Standardization, Geneva, Switzerland.
- Romanian Standards Association (2020) ASRO document SR EN IEC 31010:2020. Risk management - Risk assessment techniques. This standard is identical with the International Standard EN 31010:2019. International Organization for Standardization EN, Geneva, Switzerland.
- Romanian Standards Association (2010) ASRO document SR Guide ISO 73:2010: Risk management – Vocabulary. This standard is identical with the International Guide ISO GUIDE 73:2009. International Organization for Standardization, Geneva, Switzerland.
- International Organization for Standardization (2014) ISO/IEC Guide 51:2014: Safety aspects – Guidelines for their inclusion in standards. International Organization for Standardization, Geneva, Switzerland.
- Clinical and Laboratory Standards Institute (2009) CLSI document EP18-A2: Risk Management Techniques to Identify and Control Laboratory Error Sources; Approved Guideline, 2nd Clinical and Laboratory Standards Institute, Wayne, PA, USA.
- Clinical and Laboratory Standards Institute (2011) CLSI document EP23-ATM: Laboratory Quality Control Based on Risk Management; Approved Guideline. Clinical and Laboratory Standards Institute, Wayne, PA, USA.
- Joint Commission International. Tool and Techniques (2015) Tools and Techniques. In: Parker J (Ed.), Root Cause Analysis in Health Care. Illinois, USA, pp. 133-174.
- Romanian Standards Association (2018) ASRO document IEC 60812:2019: Failure modes and effects analysis (FMEA and FMECA). This standard is identical with the International Standard IEC 60812:2018. International Organization for Standardization, Geneva, Switzerland.
- Joint Commission International (2010) Failure Mode and Effects Analysis in Health Care: Proactive Risk Reduction. In: Parker J & Chapman I (Eds.), Failure Mode and Effects Analysis in Health Care: Proactive Risk Reduction, 3rd Illinois, USA.




 We use cookies to ensure you get the best experience on our website.