Research Article 
 Creative Commons, CC-BY
Micronutrient Deficiencies and Nutritional Pattens as Possible Risk Factors in the Onset of Retinopathy in Type 2 Diabetic Patients
*Corresponding author: Enzo Spisni, Department of Biological, Geological and Environmental Sciences, University of Bologna, Via Selmi 3, 40126 Bologna, Italy.
Received: August 30, 2021; Published: September 16, 2021
DOI: 10.34297/AJBSR.2021.14.001967
Abstract
Diabetic retinopathy (DR) is a common complication in diabetes. Many studies have demonstrated a strong correlation between diet and the onset and progression of diabetes, but only few focused on possible link between nutritional patterns, micronutrient deficiency and DR. In this observational study, by using 10-day food diary recordings, we analyzed the eating habits of 34 patients affected by DR, 35 controls with a long history of type 2 diabetes mellitus (T2DM) but no retinopathy and 35 matched healthy subjects. Macro- and micronutrient intakes were calculated based on the Italian food composition database of the Center of Research for Food and Nutrition (CREA) by using a validated nutritional software. Moreover, the adherence to the Mediterranean diet (MD) was evaluated by using a widely adopted questionnaire. Respect to the type 2 diabetic group the average daily intake of vitamin A (total retinol activity equivalents) was strongly reduced in DR group (524 vs 1072 mg/d, P<0.01); those of vitamin C was also reduced in DR group (48.0 vs 85.2 mg/d, P<0.01) as well as vitamin D (3.73 vs 5.40 mg/d, P<0.01). Copper average daily intake was lower in DR group (0,50 vs 0,82 mg/d, P<0.01) and similarly potassium intake was lower in this group respect to the type 2 non retinopathic diabetic one (1271 vs 2180 mg/d, P<0.01). DR patients also showed a significatively lower adherence to the MD respect to the T2DM patients and to the healthy subjects. This study confirmed a possible role of unhealthy nutritional patterns and micronutrient deficiency in the development and progression of the diabetic retinopathy.
Keywords: Diabetic Retinopathy; Vitamins; Minerals; Antioxidants; Mediterranean Diet
Abbreviations: T2DM: Type 2 Diabetes Mellitus; DR: Diabetic Retinopathy; CREA: Center of Research for Food and Nutrition; MD: Mediterranean Diet; PRAL: Potential Renal Acid Load
Introduction
Type 2 diabetes mellitus (T2DM) is a common chronic condition affecting an increasing number of people during the middle or late adulthood [1]. This metabolic disorder is characterized by hyperglycemia caused by a deficiency in insulin secretion or action, and it has been linked to other metabolic disorders such as metabolic syndrome [1]. Persistent high glucose levels in blood may lead to neurovascular damages and to diabetic retinopathy (DR), a common complication in T2DM [2]. Clinically, DR is defined as the presence of retinal microvascular damages in an individual with T2DM [2]. Vision loss develops as sequalae of maculopathy (macular edema and ischemia) and neovascularization of the retina (vitreous hemorrhage and retinal detachment) and iris (neovascular glaucoma) [2]. Clinical evaluation should therefore aim to detect these severe ocular manifestations and, in their absence, assess the risk of progression to this disease. Current guidelines for optimal eye care of T2DM patients comprise a strict glycemic and blood pressure control in combination with laser therapy when needed [3]. It has been estimated that diabetic patients have a 25-fold increased risk of losing sight respect to healthy population: in fact, T2DM is the most common cause of blindness in adulthood [3,4]. Chronic hyperglycemia has a pivotal role in DR pathogenesis, but other causal factors are believed to trigger a cascade of biochemical and physiological changes that ultimately contributes to microvascular damages and retinal dysfunction [2]. Chronic hyperglycemia is associated to proteins glycosylation with a consequent alteration of their functions that finally led to retinal endothelium disruption. The endothelial damages result in retinal ischemia and increase vascular permeability, that is worsened by hypertension [5]. Despite it has been demonstrated that chronic hyperglycemia has a pivotal role, in DR, neuro-retinal damages may also develop early during DR, even before the microvascular changes begin [6]. These events have been only partially explained with the hypothesis that T2DM could reduce insulin receptor signaling in the neural retina [5], but other biochemical pathways may contribute to DR pathogenesis, for example by increasing neuro retinal oxidative damages [7,8].
Nutrition seems to be a crucial field of intervention in T2DM management [9-13] and comprehensive dietary guidelines have been developed, mainly aimed to improve the glycemic control. Nevertheless, to date, there is no scientific evidence that the mere control of glycemic levels may be successful in DR prevention, and no specific dietary recommendations are available for contrasting the development of this disease, which is a complication present in approximately 30% of diabetic patients [13]. A limited number of epidemiological studies have explored the association between single dietary components intake and DR [14-16], and very few focused on vitamins and minerals. For this reason, we designed an observational study aimed to highlight possible errors in eating behavior that may be linked to the development of DR.
Materials and Methods
Patient Enrollment
Inclusion criteria were: 1) written informed consent; 2) age between 40 and 90 years; 3) No current or past strict nutritional intervention (calorie-controlled eating plan) in the last 3 years.
4a) For the diabetic retinopathic (DR) group a diagnosis of
DR confirmed by clinical evaluations (fundus examination,
visual acuity test, slit lamp examination, tonometry and
fluoroangiography) and combination therapy with metformin
and insulin.
4b) For the T2DM controls group (D2) a diagnosis established
for over 10 years, with no signs of DR as confirmed by clinical
evaluation and combination therapy with metformin and
insulin.
4c) For healthy subjects (HC group) a fasting blood glucose
lower than 100mg/dl, confirmed by hematological examination
carried out by a certified diagnostic center within 6 months
to the date of enrollment, and absence of hypoglycemic drug
therapies.
All patients enrolled were Caucasian coming from the same geographical Italian region (Emilia Romagna). Metformin and Insulin therapies were similar in DR and D2 groups.
Exclusion criteria for all the participants were the use of experimental drugs in the last 5 years, pregnancy or breastfeeding, regular use of vitamins, minerals or ω-3 food supplements and concomitant presence of other ocular pathologies or other comorbidities not related to T2DM which, at the investigator’s opinion, could influence the quality of collected data.
Written informed consent was obtained from each participant before the initial screening visit and before initiation of the study. Participants were informed of the full nature and purpose of this study prior to enrollment. This study was conducted in conformity with the principles of the Declaration of Helsinki. Enrollment and data collection took place at the Division of Endocrinology and Diabetes Prevention and Care and at Department of Ophthalmology and Department of Endocrinology at S. Orsola-Malpighi University Hospital, Bologna, Italy. The study was approved by the Bioethics Committees of the University of Bologna (Prot. N. 140485, of 9th October 2018).
Study Design
After enrollment, all participants were trained to report all the food daily eaten (list of foods and precise amounts) on a food diary, for 10 consecutive days. All the enrolled subjects were asked to maintain their normal diets during this study. Macro- and micronutrient contents were calculated based on the Italian food composition database described by Sette et al. [17] by using the MetaDieta software (Meteda s.r.l., Ascoli Piceno, Italy). This software has been already validated to calculate the daily macro- and micro-nutrients intake in diabetic patients [18]. MD adherence was evaluated by trained professional nutritionists analyzing the food diary and by using the questionnaires developed by Panagiotakos and collaborators [19]. This scoring systems range between 0 and 55 points. Zero points means minimum adherence, while 55 points represented the maximum possible adherence.
Statistical Analysis
Continuous variables are expressed as mean ± SD. Normality of distribution was verified with the D’Agostino-Pearson and Shapiro- Wilk tests and the homogeneity of variances (homoscedasticity) with the F-test. Statistical differences between groups were determined by one-way analysis of variance (ANOVA). Tukey’s method was applied as a post hoc test. GraphPad Prism 6 (GraphPad Software Inc., San Diego, CA, USA) was used for all analyses. Differences were considered signi¬ficant at P < 0.05 and P<0.01.
Results and Discussion
Study Population
104 Caucasic subjects were enrolled in the study, 34 of these subjects in the diabetic retinopathy group, (RD group), 35 in the T2DM non-retinopathic group (D2 group) and 35 subjects in the healthy controls group (HC group).
The RD group was comprised by 19 man and 15 women. The mean age was 69.2 years (SD=11.6). and their average body mass index (BMI) was 27.7 Kg/m2 (SD= 3.51).
The D2 group was comprised by 17 man and 18 women. The mean age was 68.4 years (SD=9.0), and their average body mass index (BMI) was 26.0 Kg/m2 (SD= 3.34).
The HC group was comprised by 17 man and 18 women. The mean age was 66.3 years (SD=11.4), and their average body mass index (BMI) was 24.3 Kg/m2 (SD= 3.25).
Calories and Macronutrients Intake
The total daily caloric intake (measured in Kcal/d) showed no significant differences in the comparison among DR group (1709 ± 356 Kcal/d), D2 group (1538± 329 Kcal/d) or HC group (1575 ± 237 Kcal/d). Also, the distribution of macronutrients (Figure 1) did not show significantly differences between groups and fell within the reference ranges of macronutrient and energy intake suggested for the Italian population by the dietary reference values published by the European Food safety Authority (EFSA-DRVs). Overall, only a slightly higher caloric intake was observed in the DR group, although not significant, associated with a lower intake of carbohydrates (41.7% of the total caloric intake) and a higher intake of lipids (42.3% of the total caloric intake). The amounts of proteins assumed with the diet was very similar in all the three groups.
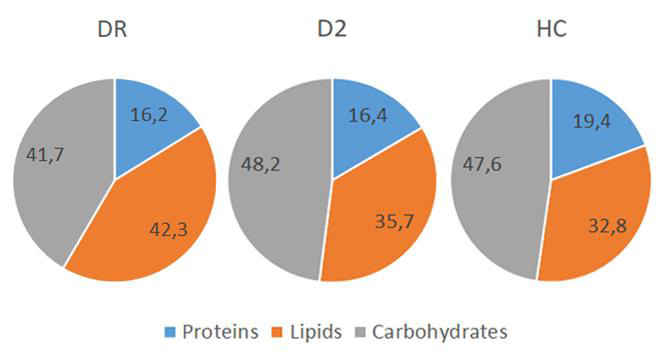
Figure 1: Macronutrient’s assumption indicated as percentage of the total caloric intake in diabetic retinopathic (DR) diabetic (D2) or healthy control (HC) groups. All the differences were not statistically significant, including the average daily caloric intake.
No differences were observed between groups in simple sugars intake (data not shown), while the daily ingestion of total fibers was significantly different among groups (Figure 2A). In DR group daily fibers intake was lower with an average of 12.36 ± 5.17 g/d compared to 19.98 ± 7.37 g/d in the D2 group (p<0.01) and 29.48 ± 5.30 g/d in the HC group (p<0.01). Although the overall lipid intake did not show significant changes, the polyunsaturated fatty acids (PUFAs) component showed significant differences between groups (Figure 2B). The total amount of PUFAs in the diet was very similar in the two diabetic groups, with a minimum daily value for the D2 group (6.75± 1.33 g/d) but it was significantly higher in the HC group (11.28 ± 2,82 g/d; p<0.01). Instead, as shown in Figure 2B, the w -3 PUFAs intake showed a minimum of (0.86 ± 0.45 g/d) in the DR group and was significantly higher both in D2 (1.11± 0.39 g/d; p<0.05) and in HC (1.81 ± 0.55 g/d; p<0.01) groups. On the contrary, the daily cholesterol intake (Figure 2C) was significantly higher in DR group (215.0±59.6 mg/d) respect to the D2 group (151.3±41.2 mg/d; p<0.01) and the HC group (154.7 ± 37.7 mg/d; p<0.01).
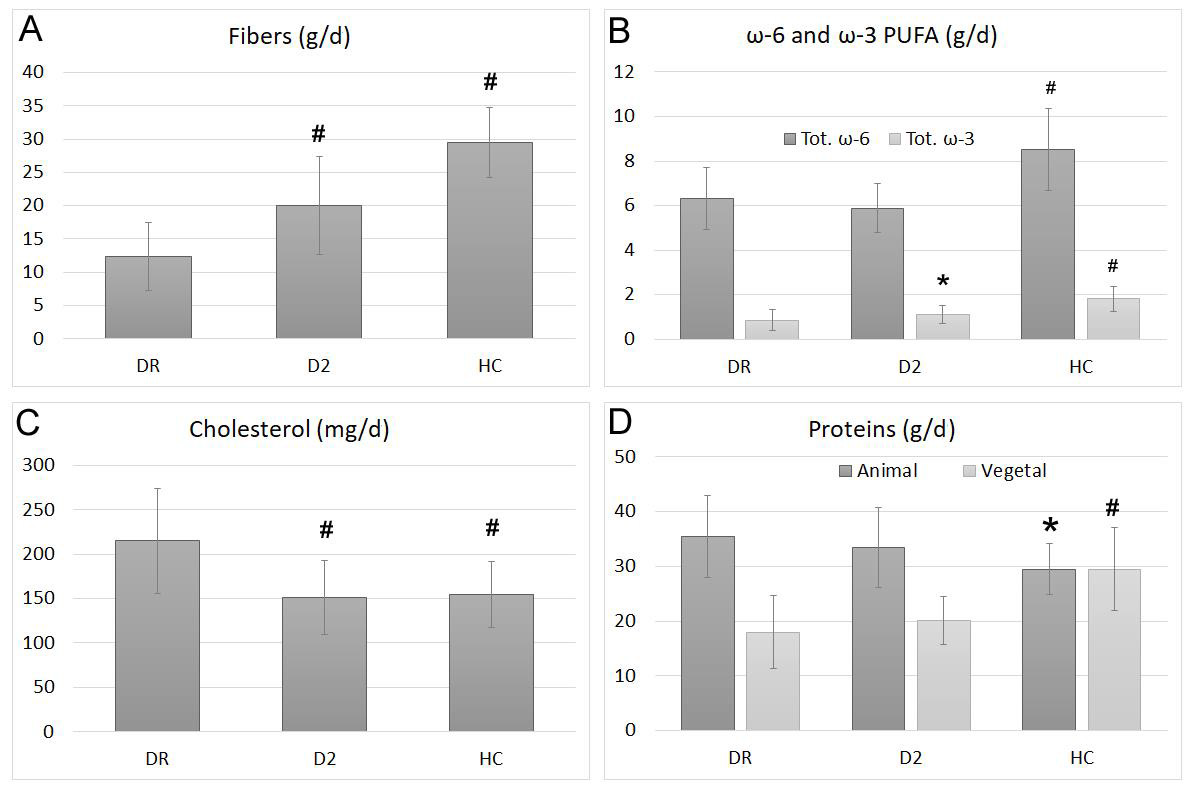
Figure 2: Average intake of total fibers (A), w-3 and w-6 PUFAs (B), cholesterol (C) and proteins, divided in animal or vegetable origins (D) in diabetic retinopathic (DR) diabetic (D2) or healthy control (HC) groups. Bars represent mean ± SD.* indicates statistically significant differences with p<0.05 respect to the DR group, while # indicates statistically significant differences with p<0.01 respect to the DR group.
Even if total protein intake did not significantly change among groups, analyzing separately those of animal or plant origin (Figure 2D), we found significant differences. While in the HC group the ratio between animal and vegetable proteins was very close to 1, in the D2 group this ratio rises to 1.7 and reaches the value 2 in the DR group, which thus showed the maximum consumption of animal proteins and the minimum of vegetal ones.
Vitamins and Minerals Intake
Vitamin A intake was evaluated by software as total retinol activity equivalents (RAEs), that include animal (retinoids) and vegetal (carotenoids) sources. The average intake of this vitamin (Figure 3 A) was significantly higher in D2 and HC groups (respectively 1072 ± 371 and 1014 ± 299 mg/d, p<0.01) respect to DR group (524 ± 308 mg/d), who showed values significantly lower but still above the recommended intake for the European population (EFSA-PRI), considered to be 500 mg/d for adult men and 400 mg/d for adult women.
Vitamin C intake (Figure 3 B) showed a similar trend, with lover values in the DR group (48.0 ± 4.0 mg/d), and a significantly higher intake both in the D2 group (85.2 ± 36.2 mg/d; p<0.01) and in the HC group (187.7 ± 34.7 mg/d; p<0.01). However, the Vit. C intake in the DR group was lower than the recommended EFSA-PRI value, considered to be 75 mg/d for adult men and 60 mg/d for adult women.
Vitamin E intake (Figure 3 C) was lower than its recommended EFSA-PRI value (13 mg/d for adult men and 12 mg/d for adult women) for both DR and D2 groups. Values in DR (8.60 ± 2.93 mg/d) and D2 (8.64 ± 2.04 mg/d) were significantly lower than those recorded in HC group (13.02 ± 1.83 mg/d; p<0.01).
Vitamin D intake (Figure 3D) was calculated as a sum of Vit. D2 (ergocalciferol) and vitamin D3 (cholecalciferol). The analysis showed average intakes below the EFSA-PRI level (10 mg/d) for all the three groups, but the lowest intake was recorded again in the DR group (3.73 ± 2.09 mg/d). Significantly higher values were obtained both in D2 (5.40 ± 1.57 mg/d; p<0.01) and in HC (8.39± 1.43 mg/d; p<0.01) groups.
The B vitamins we considered (B1, B3, B6, Folate and B12), showed average intakes very similar among all groups and always above the EFSA-PRI levels.
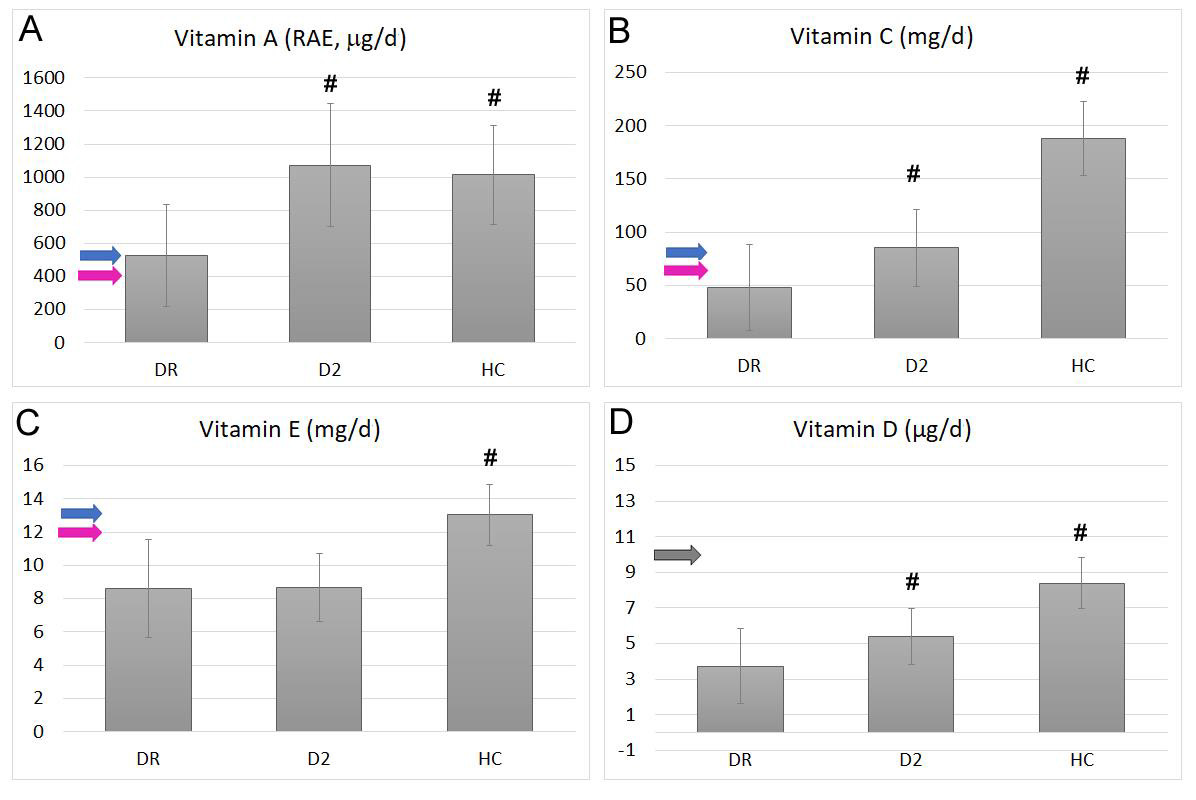
Figure 3: Average intake of total Vit. A (RAEs, panel A), Vit. C (B), Vit. E (C) and total Vit. D (Panel D) in diabetic retinopathic (DR) diabetic (D2) or healthy control (HC) groups. Bars represent mean ± SD. Blu arrows indicate the EFSA-PRI value in adult males, pink arrows indicate the EFSA-PRI values for adult women and gray arrows indicate EFSA-PRI values for adult populations, when there are no different indications between genders. # Indicates statistically significant differences with p<0.01 respect to the DR group.
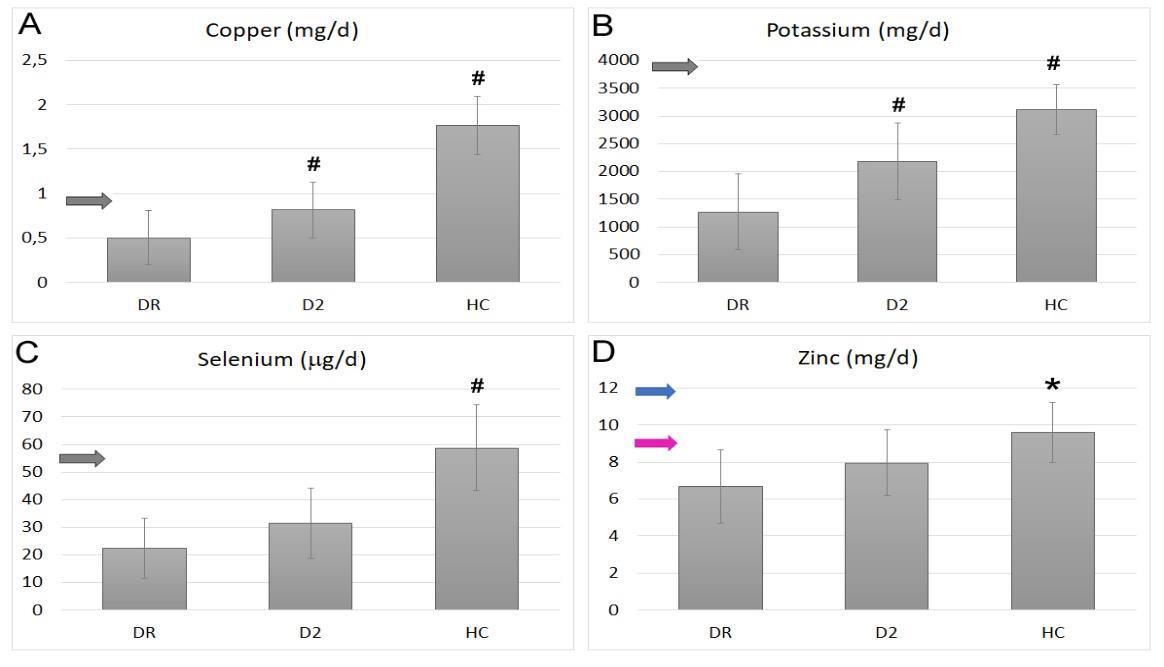
Figure 4: Average intake of copper (A), potassium (B), selenium (C) and zinc (D) in diabetic retinopathic (DR) diabetic (D2) or healthy control (HC) groups. Bars represent mean ± SD. Blu arrows indicate the EFSA-PRI value in adult males, pink arrows indicate the EFSA-PRI values for adult women and gray arrows indicate EFSA-PRI values for adult population when there are no different indications between genders. * Indicates statistically significant differences with p<0.05 respect to the DR group, while # indicates statistically significant differences with p<0.01 respect to the DR group.
For what mineral concerns, we observed significant differences among groups only for copper, potassium, selenium, and zinc (Figure 4). Copper intake (Figure 4 A) was very low and below the EFSA-PRI value (fixed in 0,9 mg/d) in DR group (0.50 ± 0.31 mg/d) but significantly higher both in D2 (0.82 ± 0.31 mg/d; p<0.01) and HC (1.77 ± 0.33 mg/d; p<0.01) ones. The same trend was observed for the potassium intake (Figure 4 B), with the lowest level recorded in DR group (1271 ± 689 mg/d), widely below the EFSA-PRI level, and significantly higher values obtained in D2 and HC ones (respectively 2180 ± 589; p<0.01 and 3112 ± 449 mg/d; p<0.01). Selenium intake (Figure 4C) showed similar values in DR and D2 groups (respectively 22.4 ± 11.0 and 31.5 ± 12.8 mg/d), both below the EFSA-PRI (55 mg/d), and a significantly higher intake in the HC group (58.8 ± 15.5mg/d; p<0.01). A similar trend resulted also for zinc (Figure 4 D), with lower intakes recorded for DR and D2 groups (respectively 6.68 ± 1.97 mg/d for DR and 7.96 ± 1.76 in D2) and a significantly higher value in the HC (9.61 ± 1.61 mg/d; p<0.05). Only the HC group showed zinc average intake above the lower EFSA-PRI value (for adult women).
Adherence to the Mediterranean Diet
Adherence to the MD, assessed by using the Panagiotakos’s validated questionnaire [19], was significantly different in the three groups studied (Figure 5). The lowest adherence was observed in the DR group, with an average score of 12.5 ±4.5. Significantly higher scores were obtained in the D2 (18.8±5.1; p <0.01), and in the HC (24.1±4.9) groups. The HC score was the highest, significantly higher respect both the DR (p<0.01) and the D2 (p<0.01) ones.
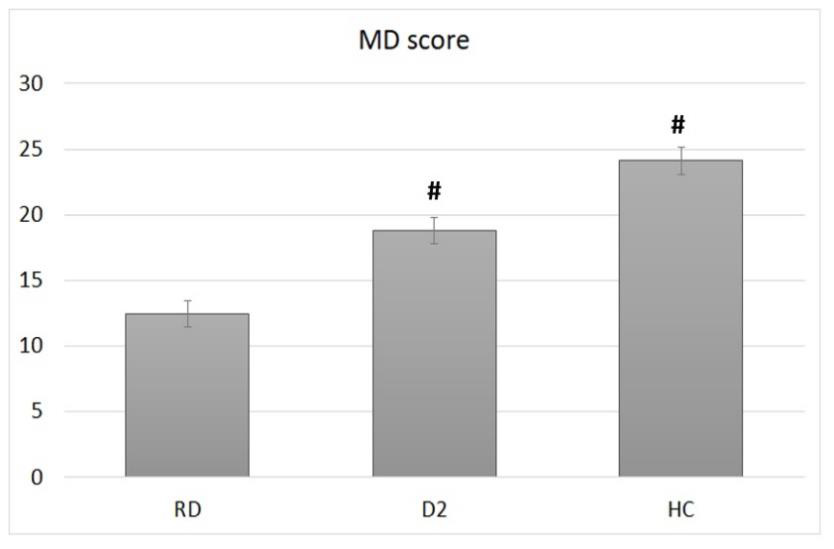
Figure 5: Adherence to the Mediterranean diet, calculated by using the Panagiotakos’s validated questionnaire, in diabetic retinopathic (DR) diabetic (D2) or healthy control (HC) groups. Bars represent mean ± SD. # indicates statistically significant differences with p<0.01 respect to the DR group.
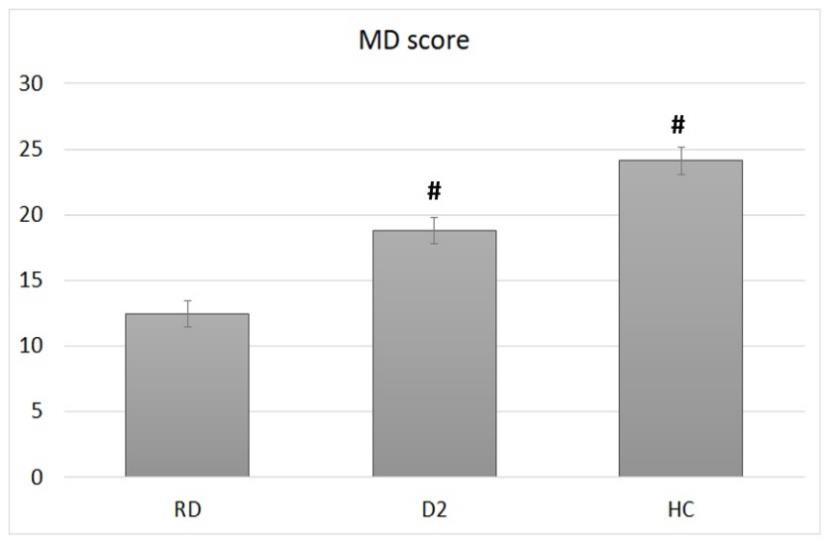
Figure 6: Average PRAL values of food diary records calculated by the nutritional software in diabetic retinopathic (DR) diabetic (D2) or healthy control (HC) groups. Bars represent mean ± SD. # indicates statistically significant differences with p<0.01 respect to the DR group.
The overall diversity of nutritional patterns adopted by these three groups resulted evident also by analyzing the average of the potential renal acid load (PRAL) of their food diary records (Figure 6). PRAL index predict the renal net acid excretion based on the intake of minerals (i.e., Na, Cl, P, SO4, K, Ca, Mg) and proteins [20]. Practically, PRAL values are negative for foods of vegetable origin (especially fruits and vegetables) and positive for animal foods. Consistent with what we observed for MD adherence, we found an average PRAL value of the entire food diary particularly higher in DR group (18.7 ± 5.0 mEq) while lower values were observed in D2 group (7.9 ± 3.1 mEq; p<0.01) and HC (-12.9 ± 4.9 mEq; p<0.01) groups.
Discussion
Many studies suggest that high fruits, vegetables, and fish intake as well as a good adherence to the MD may protect against the development of diabetic retinopathy, although the clinical evidence is limited [21]. This observational study aimed to analyze the quality of the diet that is adopted by three cohorts comparable in age, ethnicity, and nationality: one diagnosed with T2DM and DR complications, one with T2DM only (diagnosed for at least 10 years), and one of healthy elderly subjects. We carefully selected participants, considering the clinical onset of DR and enrolling only DR and T2DM patients using the same combination therapy (metformin plus insulin). The D2 group, with no clinical signs of DR is particularly interesting also for the long history of the disease in the absence of retinal complications which usually appear within 10 years after being diagnosed with T2DM [21]. Furthermore, all enrolled subjects did not have experienced calorie-controlled eating plans in the 3 years preceding this study.
The significant lower intake of vitamins A, C, D, copper, and potassium that we recorded in DR group, in some cases at lower levels than the suggested EFSA-PRI, does not necessarily imply that these subjects have an established biochemical deficiency, which can only be ascertained by blood sampling. Nevertheless, it is important to note that the optimal dosing of micronutrients has not been established for clinical practice either for human studies, and some groups, such as the diabetic subjects, may require higher intakes than the EFSA-PRI to meet their metabolic demands. Also, the significantly higher intake values recorded in the HC group, makes it reasonable to hypothesize the possibility that DR patients assumed less micronutrients than their real needs. These too low levels of assumption were also evident by analyzing their diet patterns, particularly lower in fibers, fruits and vegetables and augmented in animal proteins intake. Unsurprisingly, also potassium intake was lower in the DR group, since the main sources of this mineral are again fruits and vegetables. DR group showed dietary habits particularly distant from the Mediterranean diet pattern and more similar to the so-called Western diet, rich in food products of animal origin. Therefore, it is reasonable to assume that even the intake of other plant antioxidant metabolites, such as for example polyphenols, was lower in DR patients enrolled in our study respect to the other two groups that we examined.
What this study highlight is the need to improve the nutritional interventions on T2DM patients to avoid them an inadequate food pattern at risk of lower intake of vitamins, minerals, antioxidants, and fibers. Recommendations to T2DM patients to increase their raw vegetables intake must be added to those of increase their ω-3 PUFA intake suggested by the PREDIMED Trial [21]. Despite being known that a high ω-3 PUFAs intake has been associated with a reduced severity of DR [22] our DR group showed a ω-3PUFAs intake significantly lower than the healthy matched controls (HC), even in the presence of higher levels of animal proteins. This means an increased cheese and meat consumption in DR group, also confirmed by their higher cholesterol intake and higher PRAL values, respect to the other groups. We cannot exclude that this dietary choice comes from a self-made attempt to further reduce carbohydrates to improve the glycemic control after the DR diagnosis. This seem to be confirmed by the lower carbohydrates intake that we observed in DR group. Overall, our result indicates a reduced intake of vegetables and fibers in in DR group, which is negatively reflected in the lower intake of vitamins, such as carotenoids (provitamin A) and Vit. C. In both DR and D2 groups we observed a lower intake of Vit. E respect to the HC group. As far as Vit. D concerns, the major sources in the diet are fish and other foods that come from the marine food chain. It is therefore not surprising that the average assumption levels of this vitamin showed a similar trend of those observed for ω-3 PUFAs intake.
It is particularly interesting to observe that three fundamental micronutrients for the body’s antioxidant pool, such as copper, zinc and selenium showed intake levels in the DR group below the recommended values (EFSA-PRI). Since the deficiency of these micronutrients have been clearly involved in retinal degeneration [23-26], particular care should be taken to include rich foods in diets of DR subjects.
Another interesting result was the adherence to MD that decreased passing from the HC group to the D2 group and from the D2 to the DR one. It has been well established that the MD food pyramid is protective against the development of DR and other agerelated retinal diseases [27]. The lower MD score in the DR group was mainly linked to the lower frequency of fruits, vegetables, fish, and legumes consumption, and to the higher frequency observed for meat and processed meat. Another parameter that showed significant differences between DR and D2 groups was the average PRAL values of their meals to indicate a lack of food of plant origin [28]. We are aware of the major limitations of this study: is the small number of patients enrolled, the indirect evaluation of their food intake and the lack of a comparison of our findings with the blood concentrations of vitamins and minerals. However, its strength is to have compared cohorts of extremely homogeneous patients in terms of ethnicity, age and drug therapies used, highlighting how T2DM patients do not fully adopt correct nutritional patterns to prevent or delay the development of DR. Wrong nutritional patterns can negatively affect not only the blood level of micronutrients and antioxidants, but also the intestinal microbioma, whose role in the onset and progression of metabolic diseases, such as T2DM, has been clearly demonstrated [29].
Conclusion
T2DM patients tend not to follow balanced and healthy dietary plans. This behavior is particularly evident in T2DM patients with DR. This causes a lower intake of micronutrient and antioxidant and could decrease the protective role of the diet in the onset and progression of DR. For these reasons a specific nutritional education should be adopted for T2DM patients to avoid them from possible consequences of unbalanced diets with negative effects on their retina.
Acknowledgements
Author Contributions: Conceptualization, E.S., S.S. and S.Z.S.; methodology S.S., S.M. and R.S.; formal analysis, S.S, R.S., M.C.V. and E.S.; data collection, S.S. and S.Z.S.; original draft preparation, S.S., and S.Z.S.; writing—review and editing, S.S., M.C.V. and E.S.; supervision, S.Z.S.; project administration, S.S.; funding acquisition, E.S. and S.Z.S. All authors have read and agreed to the published version of the manuscript.
Funding: This research was funded by University of Bologna, RFO grant to ES and SZS.
Institutional Review Board Statement: This study was approved by the local Bioethics Commit-tees (Bioethics Committee of the University of Bologna), Prot. No. 140485 of October 9, 2018.
Informed Consent Statement: Informed consent was obtained from all subjects involved in the study. Written informed consent for publication was obtained from participating patients.
Conflict of interest
The authors declare that the research was conducted in the absence of any commercial or financial relationships that could be construed as a potential conflict of interest.
References
- Lopez Jm, Katic Bj, Fitz-Randolph M, Jackson Ra, Chow W, et al. (2016) Un-derstanding preferences for type 2 diabetes mellitus self-management support through a patient-centered approach: a 2-phase mixed-methods study. BMC Endocr Disorders 16: 41.
- Fong DS, Aiello LP, Ferris FL 3rd, Klein R (2004) Diabetic retinopathy. Diabetes Care. 2540-2553.
- Vujosevic S, Pucci P, Casciano M, Daniele A, Bini S, et al. (2017) A decade-long telemedicine screening program for diabetic retinopathy in the north-east of Italy. J Diabetes Complications. 31(8): 1348-1353.
- Congdon Ng, Friedman Ds, Lietman T (2003) Important causes of visual impairment in the world today. JAMA. 290(15): 2057-2060.
- Ciulla Ta, Amador Ag, Zinman B. (2003) Diabetic retinopathy and diabetic macular edema: pathophysiology, screening, and novel therapies. Diabetes Care 26: 2653-2664.
- Antonetti Da, Barber Aj, Bronson Sk, Freeman Wm, Gardner Tw, et al. (2006) Diabetic retinopathy: seeing beyond glu-cose-induced microvascular disease. Diabetes 55: 2401-2411.
- Jenkins Aj, Joglekar Mv, Hardikar Aa, Keech Ac, O'neal Dn, et al. (2015) Biomarkers in Diabetic Retinopathy. Rev Diabet Stud, 12: 159-195.
- Caldwell Rb, Bartoli M, Behzadian Ma, El-Remessy Ae, Al-Shabrawey M, et al. (2003) Vascular endothelial growth factor and diabetic retinopa-thy: pathophysiological mechanisms and treatment perspectives. DiabetesMetab Res Rev 19: 442-455.
- Mohamed Q, Gillies Mc, Wong Ty (2007) Management of diabetic retinopathy: a sys-tematic review. JAMA 298: 902-916.
- Ajala O, English P, Pinkney J (2013) Systematic review and meta-analysis of different di-etary approaches to the management of type 2 diabetes. Am J Clin Nutr 97: 505-516.
- Franz Mj, Wylie-Rosett J (2007) The 2006 American Diabetes Association Nutrition Rec-ommendations and Interventions for the Prevention and Treatment of Diabetes. Diabetes Spectrum 20: 49-52.
- Lin S, Ramulu P, Lamoureux El, Sabanayagam C (2016) Addressing risk factors, screening, and preventative treatment for diabetic retinopathy in developing coun-tries: a review. ClinExp Ophthalmol 44: 300-320.
- Wong Ty, Sabanayagam C (2020) Strategies to Tackle the Global Burden of Diabetic Retinopathy: From Epidemiology to Artificial Intelligence. Ophthalmologica 243: 9-20.
- Wong Myz, Man Rek, Fenwick Ek, Gupta P, Li Lj, et al. (2018) Dietary intake and diabetic retinopathy: A systematic review. PLoS One 13: e0186582.
- Eynard Ar, Repossi G (2019) Role of ω3 polyunsaturated fatty acids in diabetic retinopathy: a morphological and metabolically cross talk among blood retina barriers damage, autoimmunity and chronic inflammation. Lipids Health Dis 18: 114.
- Singh S, Kushwaha P, Gupta Sk (2020) Exploring the Potential of Traditional Herbs in the Management of Diabetic Retinopathy: An Overview. Drug Res (Stuttg) 70: 298-309.
- Sette S, Le Donne C, Piccinelli R, Arcella D, Turrini A, et al. (2011) The third Italian national food consumption survey, INRAN-SCAI 2005–06 – Part 1: nutrient intakes in Italy. Nutr Metab Cardiovasc Dis 21: 922-932.
- Giorgini M, Vitale M, Bozzetto L, Ciano O, Giacco A, et al. (2017) Micronutrient Intake in a Cohort of Italian Adults with Type 1 Diabetes: Adherence to Dietary Recommendations. J Diabetes Res, 2017:2682319
- Panagiotakos Db, Pitsavos C, Stefanadis C (2006) Dietary patterns: a Mediterranean diet score and its relation to clinical and biological markers of cardiovascular disease risk. NutrMetabCardiovasc Dis 16: 559-568.
- Remer T, Manz F (1995) Potential renal acid load of foods and its influence on urine pH. J Am Diet Assoc 95: 791-797.
- Sala-Vila A, Díaz-López A, Valls-Pedret C, Cofán M, García-Layana A, et al. (2016) Prevención con Dieta Mediterránea (PREDIMED) Investigators. Dietary Marine ω-3 Fatty Acids and Incident Sight-Threatening Retinopathy in Middle-Aged and Older Individuals With Type 2 Diabetes: Prospective Investigation From the PREDIMED Trial. JAMA Ophthalmol, 134: 1142-1149.
- Sasaki M, Kawasaki R, Rogers S, Man Re, Itakura K, et al. (2015) The Associations of Dietary Intake of Polyunsaturated Fatty Acids With Diabetic Retinopathy in Well-Controlled Diabetes. Invest Ophthalmol Vis Sci 56: 7473-7479.
- Ugarte M, Osborne Nn, Brown La, Bishop Pn (2013) Iron, zinc, and copper in retinal physiology and disease. Surv Ophthalmol 58: 585-609.
- Gilbert R, Peto T, Lengyel I, Emri E (2019) Zinc Nutrition and Inflammation in the Aging Retina. MolNutr Food Res 63: e1801049.
- González de Vega R, García M, Fernández-Sánchez ML, González-Iglesias H, Sanz-Medel A (2018) Protective effect of selenium supplementation following oxidative stress mediated by glucose on retinal pigment epithelium. Metallomics 10: 83-92.
- Faure P (2003) Protective effects of antioxidant micronutrients (vitamin E, zinc and sele-nium) in type 2 diabetes mellitus. ClinChem Lab Med 41: 995-998.
- Francisco Sg, Smith Km, Aragonès G, Whitcomb Ea, Weinberg J, et al. (2020) Dietary Patterns, Carbohydrates, and Age-Related Eye Diseases. Nutrients 12: 2862.
- Parmenter Bh, Dymock M, Banerjee T, Sebastian A, Slater Gj, et al. (2020) Performance of Predictive Equations and Biochemical Measures Quantifying Net Endogenous Acid Production and the Potential Renal Acid Load. Kidney Int Rep 5(10): 1738-1745.
- Muñoz-Garach A, Diaz-Perdigones C, Tinahones Fj (2016) Gut microbiota and type 2 diabetes mellitus. Endocrinol Nutr 63(10): 560-568.


 We use cookies to ensure you get the best experience on our website.