Research Article 
 Creative Commons, CC-BY
Alcohol and Advanced Glycation End Product Synergistically Stimulate TNF-ɑ and TGF-β1 Production by Cytochrome P450 2E1 Expressing Macrophages
*Corresponding author: Qi Cao, Department of Diagnostic Radiology and Nuclear Medicine, University of Maryland School of Medicine, 655 W. Baltimore St. Baltimore, Maryland 20201, United States of America.
Received: December 02, 2021; Published: December 10, 2021
DOI: 10.34297/AJBSR.2021.15.002070
Abstract
Introduction: To study whether overexpression of CYP2E1 within macrophages is more sensitive to stimulators alcohol and AGEs by evaluation of TNF-ɑ and TGF-β1 generation.
Methods: Transfected CYP2E1 cDNA (E2) and WT (M1) macrophages were cultured with alcohol and AGE. TNF-ɑ and TGF-β in culture medium was quantified using ELISA. Expressions of CD14, TLR2, TLR4, TLR9, and RAGE, and HO-1level were analyzed by Western blot. Cells were treated for 0-24 h for H2O2 and HO-1 analysis. siRNAs CD14, TLR4 and TLR9, and scrambled oligonucleotides were used to investigate role of different receptor-mediated oxidative stress in TNF-ɑ and TGF-β generation in E2 and M1 cells.
Results: TNF-ɑ and TGF-β protein in E2 was significantly induced in cultures treated with alcohol or/and AGE compared to M1 or control cultures. Increased expression of CD14, TLR4, TLR9 and RAGE, and increased formation of H2O2 but decreased HO-1 level in CYP2E1-expressing macrophages were found when the cells were treated with alcohol and AGE. TNF-ɑ and TGF-β protein in E2 cells treated with siRNAs of RAGE, CD14, TLR4 and TLR9 were downregulated in the E2 and M1 cells.
Conclusion: Higher generation of TNF-ɑ and TGF-β by CYP2E1-expressing macrophages stimulated by alcohol and AGE via multiple cellular receptors-mediated intra cellular oxidative stress pathway indicating an important role of AGE in pathogenesis of ALD.
Keywords: Advanced glycation end products, CYP4502E1, Alcoholic liver disease, Receptor of advanced glycation end products, Kupffer cells, CD14, TLR, HO-1, H2O2
Abbreviations: ALD: Alcoholic liver disease, TNF-α: Tumor Necrosis Factor-Alpha, TGF-β1: Transforming Growth Factor-Beta1, CYP2E1: Cytochrome P450 2E1 Enzyme, LPS: Lipopolysaccharides, TLRs: Toll Like Receptors, CD14: Cluster of Differentiation 14, AGE: Advanced glycation end products, RAGE: Receptors of advanced glycation end products, ROS: Reactive Oxygen Species, H2O2: Hydrogen Peroxide, HO-1: Heme Oxygenase-1, GAPDH: Glyceraldehyde 3-Phosphate Dehydrogenase, DCF: Dichlorofluorescein, 3-DG: 3-Deoxyglucosone.
Advances in Knowledge
a. Rapid degradation of CYP2E1expression in in vitro Kupffer cells limits further study of alcohol-induced CYP2E1 expression in formation of
inflammatory and fibro genic mediators TNF-α and TGF-β1.
b. AGE and alcohol synergistically stimulate macrophages with stable expression of CYP2E1 to produce greater TNF-α and TGF-β1 via various
cellular receptors (CD14, TLRs and RAGE)-mediated oxidative stress pathway.
c. Chronic alcohol consumption causes formation of AGEs by the metabolic products of ethanol, acetaldehyde, and increased hepatic AGEs
increase production of ROS and synthesis of TNF-α and TGF-β1 by alcohol-primed Kupffer cells which involve pathogenesis of ALD.
Implications for Patient Care
Understanding that accumulation of alcohol glycation product in the liver is strongly associated with pathogenesis of alcoholic liver disease may provide patient management of alcoholic liver disease.
Introduction
Alcoholic liver disease (ALD) is one of the leading causes of death in the United States [1], but the actual mechanisms of ALD remain unclear. Kupffer cells (KP), the liver residential macrophages play an important role in the pathogenesis of ALD by producing a great amount of inflammatory and fibro genic mediators such as tumor necrosis factor-alpha (TNF-α) [2] and transforming growth factorbeta1 (TGF-β1) [3]. Among them, TNF-α has been found to involve the stimulation of the production of other cytokines or growth factors, the formation of oxidative stress, hepatocyte apoptosis and liver fibrosis. KP are an important cellular source of TGF-β1 in ALD. In ALD TGF-β1 has been clearly identified to involve alcoholic fibrosis or cirrhosis formation in clinical and experimental studies [3,4]. Our and other studies have found that alcohol feeding induces increased expression of cytochrome P450 2E1 enzyme (CYP2E1) in KP [2,5], a key enzyme of alcohol metabolism and reactive oxygen species formation in ALD. Alcohol-induced expression of CYP2E1 sensitizes KP to pathogenic stimulators endotoxin and regulates activation of cellular receptors of Cluster of differentiation14(CD14) and cellular signal pathways of Toll Like Receptor 2(TLR-2), TLR-4, and TLR-9-oxidative stress, leading to overproduction of TNF-α and TGF-β1[2,3,6&7].
Advanced glycation end products (AGE) are the products of nonenzymatic glycation and oxidation of proteins [8]. Accumulation of AGEs has been implicated in the development of tissue inflammatory and fibrotic damage in various disorders [9-12]. Data also indicate that alcohol involves the formation of AGEs, and the increased AGEs may link to KP-mediated liver injury in the inflammatory and fibrotic steps [13,14]. However, no molecular mechanism experiment and clinical studies are done to investigate the roles of AGEs and its receptors of AGE(RAGE) in the pathogenesis of alcoholic liver injury and to study signal pathway of AGE-RAGE-oxidative stress-TNF-ɑ and TGF-β1 generation by hepatic KP with stable expression of CYP2E1in ALD.
Our hypothesis in this project is that AGEs by hepatocytes from alcohol metabolites, mainly acetaldehyde can activate Kupper cells to upregulates receptor expression of inflammatory CD14 and TLRs in conjunction with expression of AGE-associated receptor (RAGE), enhances hepatic oxidative stress formation leading to the production of reactive oxygen species (ROS), which not only activates intracellular signal transduction, leading to target gene expression for inflammatory and fibro genic mediators of TNF-ɑ and TGF-β1 that cause liver injury. Elevated inflammatory reactive receptors can in turn react with AGEs to generate inflammatory and fibro genic mediators via intracellular signal pathways.
This study is to test whether overexpression of CYP2E1 within macrophages are more sensitive to stimulators alcohol, AGEs and alcohol plus AGES by evaluation of TNF-ɑ and TGF-β1 generation, to investigate whether increased formation of TNF-ɑ and TGF-β1 results from activation of CD14-TLRs-oxidative stress pathway, and to study whether AGEs-RAGE- oxidative stress pathway is activated and involves the formation of TNF-ɑ and TGF-β1.
Materials and Methods
Transfection of CYP2El cDNA into RAW 264.7 Macrophages
Human CYP2E1 cDNA was inserted into the EcoR restriction site of a pCI-neo expression vector to generate the plasmid pCIneO2- E1 and transfection of pCI-neO2 -EI or pCI-neo into murine RAW 264.7 cells(American Type Culture Collection, Manassas, VA) were done described as our previous method [2,3]. Stable CYP2E1 expression was maintained in E2 cells for at least 20 passages.
Treatment of Macrophages
Transfected (E2) and wild type(WT) macrophages were cultured in serum-free RPMI 1640 medium containing alcohol 50 mM (Sigma, St. Louis, MO) [15] and AGE 100 microgram/ml [16,17]. AGEs were prepared in vitro by incubating bovine serum albumin (BSA, 50 mg/mL) with 0.5 mol/L glucose in 100 mmol/L sodium phosphate buffer, pH 7.4 as our described method [2].
TNF-ɑ and TGF-β1 Protein Assays
TNF-ɑ and TGF-β1 protein in culture medium was quantified, using the mouse TNF-ɑ and TGF-β1 ELISA kits (R&D Systems) per the manufacturer’s protocol, and data are expressed as ng/ml culture medium [2].
Western Blot Analysis of CD14, TLR2, TLR4, TLR9, RAGE, and Heme Oxygenase-1(HO-1)
E2, M1, and WT cells (3x10⁵) in six-well culture plates were treated for up to 24h. Aliquots of 20 μg of cell protein lysates were separated on 12%SDS-PAGE. Primary antibodies were mouse anti- CD14 antibody (1:1,000; PharMingen, San Diego, CA), rabbit anti- TLR2 and anti-TLR4 antibodies (1:500; Santa Cruz Biotechnology, Santa Cruz).
Mouse anti-RAGE (1:1000; Abcam, Cambridge, MA), and anti-TLR9 antibodies (1:500; Abcam, Cambridge, MA). For HO-1 expression study, E2, and M1cells (3x10⁵) in six-well culture plates were treated with alcohol, AGE, and alcohol+ AGE for 0.5 hr. For time course investigation of HO-1 expression, all three cell lines were treated with alcohol+ AGE for 0, 0.5, 2, and 24 hrs. Aliquots of 20μg of cell protein lysates were separated on 12% SDS- PAGE. Primary antibody of anti-HO-1(1:1000; OSA-100; Stressgen, Dublin, OH) was added and incubated for 6 hrs.
Equal protein loading was controlled by immunoblotting of the monoclonal mouse anti-glyceraldehyde 3-phosphate dehydrogenase (GAPDH). Immunoreactive proteins were visualized with a mixture of Immuno-Star substrate and enhancer (Bio-Rad, Hercules, CA) and exposed to X-ray film. Intensity of the bands was quantified by imaging densitometry. In each sample, band intensities were quantified with Image J software and normalized to GAPDH.
Hydrogen Peroxide(H2O2) Generation
E2 and M1cells (3x10⁵) in six-well culture plates were treated for 0, 0.5, 2 and 24 hrs, followed by fluorescent probes (described below) for 30 min in the darkness. The fluorescence intensity was determined in a spectrofluorometer (Bio-Rad, Hercules, CA). Intracellular H2O2 was assessed by adding 2’,7’-dichlorodihydrofluorescein diacetate (DCFH2-DA), obtained from Molecular Probes (Eugene, OR), to the macrophage culture at a final concentration of 20μM. The generation of 2’,7’-dichlorofluorescein (DCF) by oxidation of DCFH2-DA is proportional to the H2O2 produced. DCF fluorescence was measured at 488 nm for excitation and 525 nm for emission. The results were expressed as μM/mg protein.
Antisense Oligonucleotide Treatment
Antisense RAGE, anti-senses CD14, TLR4 and TLR9, and the corresponding sense oligonucleotides as well as scrambled oligonucleotides were synthesized at the DNA core-Oligonucleotide Synthesis Facility, Mount Sinai School of Medicine, NY. The sequences for the RAGE, CD14, TLR4 and TLR9 antisense (directed against the translation start sites of the respective mRNA) were as followings, RAGE, 5′-CAACTAGCTGTTCCGGCT-3′, CD14, 5′-CATGGTCGATAAGTCTTCCGAACCT- 3’, TLR4, 5′- CTCACGGGGCGAAAGTGGAGACGG- 3′, and TLR9, 5’- GAGAGCTGGGGTGAGACTTG-3’, respectively. The scrambled oligonucleotide sequence was 5’-CAAATGGGCTCCGACGTCGGT- 3’. WT, M1 and E2 cells were cultured in serum- free media for 12 h, followed by a medium containing 3μM antisense oligonucleotides in 10mg/ml lipofection (Invitrogen, Carlsbad, CA). The corresponding sense and scrambled oligonucleotides served as controls. After an overnight incubation, cells were treated with alcohol, AGE and alcohol+ AGE.
Data Analysis
Data are reported as means± SE. Statistical analysis included linear (Pearson) correlation and one-way ANOVA multiple comparison Student’s Newman-Keuls post-test. P<0.05 was considered to be significant.
Results
Alcohol+ AGE Synergistically Increases TNF-a Production by Macrophages Transfected with CYP2E1
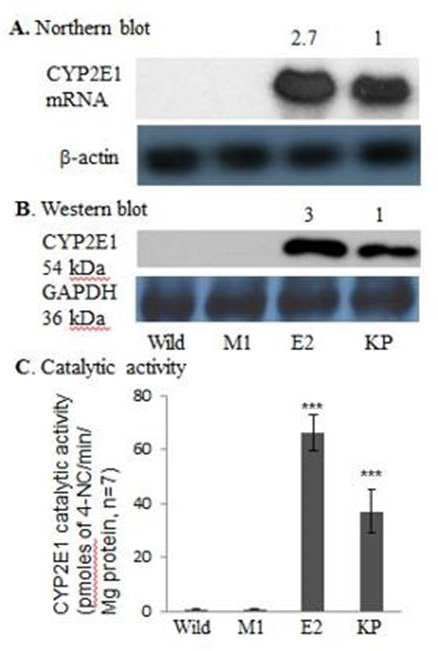
Figure 1: Cytochrome P4502E1 mRNA, protein and catalytic activity in CYP2E1-expressing macrophages shown by Northern blot analysis (A), Western blot analysis (B), and catalytic activity (C).
CYP2E1 expression of E2 cell line demonstrated about threefold increases in CYP2E1 mRNA and protein and about two-fold increase in catalytic activity relative to those in KP of rats fed ethanol for 3wk (66.1± 6.7 vs. 37.0 ± 8.2 pmol 4-NC/min /mg protein) in Figure 1. No CYP2E1 mRNA, protein and catalytic activity were detected in WT or M1 cells (Figure 1).
Intensity of the CYP2E1 mRNA and protein bands in E2 cells was normalized to that of actin and GAPDH, respectively, and the values are expressed relative to those of Kupffer cells. Numbers above the blots refer to mean values of 7 individual analyses. CYP2E1 transfection increased expression of CYP2E1 mRNA, protein, and catalytic activity compared with those in Kupffer cells. No CYP2E1 mRNA and protein and a negligible CYP2E1 catalytic activity were detected in WT and M1 macrophages. WT RAW 264.7 cells; M1, macrophages transfected with empty vector; E2(p20), passage 20 CYP2E1 transfected cells; KC, equivalent amounts of total RNA and/ or protein lysates from Kupffer cells of a rat fed ethanol for 3wks (positive control). ***P <0.001 vs. M1 or WT cells.
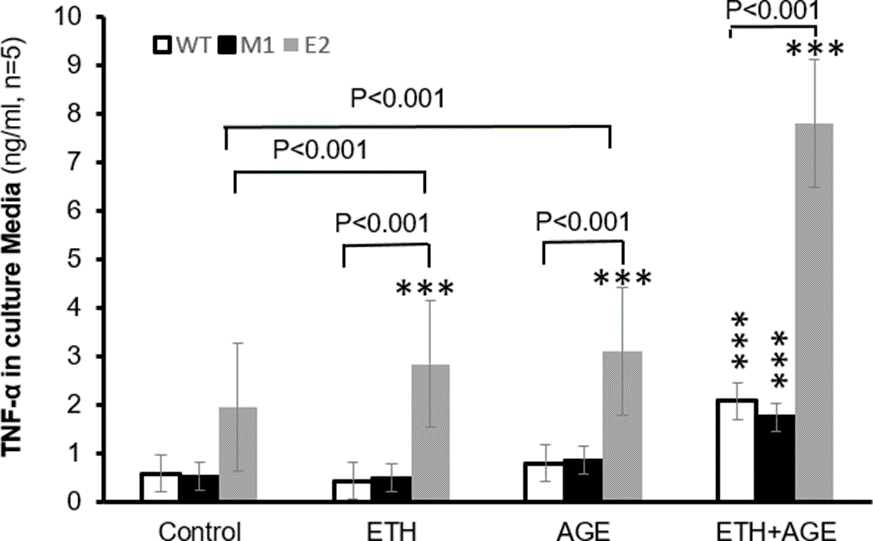
TNF-ɑ production in control E2 cells was about 2.5 times than that of M1 (1.94 vs.0.51 ng/ml, p<0.001) or WT cells (1.94 vs. 0.57 ng/ml, p<0.001, Figure 2), suggesting that E2 cells with overexpression of CYP2E1are primed to produce more TNF-ɑ. Alcohol+ AGE treatment increased about 3 times its protein in E2, compared with M1(7.79 vs. 1.74 ng/ml, p<0.001) and WT (7.79 vs. 2.07 ng/ml, p<0.001). Under treatment alcohol+ AGE, E2 cells increased protein synthesis about 301%, 174%, and 152% compared with E2 cells of control (7.79 vs. 1.94 ng/ml, p< 0.001), alcohol (7.79 vs. 2.84 ng/ml, p< 0.001) and AGE alone (7.79 vs. 3.09 ng/ml, p< 0.001), respectively. There is no significant difference in TNF-ɑ generation between M1 and WT cells. TNF-ɑ generation significantly increased in WT cells (2.07 vs. 0.57ng/ml, p< 0.001) and in M1 cells (1.74 vs. 0.51ng/ml, p< 0.001) between alcohol+ AGE treatment and control (non-alcohol and non-AGE treatment), respectively.
In addition, TNF-ɑ generation significantly increased in WT cells (2.07 vs. 0.42 ng/ml, p< 0.001, 2.07 vs. 0.78 ng/ml, p<0.001) and in M1 cells (1.74 vs. 0.49ng/ml, p< 0.001, 1.74 vs. 0.85ng/ml, p<0.001) between alcohol+ AGE and alcohol or AGE treatment alone, respectively. These results demonstrate that overexpression of CYP2E1 sensitizes macrophages to increase TNF-ɑ production in response to alcohol or AGE stimuli. Importantly combination of alcohol and AGE synergistically elevates TNF-ɑ production (Figure 2).
Macrophages transfected with empty vector (M1), WT, and CYP2E1 transfected mmacrophages (E2) are cultured in the absence or presence of alcohol or/and AGE treatment, and concentrations of TNF- ɑ in the culture media are assayed by ELISA. E2 cells has increased levels of TNF- ɑ the alcohol or/and AGE treatment stimuli.
Alcohol treatment increased about five times its level in E2, compared with M1 cells treated with alcohol(2.84 vs. 0. 49 in WT or 0.52 in M1 ng/ml, respectively p<0.001). There is increase in its protein by 46% between E2 cells without alcohol and with alcohol treatment (2.84 vs.1.94 ng/ml, p< 0.001). There was no significant difference in TNF- ɑ generation in M1 and WT macrophages treated with and without alcohol, indicating TNF- ɑ generation by non 2E1-expressing macrophages does not directly respond to alcohol treatment. AGE treatment increased its TNF- ɑ levels in all E2, M1 and WT macrophages, specifically TNF- generation in E2 was about three times greater than its M1(3.09 vs. 0.85ng/ml, p< 0.001) and WT cells (3.09 vs. 0.78ng/ml, p< 0.001) after AGE treatment.
There is elevated protein synthesis by 59% in E2 with AGE treatment compared with E2 without AGE or alcohol treatment (control) (3.09 vs.1.94 ng/ml, p< 0.001). There is no difference in its protein generation in E2 cells between alcohol and AGE treatment, nor in M1 and WT cells in three described treatment groups. TNF generation increased in WT cells (37%) and in M1 cells (68%) between AGE treatment and control (non-alcohol and non-AGE treatment), respectively. In addition, TNF- ɑ generation increased in WT cells (88%) and in M1 cells (76%) between AGE and alcohol treatment, respectively. *** p< 0.001 vs. E2 or WT cells in control.
Alcohol+ AGE Synergistically Increases TNF-a Production by Macrophages Transfected with CYP2E1.
The result was found similar to TNF-ɑ production in all three groups of cells in presence of alcohol, AGE and alcohol+ AGE. Under alcohol+ AGE treatment in Figure 3, TGF-β1 generation increased 34% in M1 cells and 38% in WT cells compared with corresponding cells with AGE treatment alone. These data show that overexpression of CYP2E1 sensitizes macrophages to increase TGF-β1 production in response to alcohol or AGE stimuli. Importantly combination alcohol and AGE synergistically elevates TGF-β1 production (Figure 3).
AGE Treatment
WT, M1, and E2 cells are cultured in the absence or presence of alcohol or/and AGE treatment, and concentrations of TGF- ɑ in the culture media are assayed by ELISA. E2 cells has increased levels of TGF- β1in the alcohol or/and AGE treatment stimuli. In the control (non-alcohol and non-AGE treatment), E2 cells released about 1 time more protein into the culture media than M1(214.96 vs.108.76 pg/ml, p<0.01) or WT cells (214.96 vs. 106.88pg/ml, p<0.01). These data suggest that E2 cells with overexpression of E2 gene are primed to produce more TGF- β Alcohol treated E2 cells increased about 1 time its protein compared with its control M1 (254.44 vs. 119.28pg/ml, p<0.001) and WT macrophages( 254.44 vs.114.78pg/ml, p<0.001).There was no significant difference in TGF- β generation in E2 cells between control and alcohol treatment, and in M1 and WT macrophages of control and alcohol treatment, respectively.
AGE treatment increased its protein in all E2, M1 and WT macrophages, specifically TGF- β generation in E2 increased about 86% compared with its M1cells (368.90 vs.197.66pg/ml, p< 0.001) and its WT cells (368.90 vs. 198.40pg/ml, p< 0.001) after AGE treatment. AGE treated E2 cells elevated its protein generation of TGF β by 71% and 45% compared with E2 cells from control (368.90 vs.214.96pg/ml, p< 0.001) and E2 cell w i t h alcohol treatment (368.90 vs.254.44pg/ml, p< 0.01), respectively. In addition, TGF-β1 generation significantly increased in WT cells (198.40 vs. 106.88pg/ml, p< 0.05, 198.40 vs. 114.78pg/ml, p< 0.05) and in M1 cells (197.66 vs. 108.76pg/ml, p< 0.05, 197.66 vs. 119.28pg/ml, p< 0.01) between AGE and control or alcohol treatment alone, respectively.
However, Alcohol+ AGE treatment increased about 1time its protein in E2, compared with its control M1 (600.22 vs. 264.68pg/ml, p<0.001) and WT macrophages (600.22 vs. 272.94pg/ml, p<0.001). E2 cells with alcohol+ AGE treatment increased 179%, 136%, and 63% its proteins in E2 cells of control (600.22 vs. 214.96pg/ml, p< 0.001), alcohol (600. 22 vs. 254.44pg/ml, p< 0.001) and AGE (600.22 vs. 368.90pg/ml, p< 0.001) alone, respectively. The TGF- β1 generation in M1 cells treated with alcohol+ AGE increased about 1 time compared with M1 cells of control (264.68 vs.108.76pg/ml, p< 0.001), or alcohol treatment (264.68 vs.119.28pg/ml, p< 0.001). Similar to M1 cells treated with alcohol+ AGE, TGF- β1 generation in WT cells also increased about 1 time compared with its control or alcohol treatment alone and there is no difference between M1 and WT cells. *p<0.05, **p<0.01, and ***p< 0.001 vs. corresponding cells in control group.
Alcohol+ AGE Synergistically Induce Receptors on Macrophages Transfected with CYP2E1.
To study the possible mechanisms involved, we first evaluate the receptor CD14 and its coreceptors TLR4 and TLR9 and RAGE in Figure 4, which transduce AGE signals, leading to the generation of oxidants. Significant increase was observed for TLR4, TLR9 and RAGE in E2 cells, whether in the control or in their presence of alcohol or AGE treatment compared with either M1 or WT cells. Importantly, Alcohol+vAGE treatment synergistically increases expressions of TLR4,9 and RAGE when compared with control, alcohol or AGE treatment alone. TLR2 levels were not altered among three cell lines treated with control, alcohol, AGE and Alcohol+ AGE. Thus, increase in CD14, TLR4, TLR9 and RAGE in E2 cells with overexpression of CYP2E1 gene could be one of mechanisms by which macrophages are sensitized to alcohol+ AGE stimuli (Figure 4).
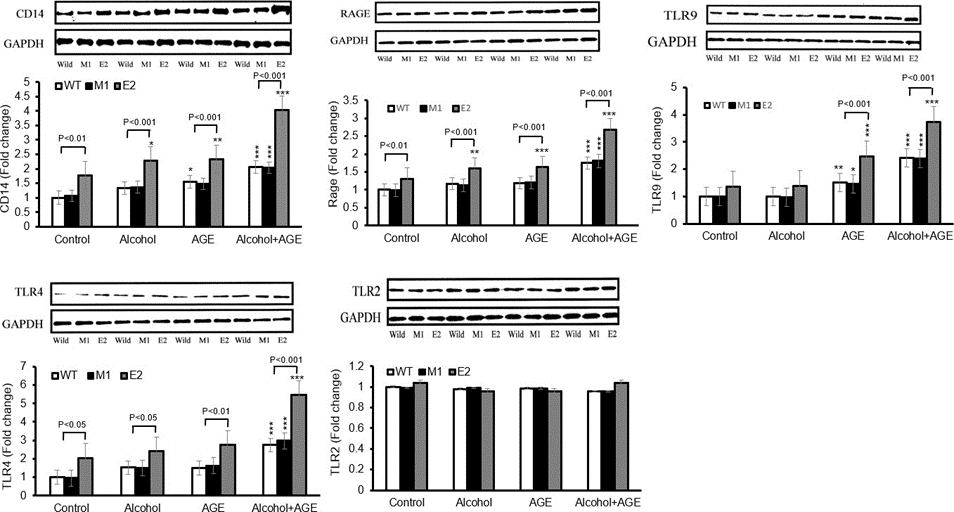
Figure 4: Increased levels of CD14, TLR4, TLR9 and RAGE in CYP2E1-expressing macrophages with alcohol and AGE treatment.
Levels of CD14, TLR4, TLR9 and RAGE in macrophages cultured in the absence or presence of alcohol or/and AGE for 24 h are analyzed by Western blot. Densitometry units are expressed as fold change relative to WT cells (control) assigned a value of 1. CD14, TLR4, TLR9 and RAGE levels in E2 cells are higher in presence of alcohol or/and AGE than those in absence of alcohol or/and AGE. TLR2 expression is not affected. By Western blot analysis, in the control, 77% higher level of CD14 was seen in E2 than in M1 (1.77 vs. 1.06, p<0.01) and WT cells (1.77 vs. 1.00, p<0.01), but no significant difference was found between M1 and WT cells.
Treatment with alcohol or AGE alone upregulated CD14 in E2 (2.29 vs. 1.77, p<0.05; 2.37 vs.1.77, p< 0.01), M1 (1.367, vs.1.06, p>0.05; 1.48 vs.1.06, p>0.05) and WT cells (1.32, vs.1.00, p>0.05; 1.55, vs.1.00, p<0.05) compared with corresponding cell lines in control group(non-alcohol or AGE treatment).The expressions of CD14 in either alcohol or AGE treatment were higher in E2 than in similarly treated M1 cells (2.29 vs. 1.37, p< 0.001; 2.37 vs. 1.48, p< 0.001)and WT cells(2.29 vs. 1.32, p< 0.001; 2.37 vs. 1.32, p< 0.001). No difference in CD14 expression of either E2 cells or M1 and WT cells between alcohol and AGE treatment. Treatment with Alcohol+ AGE further upregulated CD14 in all E2 and M1, WT cells compared with control, alcohol, or AGE treatment alone.
The level of CD14 expression was significantly greater in E2 than that in M1 (4.02 vs. 2.04, p<0.001) and WT cells (4.02 vs. 2.06, p<0.001). Level of CD14 expression in E2 of AGE+ alcohol treatment increased compared with that of alcohol (4.02 vs. 2.29, p< 0.001), AGE (4.02 vs. 2.37, p< 0.001), and of control (4.02 vs. 1.77, p< 0.001). In M1 and WT cells, there is increase in CD14 expression after alcohol +AGE treatment compared with AGE(2.04 vs.1.48, p< 0.05; 2.06 vs.1.55, p< 0.05), alcohol(2.04 vs.1.37, p< 0.01; 2.06 vs.1.32, p< 0.01) and control(2.04 vs.1.06, p< 0.001; 2.06 vs.1.00, p< 0.001), respectively. ***p< 0.001, **p<0.01 and *p< 0.05 vs. corresponding cells in control.
Effects of Increased CYP2E1 Expression on Oxidant Generation
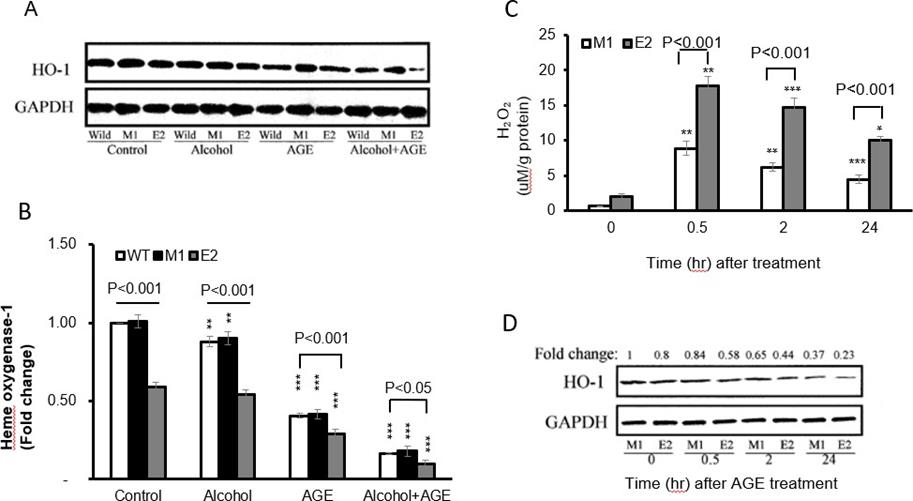
Because oxidants mediate alcohol and AGE signal transduction, leading to TNF-α and TGF-β1 production in macrophages, we determined H2O2 levels by these cells. In the Alcohol+ AGE treatment, both E2 cells and M1 cells demonstrate time-dependent generation of intracellular H2O2, with the peak identified at 30 minutes post treatment (17.82 vs. 2.08 by E2 cells at time 0-minute, p<0.001 and 17.82 by E2 cells at peak time vs. 0.66 by M1 cells at time 0-minute, p<0.001) Figure 5 Top. Importantly there was significant increase in formation of intracellular H2O2 in E2 cells compared with M1 cells, with about 2 times greater at 30 minutes (17.82 vs. 8.84, p<0.001).
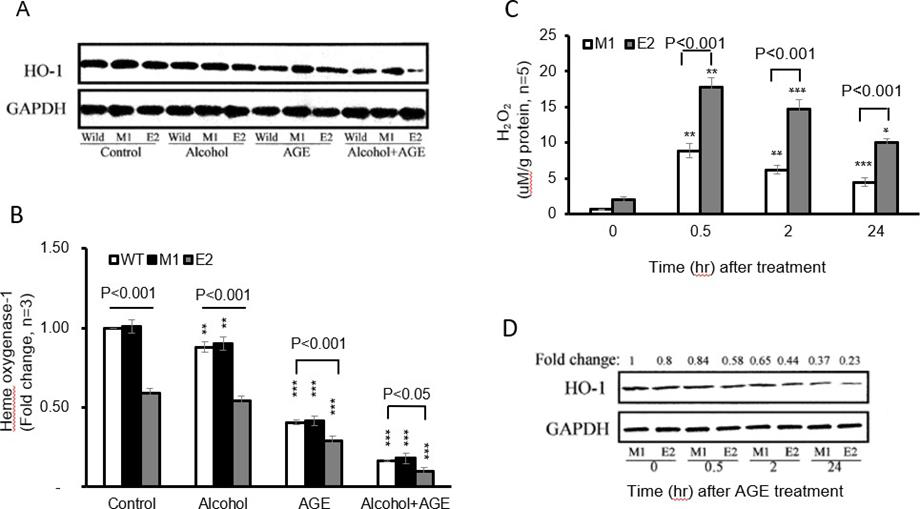
Figure 5: Effects of CYP2E1 overexpression on oxidative stress in macrophages with alcohol and AGE treatment.
By Western blot analysis, all three group cells were treated with alcohol, AGE and alcohol +AGE for 30 minutes. In the control group, E2 cells showed 41% lower HO-1 protein levels than in the M1(0.59 vs. 1.01, p<0.001) and WT cells (0.59 vs. 1.00, p < 0.001) Figure 5A. No significant difference in HO-1 levels between control and alcohol treatment was found in E2 cells or in both M1 and WT cells.
Treatment with AGE further decreased 50% HO-1 levels in E2(0.29 vs. 0.59, p<0.001), 58% in M1(0.42 vs. 1.01, p<0.001), and 59% in WT cells (0.41 vs. 1.00, p< 0.001) compared with corresponding cells in control group, specifically further 71% decrease of HO-1 expression in E2 treated with AGE was identified compared with WT cells in control group (0.29 vs. 1.00, p<0.001). However, treatment with alcohol+ AGE dramatically down-regulated HO-1 in all E2, M1 and WT cells compared with corresponding E2(0.10 vs. 0.59, p<0.001), M1(0.18 vs. 1.01, p< 0.001), and WT cells (0.17 vs. 1.00, p<0.001) in control group. More prominent changes in E2 cells were identified compared with either M1 cells (0.10 vs. 1.01, p< 0.001) or WT cells (0.10 vs. 1.00, p< 0.001) without treatment of either alcohol or AGE.
Interestingly treatment of alcohol+ AGE showed that HO 1expression further decreased by 82% in E2 cells compared with E2 cells treated with alcohol (0.10 vs.0.54, p< 0.001), and by about 80% in M1 (0.18 vs.0.90, p< 0.001), or WT cells (0.17 vs.0.88, p< 0.001) compared with M1 or WT cells treated with alcohol. HO- 1expression decreased by 66% in E2 cells treated with alcohol+ AGE compared with E2 cells treated with AGE (0.10 vs.0.29, p< 0.001) and by 57% in M1(0.18 vs.0.42, p< 0.001) and 59% in WT cells (0.17 vs.0.41, p< 0.001) compared with M1 or WT cells treated with alcohol.
To investigate time course of HO-1 changes in E2 after treatment of alcohol+ AGE for 0, 0.5,2 and 24hrs, expressions of HO-1 were done by western blot. Data showed time-dependently decrease in HO-1 expressions in both E2 and M1 cells. Specifically, HO-1 levels at 24hrs post treatment decreased by 71% in E2 cells and 63% in M1 cells compared with those at 0 minutes Figure 5B. These results demonstrate that CYP2E1 overexpression enhances oxidative stress formation in macrophages and sensitizes them to response Alcohol+ AGE stimuli (Figure 5).
a. E2 and M1 macrophages cultured in the presence of alcohol and AGE treatment for 0, 30 min, 2 and 24h are analyzed for intracellular H2O2 formation using fluorescent probes, increased 2’7’-dichlorofluorescein (DCF) fluorescence is proportional to increased H2O2 generation. The peak is identified at 30 minutes post treatment.
b. Decreased HO-1 levels in CYP2E1-expressing macrophages with alcohol and AGE treatment. Levels of HO-1 in macrophages cultured in the absence or presence of alcohol or/and AGE for 24h is analyzed by Western blot. Densitometry units are expressed as fold change relative to WT cells (control) assigned a value of 1. HO-1 levels in E2 cells are more significantly reduced in the presence of alcohol or/and AGE than those in absence of alcohol or/and AGE. HO-1 level is reduced in E2cells at 24h. ***p< 0.001 vs. corresponding cells in control.
Antisense RAGE, CD14, TLR4 and TLR9 Decreases TNF-ɑ Generation
Treatment of alcohol+ AGE in Figure 6B increased about 3.5 times TNF-ɑ protein in E2, compared with M1 macrophages (7786.6 vs.1744.7ng/ml, p< 0.001). Addition of siRNAs of RAGE, CD14, TLR4 and TLR9 partially decreased TNF ɑ by 35-56% compared with its E2 with treatment of alcohol+ AGE, and by 37-52% in M1 cells, respectively. There is no effect of polymyxin and scrambled siRNA on alcohol+ AGE-induced TNF-ɑ generation in both E2 and M1 cells. However, combination treatment of siRNAs of RAGE, CD14, TLR4 and TLR9 completely blocked TNF-ɑ generation by alcohol+ AGEtreated E2 and M1 cells Figure 6C.
These siRNAs did not affect TNF-ɑ generation in E2 and M1 cells without treatment of alcohol+ AGE Figure 6A-C. These results demonstrate TNF-ɑ generation in E2 cells with overexpression of CYP2E1 is related with activation of CD14 and its co-receptors of TLR4 and TLR9 as well as RAGE (Figure 6).
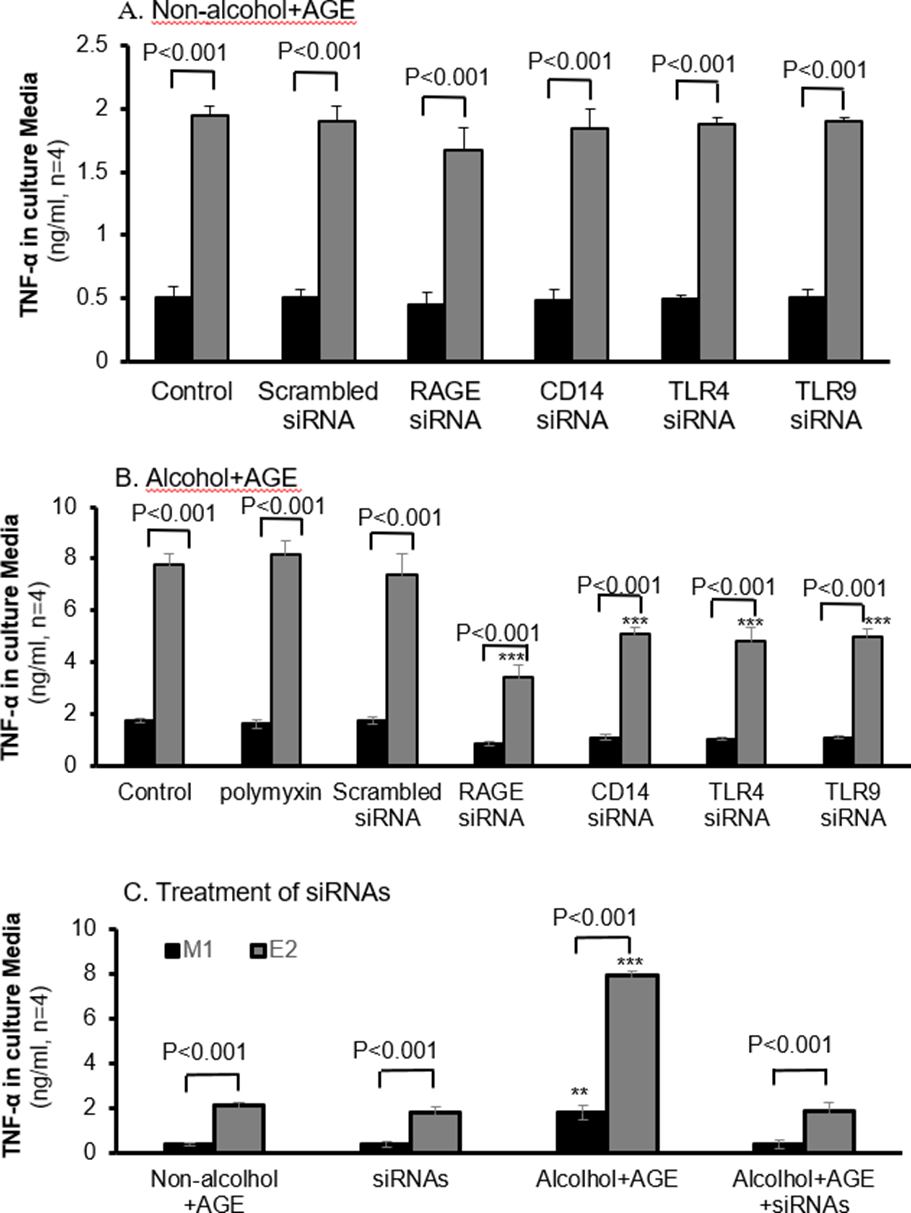
Figure 6: Decreased TNF-α in CYP2E1-expressing macrophages with siRNAs of RAGE, CD14, TLR4 and TLR9.
Macrophages are cultured in the absence or presence of alcohol and AGE treatment, and concentrations of TNF-ɑ in the culture media are assayed by ELISA. A: TNF-ɑ in CYP2E1- expressing macrophages with siRNAs of RAGE, CD14, TLR4 and TLR9 without the alcohol and AGE treatment is not affected. B: Addition of siRNAs of RAGE, CD14, TLR4 and TLR9, E2 cells has decreased levels of TNF-ɑ in the alcohol and AGE treatment stimuli. C: Addition of all antisense RAGE and antisensesCD14, TLR4 and TLR9 in the culture media almost completely blocks expression of TNF-α in E2 cells with treatment of alcohol and AGE. ***p< 0.001 vs. corresponding cells in control.
Antisense RAGE, CD14, TLR4 and TLR9 Decreases TGF-β1 Generation by E2 and M1 Cells
Treatment of alcohol+ AGE in Figure 7B increased about 1-time TGF-β1 protein in E2, compared with its control M1 macrophages (600.22 vs.264.68pg/ml, p< 0.001). Addition of siRNAs of RAGE, CD14, TLR4 and TLR9 partially decreased its protein by 17-34% compared with its E2 with treatment of alcohol+ AGE, and by 31- 42% in M1 cells, respectively. There is no effect of polymyxin and scrambled siRNA on alcohol+ AGE- induced TGF-β1 generation in both E2 and M1 cells Figure 7A.
However, combination treatment of siRNAs of RAGE, CD14, TLR4 and TLR9 completely blocked TGF-β1 generation by alcohol+ AGE-treated E2 and M1 cells Figure 7C. These siRNAs did not affect TGF-β1 generation in E2 and M1 cells without treatment of alcohol+ AGE Figure 7A-C. These results demonstrate TGF-β1 generation in E2 cells with overexpression of CYP2E1 is related with activation of CD14 and its co-receptors of TLR4 and TLR9 as well as RAGE (Figure 7).
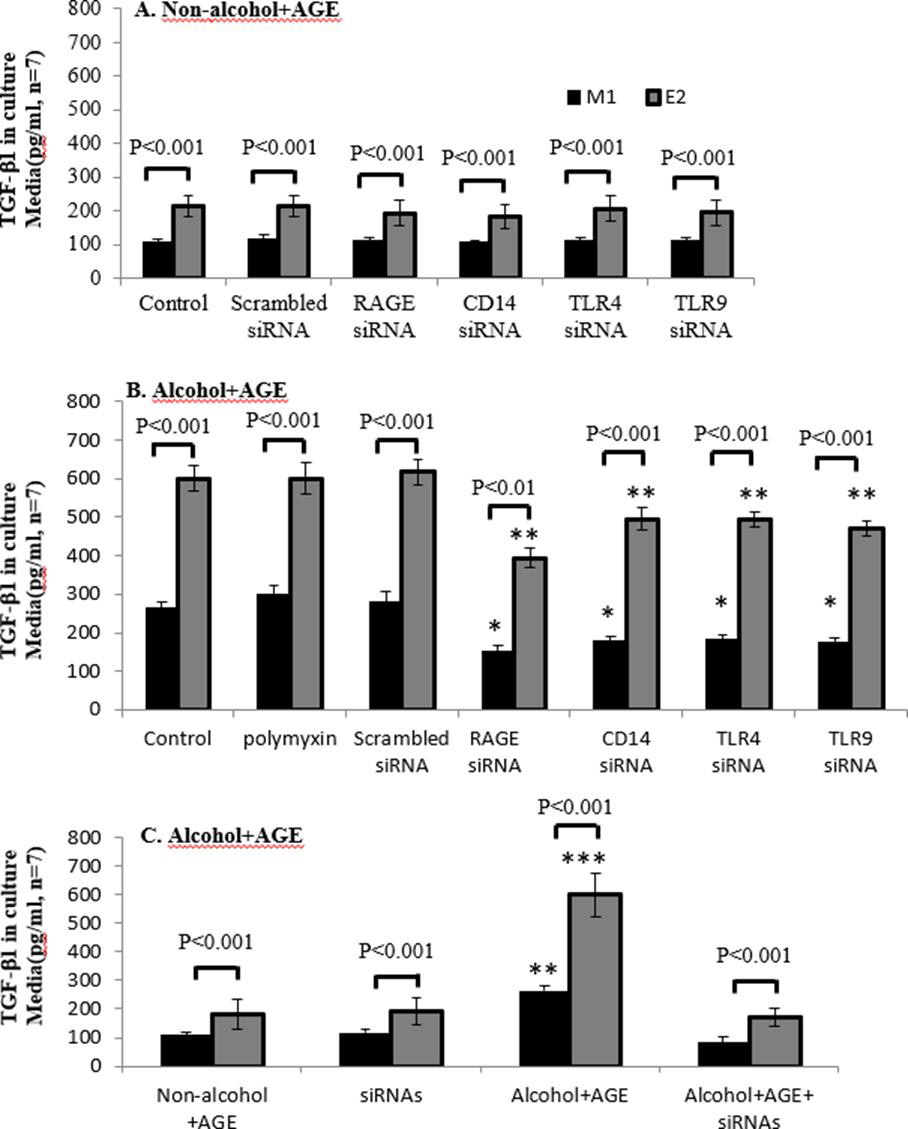
Figure 7: Decreased TGF-β1 in CYP2E1-expressing macrophages with siRNAs of RAGE, CD14, TLR4 and TLR9.
Macrophages are cultured in the absence or presence of alcohol and AGE treatment, and concentrations of TGF-β1 in the culture media are assayed by ELISA. A: TGF-β1in CYP2E1-expressing macrophages with siRNAs of RAGE, CD14, TLR4 and TLR9 without the alcohol and AGE treatment is not affected. B: Addition of siRNAs of RAGE, CD14, TLR4 and TLR9, E2 cells has decreased levels of TGF-β1in the alcohol and AGE treatment stimuli. C: Addition of all antisense RAGE and antisensesCD14, TLR4 and TLR9 in the culture media almost completely blocks expression of TGF-β1in E2 cells with treatment of alcohol and AGE. ***p< 0.001 and **p<0.01 vs. E2 cells in control.
Discussion
Our findings showed that treatment with alcohol, AGE or both increases the production of inflammatory and fibro genic mediators TNF-α and TGF-β1 in CYP2E1 transfected macrophages compared with controls. Expression of receptors CD14, RAGE, TLR4,9 but not TLR2 increases when cells with expression of CYP2E1 are treated with alcohol and AGE compared with two controls. In addition, over-formation of hydrogen peroxide in the CYP2E1 expressing cells is elevated but expression of heme oxygenase-1(HO-1) is downregulated when cells are treated with alcohol and AGE. Furthermore, treatment with antisense RAGE, CD14, TLR4, and TLR9 downregulates expression of TNF-α and TGF-β1 induced by cells treated with alcohol and AGE [18]. CYP2E1 is the key enzyme that contributes to H2O2 generation in ALD. CYP2E1 has been identified in both microsomes and mitochondria [2]. The enzyme in both fractions is inducible by alcohol consumption. Because CYP2E1 induction in KP by alcohol explains the mechanisms by which KP are sensitized to LPS by alcohol feeding, a critical step in early alcoholic liver injury [2]. CYP2E1 expression is not stable when KP were isolated from the livers of alcohol-fed animals.
This instability of CYP2E1 expression in vitro KP limits the specific CYP2E1 roles in KP-associated inflammatory and fibro genic mediators. Our E2 cell line with stable expression of CYP2E1 provides a useful tool to investigate roles of CYP2E1 expression in the production of inflammatory and fibro genic mediators when the cells are treated with ALD-associated stimulators. AGEs are generated in the body from the chemical modification of protein amino groups by glucose through a series of oxidative and nonoxidative reactions [9-12, 19]. When glucose reacts with free amino groups in proteins, nucleic acids and lipids, Schiff bases are found, which rearrange to become Amador products. Further reactions and modifications in the Amador products result to irreversible AGEs. The main pathways to generate AGEs are oxidative and non-oxidative reactions which form CML, pentosidine and pyrraline. Polio pathway is initiated by sorbitol transformation into fructose. Then reactive metabolic intermediates methylgyoxal and 3-deoxyglucosone form via fragmentation of triose phosphate, catabolism of ketone bodies or threornine and fructose-3- phosphate, leading to the formation of CEL and pyrraline. In addition, lipid peroxidation of polyunsaturated lipids can generate glyoxal, leading to AGE formation. AGEs play a significant role in the development of various tissue damages [9-12] and non-alcoholic steatohepatitis [19]. Importantly, alcohol consumption can drive AGE formation. Formation of AGE contributes the pathogenesis of ALD [13]. Failure of liver function in patients with hepatic cirrhosis contributes to the accumulation of AGEs in circulation in several ways. Firstly, the reduction of functional liver mass impairs the hepatic removal of AGEs. Secondly liver endothelial cells and KP can rapidly uptake AGEs and these liver endothelial cells and KP can rapidly uptake AGEs. This function could be damaged by hepatic injury [19]. Lastly the increased liver oxidative stress enhances AGE formation because liver injury has decreased antioxidant capacity as well as increased local inflammatory processes, favoring the formation of oxidative stress. Thus, AGE and AGE-induced ROS contribute to pathogenesis of ALD [13].
Our previous study showed CYP2E1 expression primes macrophages to increase TNF-α production in response to LPS stimuli [2]. However, it is not known how CYP2E1 expression in KP regulates synthesis of TNF-α and TGF-β1 with treatment of alcohol, AGE, and alcohol+ AGE. In our current study, E2 cells are primed to produce more TNF-α and TGF-β1. Alcohol or AGE alone treatment upregulates TNF-α and TGF-β1in all macrophages. Alcohol+ AGE treatment synergistically increases TNF-α and TGF-β1 in all macrophages and generation of both cytokines is the greatest in E2 cells. These results demonstrate that overexpression of CYP2E1 sensitizes macrophages to increase TNF-α and TGF-β1 production in response to Alcohol+ AGE. Published data demonstrated over formation of AGE within the liver in animals with ALD [13]. These data support alcohol consumption may not only elevate production of AGE but also combination of AGE and alcohol can significantly induce formation of inflammatory and fibro genic mediators, contributing to liver damage. The increased expression of CYP2E1 sensitizes KP to other pathogenic stimulators endotoxin and regulates activation of cellular receptors of CD14 and cellular signal pathways of TLR-4, 9 and RAGE, leading to overproduction of TNF-α and TGF-β1 [2,3,6&7]. In our current study, E2 cells are primed to induce greater expression of CD14, TLR-4, 9 and RAGE. Alcohol or AGE alone treatment further upregulated expression of CD14, TLR- 4, 9 and RAGE.
Alcohol+ AGE treatment most increased CD14, TLR-4, 9 and RAGE. These results demonstrate that overexpression of CYP2E1 sensitizes macrophages to increase CD14, TLR- 4, 9 and RAGE in response to Alcohol+ AGE. As we have previously observed that CD14 and TLR4 upregulated in CYP2E1-expressing macrophages [2]. RAGE and some members of the TLRs, especially TLR4 functionally coordinate and regulate immune and inflammatory responses [20]. β-Caryophyllene ameliorates LPS-induced liver damage through suppression of RAGE-mediated inflammatory signaling pathways [21]. RAGE is a multiligand cell- surface receptor that binds to several distinct proinflammatory ligands and has been implicated in the pathogenesis of several disease conditions, including liver injury [22].
Therefore, our findings and other published data suggest that overexpression of CYP2E1 within macrophages upregulates production of inflammatory and fibro genic mediators via upregulation of multiple receptor expression [2,23].
Overexpression of CYP2E1 plays an essential role of oxidative stress formation in liver cells including KP. But no studies are done in the investigation of alcohol and AGE-stimulation of production of oxidative stress-mediated inflammatory and fibro genic mediators by KP in ALD. In our current study, E2 cells are primed to produce more H2O2 and downregulate antioxidant HO-1. Alcohol and AGE alone treatment further upregulates H2O2 and decreases HO-1. Alcohol+ AGE treatment demonstrates the greatest changes in the levels of H2O2 and HO-1. TLR2 expression in macrophages is not affected by alcohol and/or AGE expression, which is not further investigated whether this receptor may not contribute signal transduction.
These results demonstrate that overexpression of CYP2E1 sensitizes macrophages to increase H2O2 formation and to downregulate HO-1 expression in response to Alcohol+ AGE. Our study demonstrates CYP2E1 overexpression in macrophages results in increase in expression of CD14 and its coreceptors TLR4, 9 and RAGE and these receptor expressions are further upregulated when treatment with alcohol+ AGE. CYP2E1 overexpression also increase formation of H2O2 and decreases levels of HO-1expression in macrophages with overexpression of CYP2E1. Thus, chronic alcohol consumption sensitizes KP by up-regulating CYP2E1. Alcoholprimed KP is more sensitive to AGE stimulation. The possible mechanisms by which alcohol activates KP include increased expression of CYP2E1, enhanced formation of ROS formation, and upregulated expression of inflammatory related- receptors RAGE, CD14 and TLRs. Elevated inflammatory reactive receptors can in turn react with AGEs to generate inflammatory and fibro genic mediators via these intracellular signal pathways.
To investigate how these receptors-mediated formation of oxidants pathway regulates synthesis of TNF-ɑ and TGF-β1 in these macrophages with overexpression of CYP2E1, antisense RAGE, CD14, TLR4 and TLR9 were applied in our experiments. Our results demonstrate addition of individual antisense RAGE, CD14, TLR4 or TLR9 partially downregulates expression of TNF-α and TGF-β1 in E2 cells with treatment of alcohol and AGE. However, addition of all antisense together almost completely blocks expression of TNF-α and TGF-β1 in E2 cells with treatment of alcohol+ AGE. These findings indicate RAGE, and receptors of CD14, TLR4 and TLR9 at least in part involve regulation of expression of TNF-α and TGF-β1 in CYP2E1-mediated macrophages induced by alcohol and AGE, and these antisense may provide a practical experimental way to investigate individual receptor role of alcohol and AGE-mediated expression of TNF-α and TGF-β1 in our future study.
In summary, Alcohol-primed macrophages are more sensitive to stimulators alcohol, AGE and particularly alcohol plus AGE. AGE-stimulated formation of TNF-ɑ and TGF-β1 is associated with activation of conventional CD14/TLRs-oxidative stress pathway in in vitro macrophages with CYP2E1 expression. Importantly novel AGEs-RAGE-oxidative stress pathway is activated and involves the formation of TNF-ɑ and TGF-β1. These results suggest the direct pathological relevance of alcohol in macrophages to CYP2E1 induction in KP in vivo by ethanol. It is particularly worth noting that TNF-α and TGF-β1 generation correlated positively and significantly with stimulation of AGE in alcohol-primed KP.
Tasks of Authors
Qi Cao, PI of the project, oversaw project and wrote the manuscript. Yamin Wan, Zhizhen Li, Xicui Sun, Minjie Chen, Shujing Li and Li Zhang conducted lab experiments. Liya Pi, Bin Ren, and Zhekang Ying, collaborators who worked with cellular and molecular biology, animal models and transgenic studies and revised the manuscript.
Acknowledgements
The authors wish to acknowledge and thank Jingqin Ling, MD, Rikka Saito Ph.D, Zixing Wang, MS, Yongwang Zhong, Ph.D, Hongbin Wang, Ph.D, and Shenyun Fang, PhD for technical assistance. The authors wish to acknowledge and thank Brigitte Pocta, MLA for language editing.
This work was supported by research Grants from the National Institute on Alcohol Abuse and Alcoholism of the National Institutes of Health (Award Number K08AA024895-Qi Cao), R01AA028995- 01-Liya Pi/sub-PI-Qi Cao), Radiological Society of North America (RSNA) Research Resident Grant (Qi-Cao), University of Maryland Baltimore Innovative Research Grant, the Chair Research Foundation of the University of Maryland School of Medicine Department of Diagnostic Radiology and Nuclear Medicine (Qi Cao), and the Institute for Clinical & Translational Research (ICTR), the University of Maryland Baltimore (Qi Cao).
References
- Lieber CS (2005) Pathogenesis and treatment of alcoholic liver disease: progress over the last 50 years. Rocz Akad Med Bialymst 50: 7-20.
- Cao Q, Mak KM, and Lieber CS (2005) CYP4502E1 primes macrophages to increase TNF-alpha production in response to lipopolysaccharide. Am j physiol gastrointest liver physiol 289(1): G95- G107.
- Cao Q, Mak KM, Lieber CS (2002) DLPC decreases TGF-beta1-induced collagen mRNA by inhibiting p38 MAPK in hepatic stellate cells. Am j physiol gastrointest liver physiol 283(5): G1051-G1061.
- Trasino SE, Tang XH, Jessurun J, Lorraine J Gudas (2016) A retinoic acid receptor β2 agonist reduces hepatic stellate cell activation in nonalcoholic fatty liver disease. J mol med 94(10): 1143-1151.
- Kwon HJ, Won YS, Park O, Vasilis Vasiliou, Geoffrey M Thiele, et al. (2014) Aldehyde dehydrogenase 2 deficiency ameliorates alcoholic fatty liver but worsens liver inflammation and fibrosis in mice. Hepatology 60(1): 146-157.
- Wei J, Huang Q, Huang R, Yongxing Chen, Shujuan Lv, et al. (2013) Asiatic acid from Potentillachinensis attenuate ethanol- induced hepatic injury via suppression of oxidative stress and Kupffer cell activation. Bio pharm Bull 36(12): 1980-1989.
- Hritz I, Mandrekar P, Velayudham A, Donna Catalano, Angela Dolganiuc, et al. (2008) The critical role of toll-like receptor (TLR) 4 in alcoholic liver disease is independent of the common TLR adapter MyD88. Hepatology 48(4): 1224-1231.
- Ambrożewicz E, Bielawska K (2016) Proteincarbonylation-reasons, effects and determination. Postepy Biochem 62(4): 495-505.
- Galì A, Mucciardi G, Butticè S, Enrica Subba, Carmela D'Amico, et al. (2017) Correlation Between Advanced Glycation End-Products, Lower Urinary Tract Symptoms and Bladder Dysfunctions in Patients with type 2 Diabetes Mellitus. Low urin tract Symptoms 9(1): 15-20.
- Prasad K, Dhar I, Zhou Q, Hamdi Elmoselhi, Muhammad Shoker, et al. (2016) AGEs/sRAGE, a novel risk factor in the pathogenesis of end-stagerenal disease. Mol cell biochem 423(1-2): 105-114.
- Xu XY, Deng CQ, Wang J, Xiao Juan Deng, Qian Xiao, et al. (2017) Plasma levels of soluble receptor for advanced glycation end products in Alzheimer's disease. int jneurosci 127(5): 454-458.
- Chen M, Li H, Wang G, Shumei Zhao, Wen Su, et al. (2016) Atorvastatin prevents advanced glycation end products (AGEs)-induced cardiac fibrosis via activating peroxisome proliferator-activated receptor gamma (PPAR-γ). Metabolism clin exp 65(4): 441-453.
- Hayashi N, George J, Takeuchi M, Atsushi Fukumura, Nobuyuki Toshikuni, et al. (2013) Acetaldehyde-derived advanced glycation end- products promote alcoholic liver disease ALD. PLoS One 8(7): e70034.
- Leung C, Herath CB, Jia Z, Sof Andrikopoulos, Bronwyn E Brown, et al. (2016) Dietary advanced glycation end- products aggravate non-alcoholicfatty liver disease. World j gastroenterol 22(35): 8026-8040.
- Griffon B, Cillard J, Chevanne M, P Cillard, O Sergent (2000) Activated macrophages increase the susceptibility of rat hepatocytes to ethanol-induced oxidative stress: conflicting effects of nitric oxide. Alcohol and alcohol 35(3): 230-235.
- Liu H1, Zheng F, Cao Q, Bin Ren, Li Zhu, et al. (2006) Amelioration of oxidant stress by the defensin lysozyme. American Journal of Physiology - Endocrinology and Metabolism. Am Phsiol Society 290(5): E824-E832.
- Liu H, Zheng F, Li Z, Uribarri J, Helen Vlassara, et al. (2006) Reduced acute vascular injury and atherosclerosis in hyperlipidemic mice transgenic for lysozyme. Am J Pathol 169(1): 303-313.
- Cao Q, Mak KM, Lieber CS (2004) Leptin stimulates tissue inhibitor of metalloproteinase-1 in human hepatic stellate cells. J bio chem 279(6): 4292-4204.
- Kimura Y, Hyogo H, Yamagishi S, Masayoshi Takeuchi, Tomokazu Ishitobi, et al. (2010) Atorvastatin decreases serum levels of advanced glycation endproducts (AGEs) innonalcoholic steatohepatitis (NASH) patients with dyslipidemia: clinicalusefulness of AGEs as a biomarker for the attenuation of NASH. J gastroenterol 45(7): 750-757.
- Ibrahim, ZA, Armour, CL, Phipps, S, Maria B Sukka (2013) RAGE and TLRs: relatives, friend or neighbours? Mol immuno 56(4): 739-744.
- Hong-Ik Cho, Jeong Min Hong, Joo Wan Choi, Sang Kook Lee, Sun Mee Lee et al. (2015) β-Caryophyllene alleviates D-galactosamine and lipopolysaccharide-induced hepatic injury through suppression of the TLR4 and RAGE signaling pathways. Euro j of pharmacol 764: 613-621.
- Hyogo H, Yamagishi S (2008) Advanced glycation end products (AGEs) and their involvement in liver disease. Curr pharm des 14(10): 969-72.
- Swaminathan K, Kumar SM, Clemens DL, Aparajita Dey (2013) Inhibition of CYP2E1 leads to decreased advanced glycated endproduct formation in high glucose treated ADH and CY P2E1 over-expressing VL-17A cells. Biochim biophy acta 1830(10): 4407-4416.



 We use cookies to ensure you get the best experience on our website.