Mini Review 
 Creative Commons, CC-BY
An Approach to Protein Structure Using Information Geometry
*Corresponding author: Dodson CTJ, School of Mathematics, University of Manchester UK.
Received: January 29, 2022; Published: February 16, 2022
DOI: 10.34297/AJBSR.2022.15.002123
Abstract
In the light of recent structural developments in DNA structural diversity crystallographic studies and the Protein Data Bank [1], this note is intended to draw attention to an interesting feature of the ordering of amino acids along protein chains. They all exhibited clustering compared to a random distribution, so there is a stable long range ordering that is unexpected. To date we have no clear explanation of why this should be the case.
Keywords: amino acids, clustering, protein chains, gamma distributions, information geometry.
Introduction
Twenty years ago we [2] reported an unexpected result that we had detected through statistical study of the long range ordering of amino acids along the protein chain in the Saccharomyces cerevisiae genome. The process of protein synthesis uses 20 amino acids which we can label i = 1, 2, … , 20; each amino acid i having a relative abundance pi, yielding a protein chain of total length n amino acids. The count for each amino acid i of the spacing lengths between successive recurrences in the chain yielded 20 empirical distributions, which of course depend on the rules used to make the choices along the chain. Overall we used data consisting of 6294 protein chains with chain lengths n up to 4092, containing over 3 million amino acids.
One particular well-defined and pivotal rule is to make the choice of adding amino acids completely at random, so then the only influence on the chain is the relative abundancies of the amino acids. In fact we obtained an analytical solution to this scenario [2], so we could compare it with the empirical results described above. In fact both the solution to the random scenario and the empirical data, though discrete of course, yielded distributions that were rather well modelled by a family of gamma distributions [3], cf. [2] for details of goodness of fit. So we could reasonably map the empirical distributions onto the smooth family of gamma distributions via maximum likelihood parameters.
Information geometry [3,4,5] provides a curved surface structure on the family of gamma distributions, with coordinates (𝜿, μ) the space of parameters; both parameters are positive real numbers. In these parameters of the gamma distribution, μ is the mean and 𝜿 is the ratio of mean to standard deviation; thus if 𝜿 < 1 then the relative spread of the distribution is less than that for a random distribution, indicating clustering.
In the special case 𝜿 = 1 the gamma distribution reduces to an exponential distribution with mean μ; such a distribution arises in the case of a Poisson random process of points along a line. So we can compute the difference [3] between the case 𝜿 = 1, the random scenario, and the actual empirical distributions for each amino acid. Additionally, for comparison we obtained data from a random simulation of a chain of length n = 10000 amino acids with relative abundance p = 0:5:
The analytic solution for the case when amino acids are chosen completely at random gave us a reference. Poisson case and the e_ects of the number n of amino acids in the chain and the relative abundance of each type [2]. In these reference cases the standard deviation was approximately equal to the mean spacing, increasing with sequence length and decreasing with abundance. So again we have a family of distributions contained approximately in a small neighbourhood around the exponential distributions, which have mean equal to the standard deviation, in the space of gamma distributions.
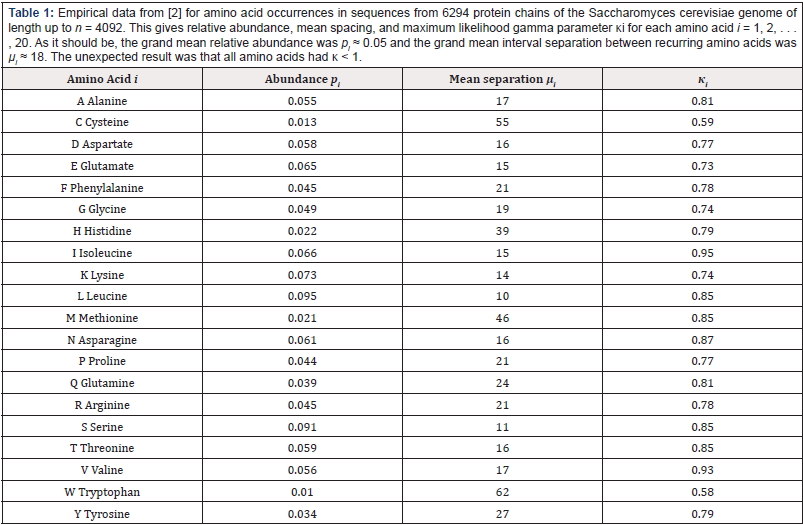
Intuitively, in real proteins with 20 types of amino acids distributed at different abundances along a chain, it might be expected that some would be more clustered (𝜿 < 1 ) and others would be more evenly spread (𝜿 > 1) compared to a Poisson process-which latter case would have exponential spacings and_ 𝜿 = 1. From a large database with mean spacing μi ≈ 18; the observed spacing distributions of the amino acids, though discrete of course, were all well approximated by gamma distributions [3], cf. [2] for details of goodness of fit. We might have expected that the 20 amino acids would have spacing distributions scattered more or less isotropically around the Poisson case, like that for a pseudorandom number generator [5. (Table 1) summarizes some 3 million experimentally observed occurrences of the 20 different amino acids within the Saccharomyces cerevisiae genome from the analysis of 6294 protein chains with sequence lengths up to n = 4092: Listed also for each amino acid are the relative abundances pi and mean separation μi ; the grand mean relative abundance was p ≈ 0:05 and the grand mean interval separation was μ ≈ 18: The gamma parameter range 0:59 ≤ 𝜿i ≤ 0:95; revealed that each amino acid was more clustered and so had higher variance of spacings than expected by chance (𝜿 = 1). Thus the fitted gamma distributions were all ‘L’ shaped rather than unimodal.
Table 1: Empirical data from [2] for amino acid occurrences in sequences from 6294 protein chains of the Saccharomyces cerevisiae genome of length up to n = 4092. This gives relative abundance, mean spacing, and maximum likelihood gamma parameter κi for each amino acid i = 1, 2, . . . , 20. As it should be, the grand mean relative abundance was pi ≈ 0.05 and the grand mean interval separation between recurring amino acids was μi ≈ 18. The unexpected result was that all amino acids had κ < 1.
Specifically, we found that maximum-likelihood estimates of parametric statistics show that all 20 amino acids tend to cluster (𝜿i < 1), some substantially, and so had greater variance than would result from a Poisson process. In other words, the frequencies of shorter gap lengths tends to be higher and the variance of the gap lengths is greater than expected by chance. This may be because localizing amino acids with the same properties may favour secondary structure formation or transmembrane domains [1].
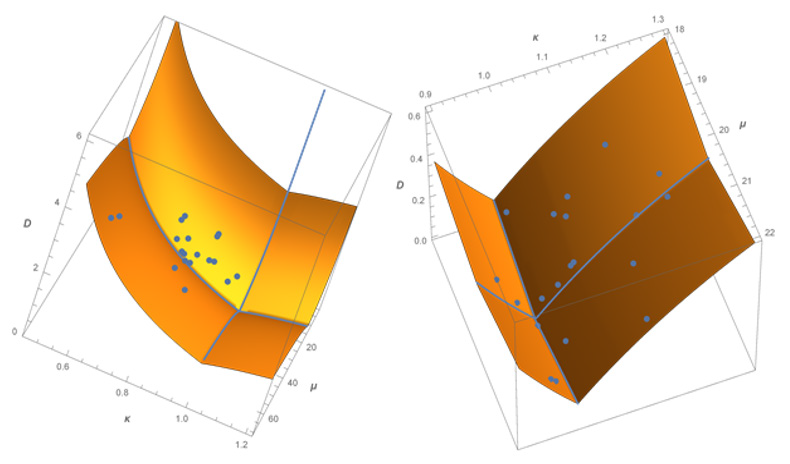
(Figure 1) represents the information distance in the space of gamma distributions for amino acids along the protein chains, measured from the Poisson case (𝜿 = 1) at the grand mean value μ = 18; with data points superimposed. This finding revealed and quantified an important qualitative property: a universal selfclustering that is stable over long sequences for all of these amino acids. The points in the right image represent the result of a random simulation for a chain of length n = 10000 with abundance p = 0:5. Unlike the empirical data, the points from random ordering of amino acids are as expected both above and below the random curve 𝜿 = 1.

Figure 1: Distances D in the space of gamma models, using a geodesic mesh [3]. The surface height represents upper bounds on distance D from the grand mean point (μ, κ) = (18, 1) of the Poisson random case. Depicted in the left image also are the 20 empirical data points for the amino acid sequences from a large database of 6294 proteins with sequence lengths up to 4092. All amino acids show clustering to differing degrees by lying to the left of the Poisson random case curve κ = 1. The points in the right image represent the result of a random simulation for a chain of length n = 10000 with abundance p = 0.5. Unlike the empirical data, the points from random ordering of amino acids are both above and below the random curve κ = 1.
The biological significance is yet to be elaborated but it is intriguing to consider the phenomenon as providing a long-range rule that acts as a check during DNA synthesis. Clearly, the maximum likelihood gamma distributions fit only stochastic features and in that respect view the data as exhibiting transient behaviour at small gap sizes; other methods are available for interpretation of such deterministic features and we concentrate here on representation of whole sequences as a stochastic process. Our approach contributes to the characterization of whole sequences by extracting and quantifying stable stochastic features. More detail concerning the data and further discussion is provided in [2] and [3].
We see that our analysis of the empirical data on amino acid ordering statistics reveals that there is a persistent self-clustering of amino acids along protein chains. Our result, though somewhat surprising, takes no account of the 3 dimensional structure of protein chains. Neidle [6] has given a new review of DNA structure from the crystallographic viewpoint. We know that the helical rate is about 10 base pairs per rotation. Clustering could arise from secondary structure [1,7]. One approach to structural statistics might be to look for correlations between pairs or groups of amino acids separated by specific distances along the helical structure.
References
- Neidle S (2021) Beyond the double helix: DNA structural diversity and the PDB J. Biol Chem 296:1-12.
- Cai Y. Dodson CTJ, Wolkenhauer O, and Doig AJ (2002) Gamma Distribution Analysis of Protein Sequences shows that Amino Acids Self Cluster. Journal Theoretical Biology 218(4): 409-418.
- Arwini K and Dodson CTJ (2008) Information Geometry Near Randomness and Near Independence. Lecture Notes in Mathematics New York Berlin Springer-Verlag.
- Amari SI (1985). Differential Geometrical Methods in Statistics. Berlin Springer Lecture Notes in Statistics 28, Springer-Verlag.
- Amari SI and Nagaoka H (2000) Methods of Information Geometry. Oxford American MathematicalSociety Oxford University Press 206.
- Dodson CTJ (2009) Information geometry for testing pseudorandom number generators.
- Penel S, Morrison RG, Mortishire Smith RJ and Doig AJ (1999) Periodicity in a-helix lengths and C-capping preferences. J Mol Biol 293(5): 1211-1219.


 We use cookies to ensure you get the best experience on our website.