Research Article 
 Creative Commons, CC-BY
Developing and Validating an HPLC Method for Related Substance of Camostat Mesilate in Bulk
*Corresponding author: Mujun Zhang, Tianjin Institute of Pharmaceutical Research Tianjin 30000, Research Unit for Drug Metabolism, Chinese Academy of Medical Sciences, Tianjin 30000, China.
Received: December 02, 2021; Published: January 03, 2022
DOI: 10.34297/AJBSR.2022.15.002085
Abstract
A simple, accurate, rapid, precise, robust, economical and reproducible stability indicating reverse phase high performance liquid chromatographic (RP-HPLC) method was developed and validated for the determination of related substance of Camostat mesilate in bulk. A stationary phase was used Waters X Bridge Shield RP18, 150mm×4.6mm column with 3.5μ particle dimension for separation, monitor and quantification. Mobile phase A (MP a) is a mixture of 0.05% Trifluelate acid and 0.25M Sodium Sulphate, Mobile phase B(MP b) is Acetonitrile. Elution was gradient mode with flow rate of 1.0ml/min. The validation was carried out as stated by CHP and ICH guiding principle. The calibration curves were linear (r2>0.9995) in the concentration range of 0.2045~4.478μg/ml for CM, 0.2947~3.000μg/ml for impurity A, 0.3538~3.025μg/ml for impurity E, 0.1920~2.619μg/ml for impurity B, 0.2878~4.200μg/ml for impurity C and 0.3538~3.025μg/ml for impurity D, respectively. The LOQ was 0.20μg/ ml for CM, 0.30μg/ml for impurity A, 0.35μg/ml for impurity E, 0.30μg/ml for impurity B,0.20μg/ml for impurity C and 0.20μg/ml for impurity D. the maximum R.S.D. (%) of the content of CE and its each impurity was 2.9% under the deliberate variations in method parameters. The developed procedure was applied to separated and determined the related substances of Camostat Mesilate.
Introduction
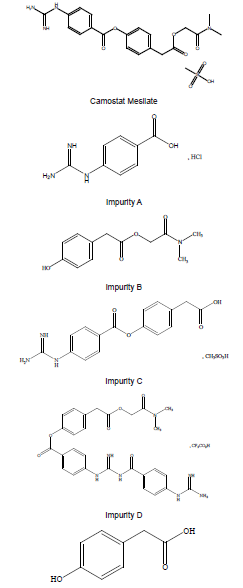
Camostat Mesilate (CM) is chemically N, N-Dimethylcarbamoylmethyl4-( 4-guanidinobenzoyloxy) phenylacetate monomethine sulfonate (Figure 1). CM is a synthetic inhibitor of various proteases and has been demonstrated to have a therapeutic effect in patients with chronic pancreatitis by inhibiting enzymatic autodigestion of the pancreas, and it has also been used to treat postoperative reflux esophagitis since 1994 [1-3]. SARS-coronavirus (SARS-CoV-2) can cause novel coronavirus disease (COVID-19). TMPRSS2isa serine protease, a critical protease, which helps the entry of COVID-19 into the target cell. CM is an inhibitor of TMPRSS2 and has shown to block the spread and pathogenesis of SARSCoV in a pathogenic mouse model, which would be expected to show similar effect in MERS-CoV [4,5].
Hoffmann, et al. found that CM blocks the entry of the virus into the lung cells [6]. Few methods to quantitatively estimate CM have already been pubilished. HU Lian-dong, et al., have developed a HPLC method for the determination of CM and its related subtances, this the only publication about the quality control of related substances of CM [7]. This method was conducted on a Venial XBP-C18 column (250 mm×4.6 mm,5 μm) with methanol- 10Mtetrabutylammonium hydroxide (25:75, adjusted to pH 3.5 with phosphoric acid) in a mobile phase at the flow rate of 1.0 ml/ min and the detection wavelength was set at 265 nm. However, method failed to completely separate the studied impurities.
AHPTLC method has been reported in JP XVII [8]. This paper was aimed at developing and validating stability indicating HPLC method to estimate related substances of CM in bulk. The method was validated by parameters such as linearity, accuracy, precision and robustness. Experimental design was used for validation to evaluate the robustness and intermediate precision (Figure 1).
Experimental
Chemicals and Reagents
Camostat Mesilate bulk drug (99.2% purity), Impurity C(98.4% purity) and Impurity D (98.2% purity) were all made available from TIPR (Tianjin Institute of Pharmaceutical Research ), Impurity A (99.7% purity) from J&K Scientific, Impurity B (99.2% purity) from Tokyo Chemical Industry, HPLC-grade Trifluoroacetic acid was obtained from Merck (Darmstadt, Germany), HPLC-grade Sodium 1-heptanesulfonate was supplied by Tokyo Chemical Industry, HPLC-grade acetonitrile was provided by the Concord company (lookchem China). Milli Q purification system was used to obtain HPLC grade water.
Instrumentation
Chromatographic analysis was carried out using a Agilent 1260- DAD liquid chromatography system (Agilent, USA) equipped with online degasser, quaternary pump, autosampler, column oven and diode array detector (Agilent, USA). To evaluate the performance in analyte separation, the following columns were tested: TC-C18 (150×4.6mm,5μm; Agilent), Zorbax SB-Aq (150×4.6mm,5μm; Agilent), Kinetex PFP (250×4.6mm,4μm;Phenomenex), Luna CN (150×2.0mm,3μm; Phenomenex) and RP-C18 (150×4.6mm, 3μm; Waters). The chromatographic separation was achieved using RP-C18 column with a mixture of 0.05% Trifluelate acid and 0.25M Sodium Sulphate as mobile phase A and Acetonitrile as mobile phase B, at a flow rate of 1.0ml/min in gradient mode. The elution program started with an acetonitrile content of 17%, which was linearly increased to 20% in 2min, hold for 6min, and that was increased to 35% in 7min, hold for 5min, and that was increased to 60%, hold for 5min and then returned to the initial conditions in 1min. The column was conditioned with mobile phases between runs for 40min. injection volume was set 10μL, and the column temperature was 35 ℃. Data acquisition was made from 190~400nm, while quantitation was carried out at 225nm and 265nm. All the mobile phases and solvents were filtered through nylon membrances (47nm, 0.22μm; Pall Company, USA) and sonicated during 15min. Water and Acetonitrile in the ratio 1:9 was used as the diluent for preparation of all solutions used in the method validation.
Preparation of Standard and Sample
The Impurity A stock solution was prepared by 1mg of Impurity A in 100ml solvent. The Impurity B, C, D, E stock solution were prepared as the same preparation method of impurity A stock solution. A mixture of standard solution was prepared by weighting CM and its related substances to yield a final concentration of 100% of CM and 1.0% of each Impurity A, Impurity B, Impurity C, Impurity D, and Impurity E with respect to the sample concentration of 1.0mg/ml.
Method Validation
Specificity
Specificity is the ability of methods to measure the analyte response in the presence of its potential impurities [9]. one of the significant features of HPLC is its ability to be free from interference. Specificity refers to the ability of the analytical method to differentiate and quantify the analyte in complex mixtures. An investigation is to be conducted during the determination of impurities and validation of identification tests [10]. Typically, for the related substance method for a drug product, degradation products are the most critical related substances. Therefore, as a minimum requirement, the method should have sufficient specificity to resolve the degradation products and the drug substance. So, the stress degradation studies are also a part of the specificity experiment, which should be conducted during the validation test.
System Suitability Test
System suitability test (SST)is used to verify that an analytical method was suitable for its intended purpose on the day the analysis was done. Some parameters which can be checked using the SST are Resolution, Plate Number, Tailing Factor, Repeatability.
Limit of Detection
The Limit of detection is the minumum concentration level of an analyte or substance that can be determined in a sample with a high degree of confidence during an analytical run. Typically, the LOD is observed to be in the area where the signal-to-noise ratio is greater than 3.
Limit of Quantitation
The limit of Quantitation (LOQ), or concentration at which quantitative results can be reported with a high degree of confidence, may likewise be determined by either approach [11]. It can be determined as a single to noise ratio 10: 1 or LOQ can be calculated at levels approximating according to the formula: LOQ=10 Standard Deviation (SD)/S, Standard Deviation is response based on either the SD of the blank, the residual SD of the regression lines or the SD of y=intercepts of regression lines. S=Slop of the linear regression [12].
Linearity and Range
Calibration curves in the analytical method is a linear relationship between concentration (independent variable) and response (dependent variable) using a least squares method [13]. Linearity solutions were prepared by serially diluting the stock solution to the required concentration levels for the related substance method. the linearity solutions were prepared at least five different concentration levels ranging from LOQ to 200% with respect to specification limits. The intercept, plot slope, Sum of squares of residuals, response factor and correlation coefficient provide the desired information on linearity.
Precision
The precision can have different meanings, depending on what level of variability is included. Repeatability is a short-term variable that includes contributions from the sample preparation, such as weighing, aliquoting, dilution, extraction, homogenization, and etc. Therefore, it is essential to apply the whole analytical procedure, rather that to merely inject the same sample solution six times [14]. Intermediate precision expresses “within laboratories” variations (eg., difference days, difference analysts difference reagent and difference equipment). The reproducibility is the third and final portion of precision testing [15]. It represents the precison between laboratories. Reproducibility is usually demonstrated by means of an inter-laboratory trial [16].
Accuracy
The accuracy of an analytical method is the closeness of the test results obtained by that method to the true value [17]. It is usually expressed as a percentage. It is recommended that accuracy should be determined using a minimum of nine determinations over a minimum of the three concentration levels, covering the specified range (3 concentrations/3 replicates each of total analytical procedures) [18].
Robustness
While precision assesses the typical variations in the normal operation of a procedure, robustness measures deliberate variations (e.g., flow rate +/- 20%, column lot, mobile phase composition, pH detector wavelength, sonication time, the column temperature). These changes can be studied individually or with an experimental design. By the way, robustness may be determined during development of the analytical procedure [19].
Solution Stability
The solution stability is the stability of a standard, sample, system suitability solution, mobile phases, reagents, etc. and analyzed as per specified method. During validation the stability of standards and samples is established under normal conditions, normal storage conditions, and sometimes in the instrument to determine if special storage conditions are necessary; for instance, refrigeration or protection from light [20].
Result
Method Development
Some difference kinds of mixtures in the mobile phase were tried for the analysis of the related substance of CM. Due to CM and impurity A, C and D, all contain the guanidine group and are not retained in RP-HPLC. so various ion pair reagents were added in the mobile phase. Sodium heptane sulfonate (0.4g), Sodium lauryl sulfate (0.05g) and Tetrabutyl ammonium bisulfate (1.2g) are all added in 290ml of water as to determine the related substances of CM, the resolutions between each compound include CM, Impurity A, C and D are very good and the retention of these compounds are very suitable. However, there is a lower sensitivity for impurity D in this elution system. So, a mixture of 0.05% Trifluelate acid and 0.25M Sodium Sulphate was selected.
Specificity
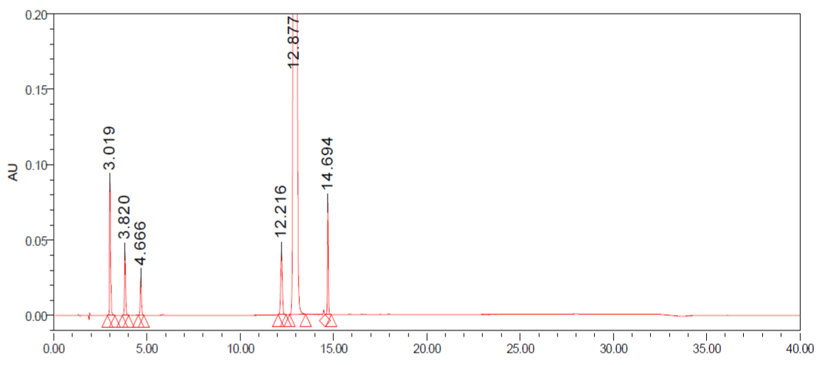
All individual Compounds are injected at a desired concentration (impurity A-10μg/mL, impurityB-10μg/mL, impurity C-10μg/ mL, impurity D-10μg/mL, impurity E-10μg/mL, CM-1.0mg/mL), Impurities are added to CM (a sample solution-1.0mg/mL) and injected into the HPLC system. the diluents did not interfere with any individual impurity (the unknown and known impurities). The results are shown in Table 1. The forced degradation of CM at a concentration of 1.0mg/mL was performed in different stress condition: acid, alkali, peroxide thermal and photostability. The results of the forced degradation of CM are summarized in Table 2. The chromatograms are given in Figure 2 (Table 1) (Figure 2).
System Suitability
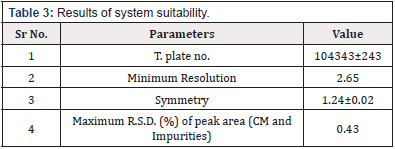
As the same operation in 4.2, the solution where the impurities were added in Sample silution (CM) was injected into HPLC system for 6 times. System suitability parameters were evaluated, and the values are shown in Table 3. These values are within given range mentioned in ICH guidelines. All the parameters were proved that the chromatographic system used was suitable for the analysis of CM (Table 3).
LOD and LOQ
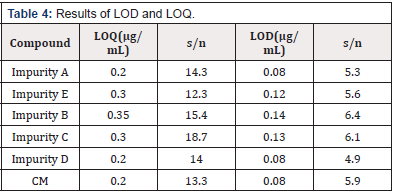
The LOD and LOQ values of impurity A, B, C, D, E and CM are shown in Table 4, It indicates the high sensitivity of the proposed method (Table 4).
Linearity and range
The Calibration curves of impurity A, B, C, D, E and CM are plotted using peak area against concentration. the concentration ranges of 0.2045~4.478μg/ml for CM, 0.2947~3.000μg/ml for impurity A, 0.3538~3.025μg/ml for impurity E, 0.1920~2.619μg/ ml for impurity B, 0.2878~4.200μg/ml for impurity C and 0.3538~3.025μg/ml for impurity D, respectively. The results are listed in [Table 5].
Accuracy
The sample solution was spiked with impurity stock solutions at three concentration levels corresponding to 50%, 100% and 150% of impurities at a specification level by multiple replicate preparations (n=3) of each concentration The percent recovery was calculated and listed in Table 6 [Table 6].
Precision
Using the 100% spiked solution (as in accuracy determination) by multiple replicate preparations (n=6) of the same sample. The intermediate precision of the method was checked by repeating studies on different days and different operator. The results in table 6 are between-day precision and within-day precison [Table 7].
Robustness
Under the deliberate variations in method parameters, the results had proven that the method is robust in Table 8 [Table 8].
Solution Stability
The Stability of standard solution and sample solution were tested at intervals at 2 hours. the stability of CM and impurities in solutions were determined by comparing the content of the freshly prepared solutions [21]. The R.S.D. (%) for the content results tested up to the 120 hours and CM revealing 0.23%, impurity A was 0.77%, impurity E was 1.2%, impurity B was 2.2%, impurity C was 0.9%, impurity D was 1.3%. the results indicated that the solutions were stable for 120 hours at ambient tempereture.
Conclusion
In the present work, a chromatographic method for the of CM and its related substanced was developed and validated. The method validation results had proven that the direct Reverse Phase-HPLC method can be applied for the routine analysis and quality control.
References
- Ashizawa N, Hashimoto T, Miyake T, Shizuku T, Imaoka T, et al. (2006) Efficacy of camostat mesilate compared with famotidine for treatment of functional dyspepsia: is camostat mesilate effective? Journal of Gastroenterology and Hepatology 21(4): 767-771.
- Gibo J, Ito T, Kawabe K, Hisano T, Inoue M, et al. (2005) Camostat mesilate attenuates pancreatic fibrosis via inhibition of monocytes and pancreatic stellate cells activity. Lab Invest 85(1): 75-89.
- Uno Y (2020) Camostat mesilate therapy for covid-19. Intern Emerg Med 15(8): 1577-1578.
- Rabaan AA (2017) Middle east respiratory syndrome coronavirus: five years later. Expert Rev Respir Med 11(11): 901-912.
- Zhou Y, Vedantham P, Lu K, Agudelo J, Carrion R, et al. (2015) Protease inhibitors targeting coronavirus and filovirus entry. Antiviral Res 116: 76-84.
- Hoffmann M, Kleine WH, Schroeder S, Nadine K, Tanja H, et al. (2020) SARS-CoV-2 Cell Entry Depends on ACE2 and TMPRSS2 and Is Blocked by a Clinically Proven Protease Inhibitor. Cell 181(2): 271-280.
- Lian DHU, Zhao LL, Ci L, Qian BX, Huan JL (2009) Rp-hplc determination of camostat mesilate and its related substances. Chinese Journal of Pharmaceutical Analysis 29(9): 1507-1509.
- The Japanese Pharmacopoeia Eighteenth Edition.
- Musirike MR, Hussain RK (2015) Development and validation of reverse phase-ultra performance liquid chromatographic method for estimation of related substances in febuxostat drug substance. Pharmaceutica Analytica Acta 6(10): 1-6.
- Panchumarthy R, Naga NCH (2015) A review on step-by-step analytical method validation. IOSR Journal of Pharmacy.
- Armbruster DA, Tillman MD, Hubbs LM (1994) Limit of detection (LQD)/limit of quantitation (LOQ): comparison of the empirical and the statistical methods exemplified with GC-MS assays of abused drugs. Clin Chem 40(7 pt 1): 1233-1238.
- Mohamad Taleuzzaman (2018) Limit of Blank (LOB), Limit of Detection (LOD), and Limit of Quantification (LOQ). Organic and Medicinal Chemistry international journal 7(5): 1-5.
- Moosavi SM, Ghassabian S (2018) Linearity of Calibration Curves for Analytical Methods: A Review of Criteria for Assessment of Method Reliability. Calibration and Validation of Analytical Methods - A Sampling of Current Approaches.
- Garcia PL, Quero JLV, Buffoni E, Gomes FP (2011) Analytical method validation. Chapters.
- Ahuja S, Dong MW (2005) Handbook of pharmaceutical analysis by HPLC. Separation Science and Technology.
- 2013 Validation of Analytical Procedures SC III F, British Pharmacopeia, British Pharmacopeia Commission.
- 2009 Validation of Compendial Procedures <1225>, The United States Pharmacopeia, 32nd, and The National Formulary, 27th Rev., Rockville, MD: The United States Pharmacopeial Convention Inc, I: 735.
- 2005 Validation of Analytical Procedures: Text and Methodology Q2(R1), ICH Harmonised Tripartite guidelines, International Conference on Harmonisation of Technical Requirements for Registration Of Pharmaceuticals For Human Use: 10.
- 2009 Validation of Compendial Procedures <1225>, The United States Pharmacopeia, 32nd, and The National Formulary, 27th Rev., Rockville, MD: The United States Pharmacopeial Convention Inc., I:738.
- Shrivastava A, Gupta VB (2012) Hplc: isocratic or gradient elution and assessment of linearity in analytical methods. Journal of Advanced Scientific Research 3(12): 12-20.
- Gupta P (2015) Method validation of analytical procedures. Pharmatutor 3(1): 32-39.


 We use cookies to ensure you get the best experience on our website.