Research Article 
![]() Creative Commons, CC-BY
Creative Commons, CC-BY
In-Use Stability Study of Paracetamol Original Brand of Oral Suspension: Simulated In-Home Storage Conditions
*Corresponding author: Adel AM Saeed, Department of Chemistry, Faculty of Science, University of Aden, Khormakser-Aden/ Yemen.
Received: September 07, 2022; Published: September 28, 2022
DOI: 10.34297/AJBSR.2022.17.002324
Abstract
Background: In-use stability refers to products in multi-dose containers that are at risk of losing their contents because of repetitive opening and closure.
Objectives: To determine the duration that multi-dose paracetamol (PCM) oral suspension may be used after the first dosage has been removed without affecting the product’s integrity.
Method: Original PCM samples (Panadol®) were chosen and stored in six different storage conditions that represent in-home storage conditions. The study was designed to simulate as closely as possible a real usage of the multi-dose container products for in-use stability assessment. Visual inspection and a pH meter were used to track the change in colour and pH values respectively. The stability was assessed using the UV spectroscopic method. The HPLC method was used to determine the presence of PCM impurities.
Results: The odor of all samples appeared to be acidic strawberry at the end of the study however, the pH values of all samples remained within the USP acceptable limit. Samples stored under refrigeration and kept within the outer carton experienced the least degradation. Calculated T90% was about 5.3 months in the most stable storage condition (condition A) and just (3.45 months) in the least stable one (condition F). PCM impurity, p-aminophenol (PAP), appeared in amounts exceeding the allowable BP limits (0.1%) in all samples except condition A.
Conclusion: The maximum in-use shelf life of the original brand PCM suspension was 5.5 months hence the use of PCM after that should be avoided.
Keywords: In-use stability, Storage conditions, Shelf life, Impurities, Paracetamol suspension
Introduction
Background information
Challenges with formulation and stability are encountered more with liquid dosage forms than solid products. Liquid dosage forms are essential pharmaceutical products that involve a mixture of active drug components and nondrug components (excipients). They are generally available in the multiple-unit container. The nature of liquid formulations in terms of added adjuncts such as sweetening, flavouring, suspending, and preserving agents makes the liquid formula a complex one that is very prone to physical, chemical, and microbiological instability. Moreover, the expiry date may be dramatically shortened after opening the bottle of drugs depending on storage and handling. So, drugs in the liquid form generally tend to have much shorter shelf lives than solid formulations [1]. Orally administered suspensions are among the preparations that are at the greatest risk of microbial contamination during consumption because of improper storage conditions, unhygienic handling, or repeated opening and closing [2]. Suspensions are categorized according to how they are made; oral suspensions are ready-to-use and do not require reconstitution at the time of dispensing and for oral suspensions, dried granules are supplied for suspension in filtered water [3]. Human medicinal product in-use stability testing relates to medicines in multi-dose containers that pose a danger to their contents owing to repeated opening and shutting. The goal of in-use stability testing is to determine if a multi-dose product may be used for an extended length of time while maintaining quality within an acceptable standard once the container is opened [4].
N-acetyl-para-aminophenol (PCM) is one of the most widely prescribed and used analgesics and antipyretics in the world. The medicine is widely accessible over the counter in a variety of dose forms, including solutions, suspensions, pills, capsules, and suppositories. Even small levels of undesirable substances can have an impact on the efficacy and safety of medicinal medicines The main impurity of PCM is P-aminophenol (PAP) substance and occurs in it because of both synthesis and degradation during storage [5-8]. PAP is a known neurotoxic [8] and can cause acute hepatotoxicity in mice [9]. The United State Pharmacopeia (USP) and British Pharmacopeia (BP) [10,11] set a maximum of 0.005% w/w of PAP in PCM substances (50ppm). This may vary depending on dosage forms and formulations. According to a monograph of PCM suspension in BP, PAP is limited to 0.1% [7]. In the literature, there have been few prior studies that examine and assess the in-use stability of PCM suspension and its impurities until now [12-16].
High-performance liquid chromatography (HPLC) is the most modern method used for the quantitative determination of PCM and separation of its impurities [17-19] but the fulltime availability of this instrument is restricted in the quality control laboratory - Aden. For this reason, UV-spectrophotometer was effectively used for the estimation of the PCM content in PCM suspension while HPLC was used for quantities determination of paracetamol’s impurities only. Since there is no study on the use of the UV method to estimate the PCM over interval periods, the UV method was validated according to the guidelines based on the International Council for Harmonization of Technical Requirements for Pharmaceuticals for Human Use (ICH) for the validation of analytical procedures [20]. This study aimed to estimate the maximum in-use shelf life and evaluate the impact of in-home storage circumstances on the physicochemical parameters of the original brand of PCM oral suspension maintained under varied storage conditions for several months.
Materials and Methods
Chemicals
PCM standard (99.5% purity, Globella Pharma, India), PAP standard (≥ 98% purity, Sigma-Aldrich, Italy).
Sodium hydroxide, methanol HPLC grade (99.8% purity), disodium hydrogen orthophosphate, sodium dihydrogen orthophosphate, tetrabutylammonium hydroxide. cellulose filter paper, 0.45μm pore size (Millipore, Bangalore), and distilled water.
Instruments
Ultra-violet (UV) spectroscopy: Scinco, model S-3100, Korean with software Lab Pro plus and 1cm quartz cell. High-performance liquid chromatography (HPLC): JASCO, model LC-Net II/ADC. UV/ VIS detector, model U.V-2070 plus. Quaternary gradient pump model P4-2089 plus. Colum oven model Co-2065 plus. ChromNav chromatography data software provided with the system. Ultrasonic bath (RoHS, model JP-031, China), electronic balance (RADWAG, model AS 220.B, Poland), pH meter (Adwa, model AD8000, Romania), vacuum pump (Jenway, model 8515, Engeland), and digital hygro- thermometer (Nimomed, SH-101, China. Accuracy: ±1C, ±5% RH).
Samples Collection and Distribution
Over the course of 18 weeks, eighteen samples of PCM oral suspension (125mg/mL) from the same batch were chosen and utilized in this investigation. It’s available as a ready-to-use suspension, which means it doesn’t need to be reconstituted. Table 1 shows the information about the samples (Table 1).

Table 1: Samples information about the original brand of PCM suspension.
These samples were stored in six distinct storage conditions to reflect the various in-home storage area in the city of Aden (Table 2). Using a digital hygro-thermometer, the temperature (T) and relative humidity (RH) of the different storage conditions were recorded daily to analyze the temperature of the different storage circumstances during the research period. To simulate the true condition of use, 0.5mL was taken from each sample of PCM suspension after the initial opening, according to their dose and frequency (six hours for three days and as needed).

Table 2: The six different storage conditions that represent the different in-home storage conditions.
Stability Study
Physical stability study:
a. Organoleptic and appearance inspection: Each sample’s colour, taste, and Odors were assessed at zero time and then again during the interval time of the stability study.
b. pH test: The sample was put into a beaker, and the pH meter’s electrode was immersed in it, with the result recorded at zero time. During the interval period of stability evaluation, the pH test was repeated.
Chemical Stability Study
Estimation of drug content using the UV method: Drug content was estimated at zero time and then every two weeks after the initial opening of the container.
Determination of the wavelength of maximum absorption: 0.12g of PCM standard was carefully weighed and diluted in a volumetric flask (200mL) with 50mL of NaOH (0.1M), followed by distilled water to the volume. One mL of the dilute solution was placed into a volumetric flask (100mL) containing 10mL of 0.1M NaOH and filled to the volume with distilled water to get a solution with a concentration of 6μg/mL. The solution was scanned in UVvis range between 200 and 400nm [21, 22].
Calibration method: 0.01g of PCM standard was carefully weighed and diluted in 100mL of NaOH (0.1M) to make a standard stock solution. This produced a 100μg/mL stock solution. After that, dilutions with 0.1M NaOH were used to achieve concentrations of 1, 2, 3, 4, 5, 6, 7, 8, and 9μg/mL of PCM standard [22].
Preparation of the sample for the UV method: 5mL of PCM suspension were transferred to a volumetric flask (200mL) containing 50mL of 0.1M NaOH, diluted with 100 millilitres of water, shaken for 15 minutes using an ultrasonic bath, and finished to the final volume with distal water. To generate a solution with a concentration of 6μg/mL, onemL of the diluted solution was transferred to a volumetric flask (100mL) containing 10mL of 0.1M NaOH and filled to the final volume with distilled water [21,22]. The absorbance was determined using a 10mL the same sodium hydroxide solution and 90mL of distilled water as a blank. The readings were taken three times. The concentration of PCM was determined using the calibration curve’s regression equation.
Validation of the UV spectroscopy method: The UV method was validated using the following parameters in accordance with the ICH Guidelines [20]. For linearity, PCM standard solutions at nine concentrations (1-9μg/mL) were used to assess the UV method’s linearity in triplicates. On the nine concentrations, regression analysis was used to produce the calibration equation and correlation coefficients. The Limit of Detection (LOD) is the lowest concentration of a substance that can be detected while the lowest concentration of a substance that can be measured with sufficient precision and accuracy is known as the limit of quantitation (LOQ). Using the standard deviation of the response and the slope of the calibration curve, the LOD and LOQ for PCM were determined from the linearity data.:
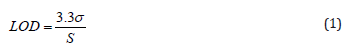
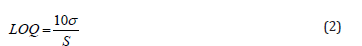
where S is the slope of the calibration curve and σ is the standard deviation of response.
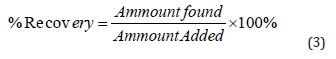
The method’s accuracy was verified by spiking a known quantity of standard into a previously tested sample (6μg/mL) in triplicate at three distinct concentration levels (80-120 percent) of the target concentration (a recovery study). The equation was used to compute the percentages of recovery [23].
Repeatability and intermediate precision experiments were used to confirm the method’s precision. Six repeated samples of PCM standard solutions at 6μg/mL were performed throughout one day under identical conditions to establish the method’s repeatability (intra-day precision). The intermediate precision (inter-day) was determined by testing standard PCM solutions at three distinct concentrations of 3, 6, and 9μg/mL three times a day for three consecutive days. The relative standard deviation was used to represent the results for each type of precision (%RSD).
Study of drug’s kinetics: The % content of PCM in each sample was converted to the proper concentration terms needed to create line graphs for zero, first, and second orders to analyze the kinetics of PCM breakdown in the samples. Plotting the concentration terms versus time yielded the line graphs. The product’s shelf life was determined to be T90%, which is the time it takes PCM to lose 10% of its initial concentration. The reaction order was used to compute the shelf life [24].
PCM relates substance assay using HPLC method: PAP was analyzed using the BP 2013 HPLC method for PCM-related compound testing [11], with some adjustments to the column size, flow rate, and injected volume. PAP concentration in PCM suspension was calculated at zero-day, 8, and 18 weeks after the bottle was first opened.
a. Chromatographic condition: Reverse-phase chromatography with isocratic elution at a flow rate of 1.0mL/min was used to produce chromatographic separation. Chromatographic analysis was carried out on a 15 x 0.45cm, 5μm particle size octadecyl-silica (C18) column. The mobile phase was made up of a 1:3 combination of methanol and orthophosphate. A UV-Detector with a wavelength of 245 nm was used to monitor the eluent. The column was kept at room temperature, and the sample solution and mobile phase were injected using a manual injector with a 20μL loop. Prior to use, the mobile phase was filtered with a Millipore 0.45μm membrane filter and degassed with an ultrasonic bath.
b. Preparation of the mobile phase: 1.15g of 40 % w/v tetrabutylammonium hydroxide solution in 250mL of methanol. 375mL of 0.05M disodium hydrogen orthophosphate and 375mL of 0.05M dihydrogen orthophosphate were combined, filtered through a 0.45μm millipore filter before use, and degassed for 15 minutes in an ultrasonic bath.
c. Preparation of the standard solution of PCM: A stock solution (0.1%w/v) was prepared by dissolving 0.025g of PCM standard in 25mL of the mobile phase. 0.3mL of the standard stock solution was transferred to a 100mL volumetric flask and diluted to volume with the mobile phase (0.0003% w/v).
d. Preparation of the standard solution of PAP: 0.025g of PAP standard was accurately weighed and put into a 25 volumetric flask. After adding 20mL of mobile phase, the solution was sonicated for 5 min before being filled up with mobile phase to make a stock solution (0.1%w/v). Transferring 0.3mL of the stock solutions into a 100mL volumetric flask and diluting to volume with mobile phase (0.0003% w/v) yielded the working solution.
e. Preparation of the solution with mixed standards: Transferred 0.3mL of each standard stock solution of PCM and PAP into 100mL volumetric flask and diluted to volume with mobile phase (0.0003 %w/v).
f. Preparation of calibration curve of PAP: From the working standard solution of PAP (0.0003 %w/v), serial dilutions of 0.09, 0.12, 0.24, 0.36, 0.48, 0.6, 0.72, 0.84, 0.96, 1.08, and 1.2μg/ mL were prepared by taking 0.75, 1, 2, 3, 4, 5, 6, 7, 8, 9, and 10mL of solution respectively and made up to 25mL with mobile phase for calibration study in triplicate. The responses were measured as peak areas and the calibration curve was constructed by plotting the mean peak area against the corresponding drug concentration.
g. Preparation of the samples for the HPLC method: 12.5mL of PCM suspension (120mg/5mL) was dissolved in 4mL of mobile phase, then diluted to 100mL with mobile phase and sonicated for 15min. One mL of this solution was diluted to 25mL with the mobile phase to produce a 0.012 %w/v solution (120 μg/mL). A 0.45 μm Millipore filter paper was used to filter the fluid. The linear equation of the PAP calibration curve was used to calculate the concentration of PAP in samples. The following formula was used to compute the percentage of PAP:
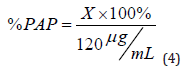
where X is the concentration of PAP (μg/mL) obtained from the linear equation and 120 μg/mL is the final concentration of PCM solution for the HPLC method.
Statistical Data
Data were analyzed using Statistical Package for the Social Sciences (SPSS, version 23). One-way repeated-measures analysis of variance (ANOVA) was used to determine the significance of differences related to storage conditions. Differences were considered significant at P-values < 0.05.
Results
Storage Conditions

Table 3: Temperature and relative humidity record of storage conditions.
Table 3 shows the results of temperature and humidity observations under various storage conditions. The range of temperatures/ relative humidity in the refrigerator during the period of study (April -August) was 9.57-15.72℃/ 63.96-81.35RH while in the room with air-conditioning, the range was 26.23-29.37℃ /50.59-64.19 RH. In the cupboard at room temperature, the range was 31.05-33.24℃ /57.92-68.50 RH (Table 3).
Physical Stability Study
The colour and taste of the samples did not change during storage, although the odor of all samples seemed to be acidic strawberry after the 12th week (Table 4). Particle aggregation appears in all samples at the end of the study period.

Table 4: The organoleptic and appearance inspection of PCM samples stored under various storage conditions.
Chemical Stability Study
λmax of standard PCM: The study of the spectrum revealed that PCM shows a well-defined λmax at 257nm using 0.1MNaOH, (Figure 1).

Figure 1: UV spectrum of 5μg/mL PCM in standard solution.
Calibration curve of standard PCM: The calibration curve was done in triplicate by plotting absorbance vs. different concentrations of standard PCM. The result (Figure 2, Table 5) is linear (eq. 5) in concentrations ranging from 1 to 9μg/mL and the correlation coefficient (R2) was 0.9998.
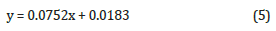

Figure 2: Calibration curve of pure PCM.

Table 5: Parameters of calibration curve of paracetamol.

Table 6: Assay test results for PCM samples kept within the outer carton under various storage conditions.
Note*: Wight to volume percent mean (three times repetition) ± standard deviation.
Estimation of drug content: (Tables 6, 7) show the results of the assay test as mean percentage concentration versus time of sampling of PCM stored under various storage conditions and kept within and outside the outer carton, respectively. The results indicated that at the start of the study, all samples kept under varied storage settings passed the assay content test (B.P, 95 %-105%). Following that, during the study, all samples showed a decrease in their percentage concentrations at different rates. As shown in (Table 7) below, PCM samples stored in conditions A and C retained 90% of their label concentration (T90%) for 18 weeks, but those stored in conditions E exhibited more than 10% degradation during the same period. PCM samples stored under condition B maintained 90% of their label concentration for 18 weeks, but those under conditions D and F showed more than 10% degradation at weeks 18 and 14 respectively as shown in (Table 7).

Table 7: Assay results for PCM samples stored under various storage conditions and kept without outer carton.
Even though the degradation rates were minor across the research period (Figure 3), these small changes were statistically significant. The significance of differences in the influence of temperature and light conditions on the rates of degradation of PCM samples was determined using a one-way repeated-measures ANOVA. P-values less than 0.05 were considered significant. There were significantly different results of rate degradation of PCM samples in each storage condition. Samples stored under condition A had the largest P-value and less degradation rate. The decrease in P-value indicates a strong significance difference from results obtained under other conditions. (Figure 3) shows the percentage breakdown of PCM samples under various storage conditions. The figure shows that samples stored in condition A have the lowest amount of degradation (8.28%), while those stored in condition F have the most degradation (12.14 %).

Figure 3: Percentage degradation of PCM samples under various storage condition studies.
Study of the Drug’s Kinetics:
The concentrations of PCM in the suspensions were altered to concentration terms that fulfilled zero order, first order, and second order rates of reaction for the kinetics study of PCM breakdown in the samples (Table 8).
The concentration terms were plotted against the corresponding assay periods to generate a line graph for a specific order of the reaction. This was done for zero, first and second orders for all samples stored under all six storage conditions. The correlation coefficient (R2) and the slope, k, which is the reaction rate constant, were calculated for each line graph drawn for all orders of reaction (Table 9). The R2 indicates the degree of correlation between the y-axis and the x-axis values. The greater the correlation and the more linear the graph, the higher the R2. On the other hand, the lower the R2, the lower the relationship and the less linear the graph appears [25]. The reaction order graph for each sample for all the storage conditions that gave the highest values for R2 (i.e., the most linear graphs) was chosen to give the order of degradation of the PCM sample. Conversely, the smaller the R2, the smaller the correlation and the less linear the graph [26].

Table 8: Rates of reaction values for PCM suspension under the various storage conditions.

Table 9: Data obtained from the reaction order graph for oral PCM suspension stored under the various storage conditions.
Degradation of PCM samples kept within their outer carton (conditions A, C, and E) generally followed a zero-order pathway because the highest R2 values were seen for zero-order except for samples stored under condition E which followed a second-order pathway since it generally gave the highest R2 for the second order. Hence comparing the zero-order rate constant (k) values for the three storage conditions in (Table 9), it was observed that the k value for storage condition A was the least, followed by that for condition C while storage in condition E gave the highest value. The higher the value of k, the faster the degradation and the least stable the product whereas a small value of k means a slow rate of degradation hence a stable product.
On the other hand, degradation of PCM kept without their outer carton (conditions B, D, and F) was via a second-order pathway because it gave the highest R2 values except for sample storage under condition B followed the zero-order pathway. Comparing the second- order rate constant values for the three storage conditions in (Table 9) shows that, the k value for storage under condition B was the least, followed by that for condition D while storage in condition F gave the highest value. Shelf life was estimated from k values associated with the best fitted zero-order equation for PCM suspensions kept within their outer carton and the second-order equation for PCM suspensions kept without their outer carton.
Validation
The UV method exhibited a linear response to PCM in the concentration range of 1-9μg/mL, with a correlation value (R2) of 0.9998 (Figure 2). Using the relative standard deviation of the response and the slope of the calibration curve, the limit of detection and the limit of quantitation were derived from the linearity data. LOD and LOQ values of PCM were found to be 0.109μg /mL and 0.332μg/mL respectively. Low LOD and LOQ indicate a good sensitivity of the proposed method. The PCM was recovered in the range of 99.79 to 100.00 % for various concentrations as shown in (Table 11). The recovery study indicates that the method is accurate for the quantitative estimation of PCM suspension during interval periods since the statistical results were within the acceptance range (100±2%).

Table 11: Results of accuracy studies (n=3).
The precision of the method was verified by repeatability (intra- day precision), and intermediate (inter-day precision). A typical statistical method was used to evaluate the results, which included the computation of SD and RSD. (Tables 12, 13) show the precision results, indicating that the method was precise.
Estimation of the Presence of Impurities (PAP) in the PCM Samples Using HPLC Method pap’s calibration curve was established by plotting peak area versus concentrations of PAP. The result was linear (R2 = 0.9994) and described by the following equations:

where y is the peak area and x is the concentration in μg/mL. The calibration curve of PAP is given in Figure 4. The values of LOD and LOQ were observed to be low, and it indicated good sensitivity of the HPLC method. This determination measures the smallest concentration of PAP that can be detected (LOD) or quantified (LOQ). Parameters of the calibration curve of PAP are in (Figure 4), (Table 14).

Figure 4: Calibration curve of PAP standard.

Table 12: Result of repeatability precision studies.

Table 13: Result of intermediate precision in three consecutive days.

Table 14: Parameters of calibration curve of PAP.
The retention time (RT) of PCM and PAP standards during estimation of the presence of PAP in PCM samples stored under various storage conditions over 18 weeks are given in (Table 15).

Table 15: The RT of PCM and PAP standards.
Chromatogram of mixed standards solution at the zero time was shown in (Figure 5). The chromatogram showed two peaks, one corresponds to PAP with RT 2.542 min, and the second peak correspond to PCM with RT 3.875 min. The resolution factor between PCM and PAP peaks was 6.142. The BP monograph of PCM suspension [11] states that the resolution factor between peaks of standards is at least 4. The separation of the two standards depends on their polarity, the more polar p-aminophenol standard elutes first then the PCM standard. The Retention Time (RT) for paracetamol, PAP, and mixed standards solution was determined at each time of sample analysis. The RT is no fixed property of a component in chromatogram therefore, it was inconstant and vary during the interval of study for both standards [27], (Figures 5).

Figure 5: Chromatogram of the mixed standard; PAP at 2.542 min and PCM at 3.875min.
PCM relates substance assay for samples stored under various storage conditions from zero time to week 18 are summarized in Table 16. At zero time, no peak corresponding to PAP was shown in the chromatogram of the related substances at this time for all samples. After the 8th and 18th weeks, there were peaks corresponding to PAP in the chromatogram for all samples except samples stored under conditions. PAP content in PCM has been restricted by the USP and BP [10,11]. PAP is limited to 0.1% in the BP [11] PCM suspension monograph. 0.1 % represented 0.12g/mL in this investigation.
In the case of samples stored within the outer carton, the findings in (Table 16) revealed that no PAP was found at zero time for all samples. PAP was identified in all samples in quantities exceeding the allowed BP limits at weeks 8 and 18, excluding those stored under condition A. No PAP was discovered at zero time for all samples that were stored without the carton. PAP was found in all samples in the 8th week. It was 0.07% in samples stored in condition B, which was less than the BP limit, 0.10 % in samples stored in condition D, and more than the limit in samples stored in condition F (0.40 %). PAP was detected in all samples more than the allowed BP limits in week 18.

Table 16: PCM relates substance assay for samples stored under various storage conditions.
The content of PAP as a percentage in PCM samples stored under various storage conditions and kept within and without the outer carton is shown in (Figures 6,7), respectively

Figure 6: The content of PAP as a percentage in PCM samples stored under various storage conditions; A, B and C.

Figure 7: The content of PAP as a percentage in PCM samples stored under various storage conditions; B, D, and F.
Discussion
In most households, medicines are kept for various purposes including emergency use and treatment of chronic or acute illnesses. These medicines are either prescribed by health professionals or obtained over the counter in the communities [28]. Medicines can expire/deteriorate rapidly on improper storage decreasing their effectiveness and also produces toxic substances. Appropriate storage of medicines is necessary to confirm their effectiveness and potency along with physical integrity.
In this study, the temperature in all storage settings was greater than that recommended by USP [10] and the humidity in the refrigerator was higher. This might be due to Aden’s hot desert climate, which is classified as BWh according to the Köppen-Geiger climate classification system. Throughout the year, it is hot and humid [29]. Furthermore, Aden has a major problem with power interruptions, which causes the temperature of the refrigerator to fluctuate between 9.57-15.72°C, surpassing the USP definition of refrigerator temperature (2-8°C).
The pH findings for samples in all storage conditions were within the USP [10] acceptability limit (4-6.9) at the beginning and throughout the duration, as shown in Table 4. The results revealed that samples stored under condition A changed by just 0.17 from zero time, which was the smallest shift compared to samples stored under other conditions. The pH reduction may be due to by-products of microbial contamination (e.g. lactic acid which make vinegar fermentation) that causes a change in the pH of liquid drug preparations [30]. Moreover, PCM degrades slowly forming a mixture of contaminants, such as p-aminophenol and acetic acid which may respond to the reduction in pH values [31] and this may indicate further change may occur under improper storage conditions. The suspensions were judged to be stable if the components maintained at least 90% of the label concentrations. It was generally observed that samples stored under refrigeration (conditions A and B) experienced the least degradation, followed by those stored at the room with air-conditioner (conditions C and D) while the samples kept in a cupboard at room temperature (conditions E and F) were the least stable. This study supports the findings of Abdelazim et al. [13] who found that PCM maintained at varying temperatures (8°C, 30°C, 40°C, and sunlight) showed minimal variations in PCM concentration over four weeks. The stability of PCM pediatric oral suspension in simulated in-home storage settings at temperatures ranging from (30°C/65RH) simulating room temperature revealed that as the storage time grew, degradations began to occur [32].
The evidence in Figure 3 was that the PCM samples were affected by changes in light conditions. Samples kept within the outer carton (conditions A, C, and E) had the smallest degradation than those kept without the outer carton (conditions B, D and F). Photodegradation of PCM has been reported by [33,34]. They stated that PCM is photoresist to sunlight and UV irradiation in dry form. However, the Summary of product characteristics and patient information leaflet of PCM advises protecting the container of PCM from light and keeping it in the outer carton since the nature of liquid formulations in terms of added adjuncts such as sweetening, flavouring, suspending, stabilizing, and preserving agents makes the liquid formula a complex one that is very prone to physical, chemical and microbiological instability [4,35].The shelf life of the unopened container of original PCM samples used in this study was 36 months (from 3/2016 to 3/2019) as mentioned in Table 1. This study started in April 2018, which means the remaining shelf life was 11 months from the beginning of the study. However, the results of this study showed that the maximum estimated shelf life of the PCM samples stored under condition A was about 21.27 weeks (5.3 months) only from the start of the study. The values of T90%, clearly ensure the role of temperature changes and light on the degradation rates of the drug.
The recent work was intended to determine the content of PAP in PCM pediatric oral suspension samples stored under simulated in-home storage conditions for 18 weeks and results showed that as the storage period increased, degradations start to take place. PAP may be formed by hydrolysis during the storage of preparation [36,37]. Adverse effects due to the formation of minor degradation products during storage have been reported [38]. It was reported that PAP may cause nephrotoxicity and teratogenicity; therefore, its amount should be strictly controlled [7].
Conclusion
In-use stability testing was developed to mimic how a completed pharmaceutical product would be used in the reality. The stability of PCM suspension (120mg/5mL) decreases with time. Samples kept within the outer carton (conditions A, C and E) generally had the smallest degradation. The refrigerator is an appropriate storage condition for keeping the medicine in Aden city. PAP started to appear in most samples as the storage duration prolonged, and in concentrations that exceeded the allowable BP limits (0.1%).
Acknowledgement
The authors would like to thank the Supreme Board of Drug & Medical Appliances, Aden for using their facility to complete this work.
References
- Huba Kalász, István Antal (2006) Drug excipients. Current Medicinal Chemistry 13(21): 2535-2563.
- Nyarko Sefah, Nana Y (2017) Standardisation of Oral Liquid Ibuprofen suspension for improved stability and efficacy Thesis p7-10.
- Bhandare SP, Yadav VA (2017) A REVIEW ON “DRY SYRUPS FOR PAEDIATRICS”. Int J Curr Pharm Res 9(1):25-31.
- CPMP E (2001) Committee for Proprietary Medicinal Product. Note for guidance on in-use stability testing of human medicinal products CPMP: QWP/2934/99 pp.1-2.
- Dejaegher B, Bloomfield MS, Smeyers VJ, Vander HY (2008) Validation of a fluorimetric assay for 4-aminophenol in paracetamol formulations Talanta 75(1): 258-265.
- Németh T, Jankovics P, Németh Palotás J, Kőszegi Szalai H (2008) Determination of paracetamol and its main impurity 4-aminophenol in analgesic preparations by micellar electrokinetic chromatography. J Pharm Biomed Anal 47(4-5):746-749.
- Sornchaithawatwong C, Vorrarat S, Nunthanavanit P (2010) Simultaneous determination of PCM and its main degradation product in generic PCM tablets using reverse-phase HPLC. J of Health Res 24(3): 103-106.
- Khandavilli UR, Keshavarz L, Skořepová E, Steendam RR, Frawley PJ, et al. (2020) Organic Salts of Pharmaceutical Impurity p Aminophenol Molecules 25(8): 1910.
- E Wyszecka Kaszuba, M Warowna Grześkiewicz, Z Fijałek (2001) Determination of 4‐aminophenol impurities n selected Acta Pol Pharm 58(5): 325-329.
- Rockville MD (2007) US Pharmacopoeial Convention Inc USA U. P. USP30-NF25.
- B P (2013) British Pharmacopoeia Volume III Monograph on Pediatric Paracetamol Oral Suspension Her Majesty’s Stationary Office London UK.
- Dahn I J R, Van T, Westminster N (1990) United States Patent. Patent Number: US5998963A 2(19):1-7.
- Abdelazim OA, Ali RS, Eissa RA (2016) In-Use Stability Study of PCM Syrup Sudan University for Science and Technology Thesis.
- Zaid A N (2016) Extemporaneous compounding and stability evaluation of paracetamol-honey based syrup for pediatric use A J of Pharm 10(3).
- Ulfa DM and Irawan D (2019) Assay of paracetamol syrup in different storage temperatures by high performance liquid chromatography. J Teknol Dan Sent Keseh 10(1): 72-80.
- Adi AH, Johari H, Sibai S (2020) The mixing process in the production of paracetamol suspension and its stability. Int j of Eng Bus Manag 4(3): 51-56.
- Youssef SH, Mohamed D, Hegazy MAM, Badawey A (2019) Analytical methods for the determination of paracetamol pseudoephedrine and brompheniramine in Comtrex tablets. BMC Chem 13(78): 1-15.
- Vu Dang H, Truong Thi TH, Dong THL, Nguyen MH (2020) RP-HPLC and UV spectrophotometric analysis of paracetamol ibuprofen and caffeine in solid pharmaceutical dosage forms by derivative fourier and wavelet transforms: a comparison study. J Anal Methods Chem: 8107571.
- Almurisi HS, Al Japairai K, Alshammari F, Alheibshy F, Sammour RM, et al. (2022) Stability of Paracetamol Instant Jelly for Reconstitution: Impact of Packaging, Temperature and Humidity. Gels 8(3): 144.
- (2005) ICH, “International conference on harmonization of technical requirements for registration of pharmaceuticals for human use, ICH harmonized tripartite guideline,” in Validation of Analytical Procedures: Text and Methodology Q2(R1), ICH, Geneva, Switzerland.
- Al Kaf AG, Alghalibi SM, Edrees WH (2015) Microbial and physicochemical assays of paracetamol in different brands of analgesic syrups sold in Sana’ a City-Yemen. J Pharm Pharmacognosy Res 3(1): 6-12.
- Shah S, Desai DG, Seth A, Patel R (2015) Process Validation of Paracetamol Suspension. An j Phar Sci Mon 6(2): 299-308.
- Behera S, Ghanty S, Ahmad F, Santra S, Banerjee S, et al. (2012) UV-Visible Spectrophotometric Method Development and Validation of Assay of Paracetamol Tablet Formulation. J Anl Bio Tech 3: 151-157.
- Jain G, Khar RK, Ahmad FJ (2011) Theory and Practice of Physical Pharmacy E Book. Elsevier Health Sciences pp.420.
- Asuero A, Sayago A, Gonzalez A (2006) The Correlation Coefficient: An Overview. Crit Rev in Anal Chem 36(1): 41-59.
- Florence AT, Attwood D (2015) Physicochemical Principles of Pharmacy: In Manufacture, Formulation and Clinical Use. Pharm press.
- Letter WS (2015) Common Reasons for HPLC Retention Time Drift Variation or Change.
- Ocan M, Bbosa GS, Waako P, Ogwal OJ, Obua C, et al. (2014) Factors predicting home storage of medicines in Northern Uganda. BMC Public Health 14(1): 650.
- Peel MC, Finlayson BL, Mc Mahon TA (2007) Updated world map of the Köppen-Geiger climate classification. Hydrol Earth Syst Sci 11(5): 1633-1644.
- Sudeshika ST, Panagoda GJ, Tennakoon IK (2010) A preliminary study to evaluate the microbiological quality of paediatric oral liquid drug formulations during consumption. Int j Sci Rec 4(9): 2250-3153.
- Ayyash F, Kamis M, Khalaf S, Thawabteh A, Karaman R (2015) Removal of aspirin salicylic acid PCM and p aminophenol by advanced membrane technology activated charcoal and clay micelles complex. Case Stud J 4 (5): 74-111.
- Huynh Ba K (2009) Handbook of Stability Testing in Pharmaceutical Development: Regulations Methodologies and Best Practices. Springer Sci.
- Kawabata K, Sugihara K, Sanoh S, Kitamura S, Ohta S (2013) Photodegradation of pharmaceuticals in the aquatic environment by sunlight and UV-A, -B and -C irradiation. J Toxicol Sci 38(2): 215-223.
- Sokół A Borowska K, Karpińska J, (2017) Investigating the influence of some environmental factors on the stability of paracetamol naproxen and diclofenac in simulated natural conditions. Pol J Env Stu 26(1): 293-302.
- Obitte N, Chukw A, Odimegwu D, N Woke VC, (2009) Survey of drug storage practice in homes hospitals and patent medicine stores in Nsukka Nigeria. Sci Res Essay 4(11): 1354-1359.
- Roy J (2002) Pharmaceutical impurities A mini review. AAPs Pharm Sci Tech 3(2): E6.
- Khosroshahi AM, Aflaki F, Saemiyan N, Abdollahpour A, Asgharian R (2016) Simultaneous determination of paracetamol 4-aminophenol 4-chloroacetanilid benzyl alcohol benzaldehyde and EDTA by HPLC method in PCM injection ampoule. J Pharm & Health Sci 4: 61-69.
- Tonnesen HH (2004) Photostability of Drugs and Drug Formulations2nd (Edn). CRC Press: pp.448.


 We use cookies to ensure you get the best experience on our website.