Review Article 
 Creative Commons, CC-BY
Fall Prediction Using Machine Learning - A Systematic Review
*Corresponding author: Vivek Vijay, Mathematics Department IIT Jodhpur, India 342037.
Received: May 17, 2023; Published: May 25, 2023
DOI: 10.34297/AJBSR.2023.18.002537
Abstract
The primary objective of this study is to conduct a thorough analysis of fall prediction methods that make use of Machine Learning techniques. In this study, a total of 115 articles are analysed using the Preferred Reporting Items for Systematic Reviews and Meta- Analyses (PRISMA) approach out of which 15 articles, published between 2010-2022, have been shortlisted for a detailed analysis. A six-step process of analysis is summarized in the form of a system overview. We discuss some of the advantages and shortcomings of the underlying machine learning algorithms, used for fall prediction by different researchers.
Keywords: Aging, Elderly, Frailty, Physical health
Mathematics Subject Classification (2020): MSC code1, MSC code2, and more.
Abbreviations: ML: Machine Learning; MLA: Machine Learning Algorithm; AUC-ROC: Area Under Curve and Receiver Operating Characteristic; LR: Logistic Regression; DT: Decision Tree; SVM: Support Vector Machine; RF: Random Forest; KNN: K-Nearest Neighbour; NB: Naive Bayes; BN: Baysien Network; ANN: Artificial Neural Network; CHAID: Chi-Squared Automatic Interaction Detector; GBT: Gradient Boosting Tree; MLP: Multilayer Perception
Introduction
The worldwide population of old age people (over 60 years) forcast to reach to 21% by 2050 [1]. The elderly wants to live longer and also maintain quality of life. However, several structural and functional changes occur during the aging process, such as loss of muscle mass, muscle strength, balance, and flexibility [2]. This increases the probability of falls and fall related injuries. Falling is one of the causes of chronic disability [3]. One of the solutions to this problem is timely prediction of fall. Due to increasing availability of data, various machine learning technologies are used to forecast the possibility of fall. It is believed that the implementation of fall prediction technologies has the potential to improve the quality of life for older adults by reducing the incidence of falls and associated injuries [4]. Machine learning algorithms can detect risk factors and predict the probability of fall by examining large databases of patients or Electronic Health Record (EHR) data [5]. This may assist healthcare professionals in creating preventative and treatment approaches that are more successful. In order to detect movement patterns, that can result in falls, machine learning algorithms are used to assess data from a variety of sources, including video cameras, images, motion sensors, and wearable technology [3]. With this data, the algorithms can predict the possibility of a fall and notify carer or emergency personnel in real-time. Gait speed, balance, and the presence of specific medical disorders are among prominent characteristics utilised in these machine learning models.
In order to increase accuracy, machine learning models also include data driven approaches like Electronic Health Record (EHR) data, Time Up and Go (TUG) Assessment, Questionnaire data etc. Thus, machine learning-based fall prediction has the potential to save healthcare expenses related to falls and improve the quality of life for elderly. This article focuses on analyzing fall prediction methods that make use of Machine Learning techniques. A total of 115 articles are analysed using the Preferred Reporting Items for Systematic Reviews and Meta-Analyses (PRISMA) approach. Using the shortlisting criteria, 15 articles published between 2010-2022 have been shortlisted for detailed analysis. A six-step approach, for data analysis, is presented in the form of system overview. Finally, we address advantages and shortcomings of the machine learning models used for fall prediction.
This article is organized as follows-
Introduction along with motivation is given in Section 1. Section 2 discusses the complete methodology and the PRISMA framework. A system overview of analysis is presented in Section 3. Section 4 details the six steps system overview. A table of advantages and shortcomings of underlying machine learning models is presented in Section 5. Finally, the article is concluded in Section 6.
Methodology
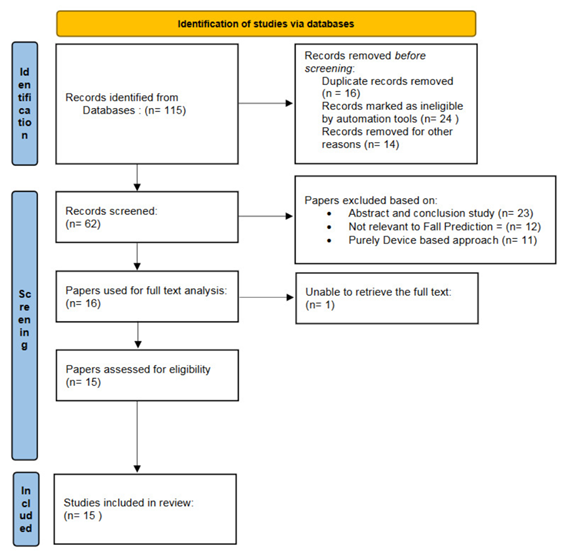
This study uses the Preferred Reporting Items for Systematic Reviews and Meta-Analyses (PRISMA) framework for identifying the articles [6] as represented in Figure 1. It identifies, screens, and selects suitable studies for a systematic review or meta-analysis in a transparent manner [7] (Figure 1).
RISMA approach uses following three steps for shortlisting of research articles [6]: Identification The method of locating pertinent research articles using the research questions and a predetermined search strategy. Screening Review of titles and abstracts of identified articles to evaluate their eligibility to be included in the systematic review. Include The process of choosing studies for further analysis in the systematic review that fulfils the established inclusion criteria.
A specific string search is performed to filter the publications based on the PRISMA technique, as presented in Table 1. With these strings, the initial screening procedure yields 1508 results. By using single strings like “Machine Learning” OR “Fall Prediction,” we detect some dimensional issues. However, while employing a multi-string dimensionality search engine, the number of results is reduced, and the analysis becomes less complex. The elimination of duplicate records, records flagged as ineligible by automated tools, and records removed for other reasons are all components of the identification process. A total of 115 articles are produced by the identification procedure, and these are utilised for screening in the next phase. In the screening procedure, it entails a number of steps where records based on abstract and conclusions, records unrelated to fall prediction, and records based on using device approaches are all excluded. In another step of the screening procedure, the whole text of the records is examined. We finally selected 15 papers based on this assessment. We present a complete system architecture in the following section (Table 1).
System Overview
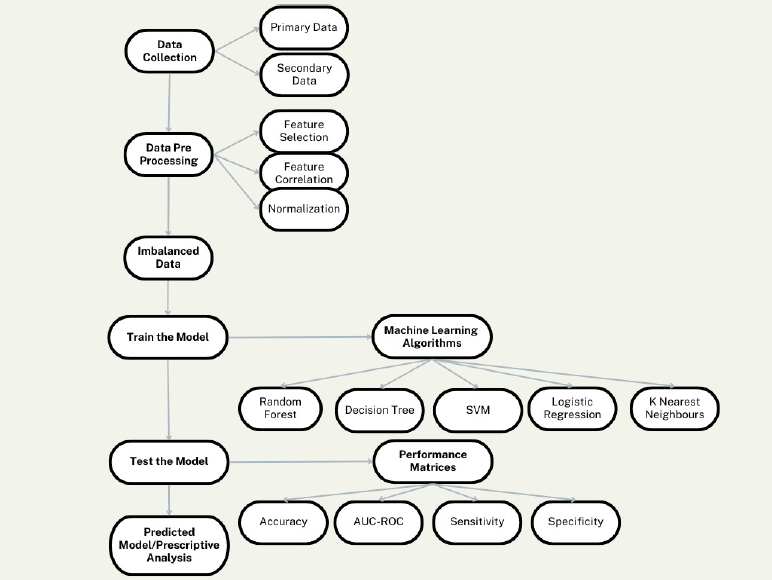
The six processes that make up our system’s overall Fall Prediction are depicted in Figure 2. Data collection, which has two components-primary data and secondary data-is the system’s first stage. These are classifed based on the set up of underlying experiments. EHRs, TUG assessments, and survey data are all included in the primary dataset. In contrast, secondary data comes from organisations, and contains studies that were conducted in the past. The obtained datasets are mostly incomplete, in the sense of using them as direct inputs. So, we require some preprocessing methods to remove these clustered and incomplete data. The techniques accomplish this via preprocessing filters like the Datawig [8] and Random Forest-based Boruta algorithm [4]. Imbalanced data is the third phase. Imbalanced data means the dataset having the number of positive instances (falls) significantly fewer than the number of negative instances or vice-versa. Handling imbalanced data is an important step since it might produce biased models that underperform for the minority class(fall) and favour the majority class(non-falls). Imbalance nature is one of the important issues in any healthcare data analysis, especially in fall prediction [9]. Various resampling techniques, such as, SMOTE [10] are utilised to balance these classes. Training of the model using ML algorithms is used in the fourth phase to classify irregular falls. The data is often divided into a specific proportion for training and testing. This division is based on how various studies have set up their experiments. The ML algorithm is used in this stage to identify fall prediction using training data. The performance of these classifiers is assessed using test data, once the classifiers are trained.
This step analyses the overall performance of the system using multiple performance metrics, including AUC-ROC, accuracy, sensitivity, and specificity [11]. The predictive model is used for the prescriptive analysis in the last stage.
We detail all the six steps in the following section (Figure 2).
Review of Fall Prediction
As mentioned in section 2, we have shortlisted 15 research articles on fall prediction. This section details the overall analysis of the 15 articles that are selected.
Data Collection
Models must be trained with accurate and representative data to effectively identify fall hazards and avoid falls. Data on a person’s medical background, physical condition, lifestyle characteristics, and environmental factors are all needed for fall prediction algorithms. We can pinpoint the variables that raise the risk of falls and develop models that can precisely forecast an individual’s risk of falling by collecting and evaluating data. With this data, one may create individualised preventative plan for each person that may include focused interventions like fitness regimens, balancing, training, and environmental changes.
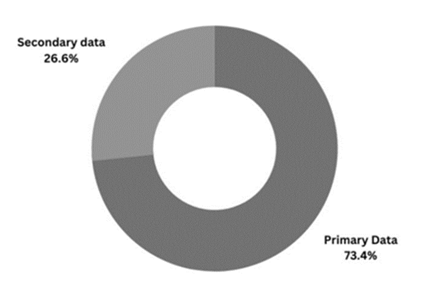
We categorize the collected data, for our analysis of Fall Prediction, into primary data and secondary data. Primary data is gathered directly from a source or by means of an investigation. For example, survey results, medical records, observational data, and experimental data. Secondary data, on the other hand, refers to dataset that have already been gathered and examined by some organisations or individuals [12]. According to our analysis, most of the data utilised to predict fall are primary data that were gathered via electronic health records (EHR), questionnaires, assessments of hospital admissions, Time Up and Go (TUG) assessments, Sit to Stand (STS) movements and surveys. Using online resources and some earlier studies, secondary data is gathered. Approximately 73% of the underlying studies are using primary datasets to produce the results. In contrast, as seen in Figure 3, only 27% of the studies have used secondary data sources (Figures 3,4).
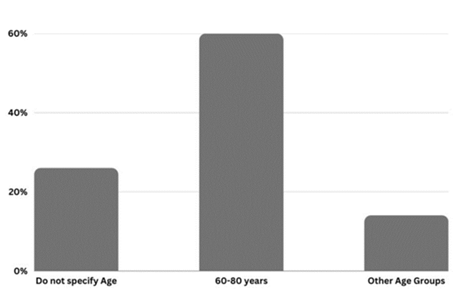
In the dataets that we have, roughly 60% of the subjects have participants aged above 60 years, which is the majority, as shown in Figure 4. Participants in some cases are also between the age of 80 and 90 years [13]. Also, 26% of the articles do not specify the participant’s actual age. As a result, it is challenging to divide the participants into a definite age range.
Data Preprocessing
Data preprocessing is a crucial stage in this process. Preprocessing helps to clean, transform, and normalize the data to enable efficient analysis and modelling because healthcare data, in general, is complicated, varied, and noisy [14]. Data cleaning, feature selection, data normalization, handling categorical data, and handling missing values are just a few steps of data preprocessing. Finding and fixing errors, missing numbers, and outliers [15] in the data is known as data cleaning (Figure 5).
In feature selection, the most significant features are chosen from the raw data and converted into a modeling-friendly format. Data normalization entails converting the input data to a common range, which helps to resolve problems caused by varying measurement scales and units [16]. For machine learning algorithms to handle categorical data, it is first converted into a numerical representation. Replacing missing values [8] or deleting data points with missing values are two common approaches for handling the missing entries.
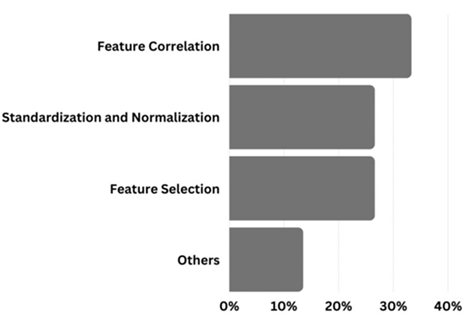
According to our analysis, 33.3% of the underlying studies focus on standardizing and normalizing the data. Nonetheless, several papers employed methods based on the removal of outliers [15], data duplication [17], and imputed missing values [8]. A total of 13.5% of the articles utilised this form of analysis is marked as others. The crucial processes in data preprocessing are feature correlation and feature selection. These methods are employed as the data preprocessing steps in about 26.6% of the total publications. There are many distinct phases in preprocessing, but the most common ones feature correlation, feature selection, standardization and normalization, as shown in Figure 5.
Imbalanced Data
In healthcare, data imbalance is a frequent problem, particularly in fall prediction, where the frequency of fallers is much lower than the number of non-fallers [5]. As a result, machine learning algorithms may produce models that are inaccurate, having bias towards forecasting the majority class [9]. To overcome the problem of imbalanced nature and enhance the precision of fall prediction models in healthcare, data resampling techniques such as SMOTE, Tomek Link, etc., are applied (Figures 6,7).
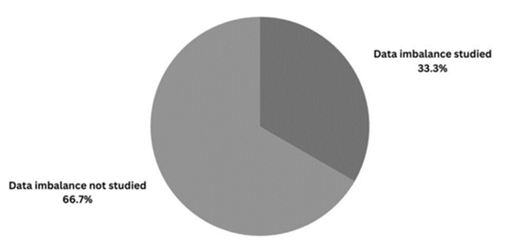
We observe that 33.3% of the total articles discuss data handling strategies or employ them to address the problems of data imbalance. In 66.6% of articles, no imbalanced data approaches are employed or referred to in the course of their study, as shown Figure 6.
Machine Learning Algorithms
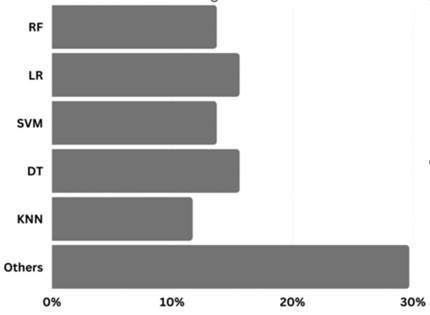
The choice of Machine Learning algorithms is the most crucial step. These algorithms are applied in accordance with the prediction model or methodology specified by the authors in respective articles. In some studies, authors employ just one algorithm, while in others, they use multiple. When there are multiple algorithms, the authors decide which algorithm performs the best for the underlying data. Figure 7 clearly shows that the most frequent machine learning algorithms are Logistic Regression (LR), Decision Tree (DT) followed by Support Vector Machine (SVM), Random Forest (RF) and K-Nearest Neighbour (KNN) (Figure 8).
Performance Metrices
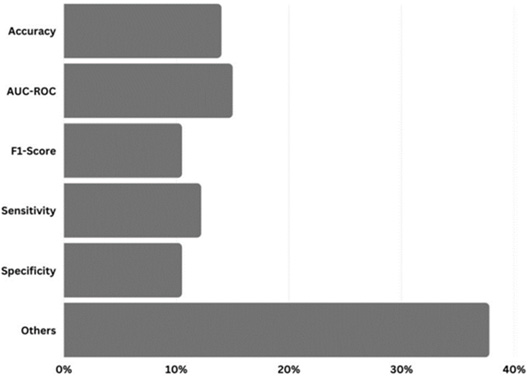
Performance metrics are useful for assessing the performance of machine learning models. Our analysis reveals that several studies have utilised various metrics to assess the effectiveness of the models. There could be several reasons for it, including different datasets, imbalance nature of dataset, participants, environment, and underlying machine learning methods utilized in these studies. For the articles under discussion, AUC-ROC is the most frequent measure followed by accuracy as shown in Figure 8.
Discussions
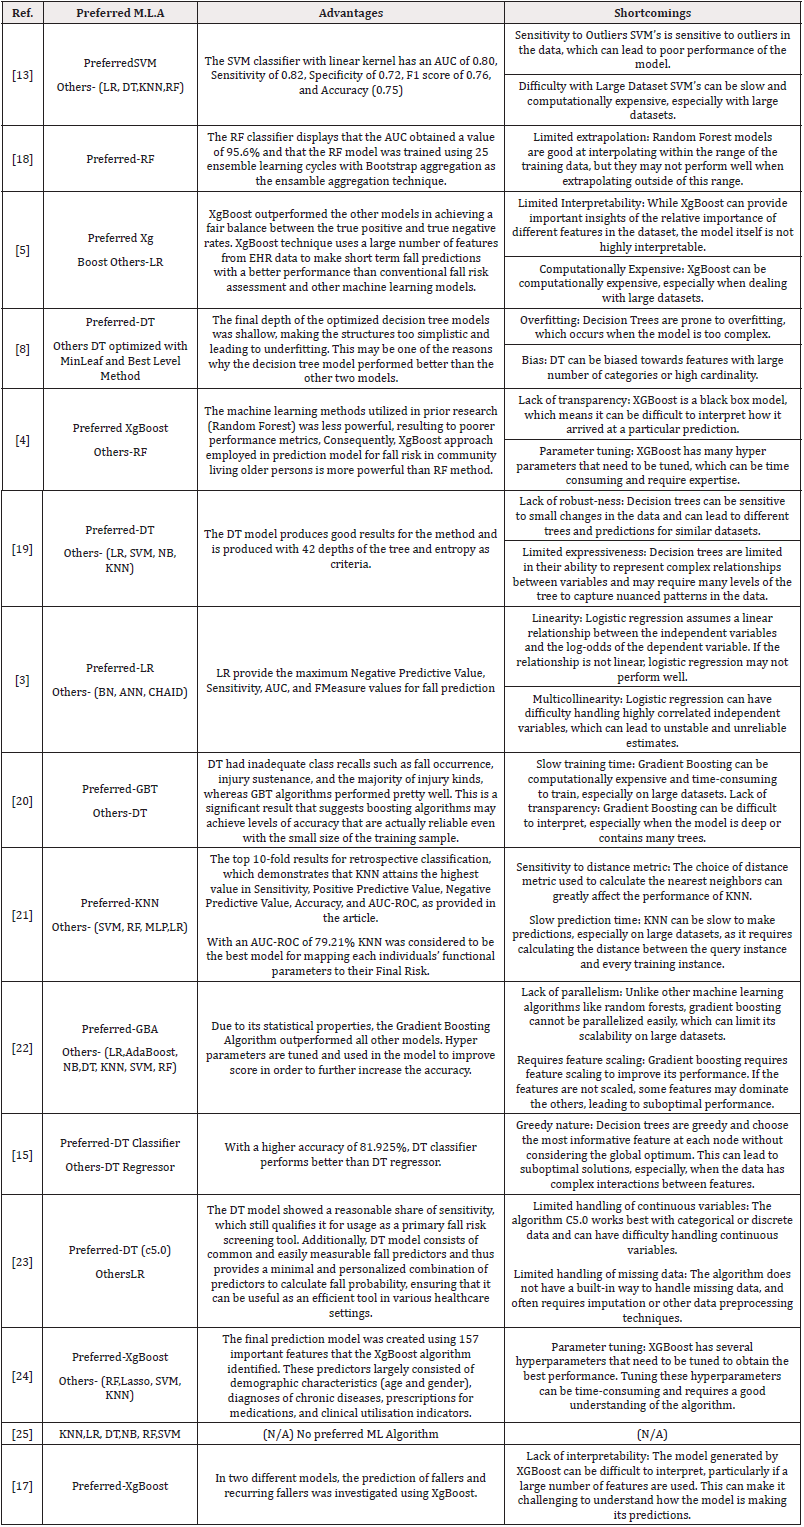
Advantages of using various Machine Learning techniques is the focus point of our analysis. Depending on the algorithms, the author determines which algorithm performs the best and why have they selected the same for the purpose of analysis. The following table presents some of the advantages and shortcomings of preferred machine learning algorithms that the authors have used.
Conclusions
The physical and cognitive abilities of older individuals are directly affected by aging, making it challenging for them to carry out daily activities. This decrease in functionality also increases the risk of falls, which can have severe consequences. To prevent such incidents, it is crucial to develop fall prediction models. This study scrutinizes several aspects of these systems, such as the datasets used, the age of participants, data preprocessing methods, machine learning algorithms, and common performance metrics employed for fall prediction.
In addition, the analysis highlights the significance of studying imbalanced data when creating a fall prediction model. One of the most important contributions of this article is to present the advantages and shortcomings of different machine learning algorithms used in the 15 selected articles.
Competing interests
The authors declare that they have no conflict of interest.
Authors Contributions
Mr Pankaj Yadav collected the articles and read the appropriate articles as per PRISMA approach. Dr Vivek Vijay analyzed the articles for figuring out the advantages and shortcomings of machine learning methods. Both prepared the manuscript according to their contributions.
Funding
Not Applicable.
References
- Desa UN (2019) World Population Prospects 2019: Highlights’. New York (US): United Nations Department for Economic and Social Affairs 125(11): 1.
- Ayeni, Ayodele, David Hewson (2022) The Association between Social Vulnerability and Frailty in Community Dwelling Older People: A Systematic Review. Geriatrics 7(5): 104.
- Huang, Way Ren, Woei Chyn (2022) Establishing a Prediction Model by Machine Learning for Accident-Related Patient Safety’. Wireless Communications and Mobile Computing 2022(7): 1-9.
- Ikeda Takaaki, Upul Cooray, Masanori Hariyama, Jun Aida, Katsunori Kondo, et al. (2022) An Interpretable Machine Learning Approach to Predict Fall Risk Among Community-Dwelling Older Adults: A Three-Year Longitudinal Study. J Gen Intern Med 37(11): 2727-2735.
- Thapa Rahul, Anurag Garikipati, Sepideh Shokouhi, Myrna Hurtado, Gina Barnes, et al. (2022) Predicting Falls in Long-Term Care Facilities: Machine Learning Study. JMIR Aging 5(2): e35373.
- Tricco Andrea C, Erin Lillie, Wasifa Zarin, Kelly K OBrien, Heather Colquhoun, et al. (2018) PRISMA Extension for Scoping Reviews (PRISMA-ScR): Checklist and Explanation. Ann Intern Med 169(7): 467-473.
- Stewart Lesley A, Mike Clarke, Maroeska Rovers, Richard D Riley, Mark Simmonds, et al. (2015) Preferred Reporting Items for a Systematic Review and Meta-Analysis of Individual Participant Data: The PRISMA-IPD Statement. Jama 313(16): 1657-1665.
- Sheng, Bo, Jianyu Zhao, Jing Tao, Yanxin Zhang, Chaoqun Duan, et al. (2022) Smart Fall Prediction Paradigm for Community-Dwelling Seniors through Fitness Screening Protocols and Machine Learning. Measurement 200: 111584.
- Sihag Gulshan, P Yadav, V Delcroix, V Vijay, X Siebert, et al. (2022) Evaluation of Risk Factors for Fall in Elderly People from Imbalanced Data Using the Oversampling Technique SMOTE. 01: 50-58.
- Chawla Nitesh V, K W Bowyer, L O Hall, W P Kegelmeyer (2002) SMOTE: Synthetic Minority over-Sampling Technique. Journal of Artificial Intelligence Research 16: 321-357.
- Davis, Jesse, Mark Goadrich (2006) The Relationship between Precision-Recall and ROC Curves. Proceedings of the 23rd International Conference on Machine Learning pp. 233-240.
- Hox Joop J, Hennie R Boeije (2005) Data Collection, Primary versus Secondary. Elsevier 1: 593-599.
- Anup Kumar Mishra, Marjorie Skubic, Laurel A Despins, Mihail Popescu, James Keller, et al. (2022) Explainable Fall Risk Prediction in Older Adults Using Gait and Geriatric Assessments. Front Digit Health Frontiers 4: 869812.
- Qiao Li, Chengyu Liu, Julien Oster, Gari D Clifford, (2016) Signal Processing and Feature Selection Preprocessing for Classification in Noisy Healthcare Data. Machine Learning for Healthcare Technologies 2: 33-59.
- Utkarsh Saxena, Soumen Moulik, Diptendu Sinha Roy (2020) Prediction of Syncope Based on Physiological Data Analysis Using Decision Tree Algorithm. IEEE Xplore pp. 1-2.
- S B Kotsiantis, D Kanellopoulos, P E Pintelas, (2006) Data Preprocessing for Supervised Leaning. International Journal of Computer Science 1(1): 111-117.
- Pattamon Panyakaew, Natapol Pornputtapong, Roongroj Bhidayasiri (2021) Using Machine Learning-Based Analytics of Daily Activities to Identify Modifiable Risk Factors for Falling in Parkinson’s Disease. Parkinsonism Relat Disord 82: 77-83.
- Andreas Ziegl, Dieter Hayn, Peter Kastner, Kerstin Loffler, Lisa Weidinger, et al. (2020) Machine Learning Based Walking Aid Detection in Timed Upand-Go Test Recordings of Elderly Patients. Annu Int Conf IEEE Eng Med Biol Soc 2020: 808-811.
- Roy, R Mukherjee, S Moulik, A Chakrabarti (2022) Human Fall Prediction Using Ensemble Learning Technique. IEEE Xplore pp. 545-546.
- S Madeh Piryonesi, Sorour Rostampour, S Abdurrahman Piryonesi (2021) Predicting Falls and Injuries in People with Multiple Sclerosis Using Machine Learning Algorithms. Mult Scler Relat Disord 49:
- F Fahimi, WR Taylor, R Dietzel, G Armbrecht, Nb Singh (2021) Identifying Fallers Based on Functional Parameters: A Machine Learning Approach. IEEE Xplore pp. 1-6.
- Gulustan Dogan, Nouran Alotaibi, Elif Sahin, Sinem Sena Ertas, Iremnaz Cay, et al. (2020) Using Artificial Intelligence to Predict Fall-Risk During Adaptive Locomotion in Humans. IEEE Xplore 1-7.
- Keitaro Makino, Sangyoon Lee, Seongryu Bae, Ippei Chiba, Kenji Harada, et al. (2021) Simplified Decision-Tree Algorithm to Predict Falls for Community-Dwelling Older Adults. J Clin Med 10(21): 5184.
- Chengyin Ye, Jinmei Li, Shiying Hao, Modi Liu, Hua Jin, et al. (2020) Identification of Elders at Higher Risk for Fall with Statewide Electronic Health Records and a Machine Learning Algorithm. Int J Med Inform 137: 104105.
- Xiuyu, Huang (2021) A Multi-View Classification Framework for Falls Prediction: Multiple-Domain Assessments in Parkinson’s Disease.




 We use cookies to ensure you get the best experience on our website.