Mini Review 
![]() Creative Commons, CC-BY
Creative Commons, CC-BY
Adsorption of Cu (II) and Ni (II) Ions from Aqueous Solutions using Hydroxyapatite and Chitosan Nanoparticles Blend (HCNB) as Adsorbent
*Corresponding author:Ayodele O, Department of Industrial Chemistry, Ekiti State Univesity, Ado-Ekiti, Nigeria.
Received: January 26, 2024; Published: February 02, 2024
DOI: 10.34297/AJBSR.2024.21.002846
Abstract
Copper and nickel ions are known to be toxic to human health, despite that, everyday activities cannot but make use of these metals for diverse manufacturing and technological purposes. This study was targeted on the adsoption of Cu (II) and Ni (II) ions from aqueous solution using hydroxyapatite and chitosan nanoparticles blend (HCNB) as adsorbent. Chitosan nanoparticles and hydroxyapatite nanoparticles were prepared separately using established procedures. A blend of the two nanomaterials were made by contacting them in ratio 1: 1. Solutions of Cu (II) and Ni (II) ions of 50 mg/L concentration were prepared as adsorbates for the adsorption process. The data generated were subjected to kinetic models such as pseudo-first and pseudo-second orders. The data were also tested using thermodynamic and isotherm models. The results showed that the data conformed to pseudo-second order as evident in the values of correlation coefficient, R2 and maximum quantity adsorbed, Qmax. The data also fitted well into Freundlich model indicating a multilayer adsorption system. The process was exothermic as the values of enthalpy change (ΔH) were negative for both metals. The study revealed the efficacy and the effectiveness of HCNB at removing two heavy metals.
Keywords: Blend, Hydroxyapatite, Nanoparticles, Adsorption, Heavy metals
Introduction
Toxic metal species such as Pb (II), Cu (II), Cr (VI), Cd (II), Ni (II), etc find their way into water body and cause contamination. This has immensely contributed to huge medical issues [1]. Activities such as refining, metal plating, Ni batteries production and disposal, mining, and paint production play a major role in introducing heavy metals into water [2]. Contamination of water inherent from heavy metals is a major threat because of their adverse effects on the ecosystem. Toxic metal ions for instance Pb2+, Cu2+, and Ni2+ are carcinogenic even at reduced concentrations [3]. To ameliorate the effects of these toxic metals in the environment, several methods such as precipitation, membrane separation, ultrafiltration, electrochemical discharge, phytoremediation, and adsorption have been used and documented [4,5]. Several adsorbents such as silica, chitin, chitosan, activated charcoal have been used as adsorptive entities. Also, the use of composites and blends as adsorbent has also been reported [6,7]. However, much has not been reported about a blend of hydroxyapatite nanoparticles and chitosan nanoparticles. So, this study was aimed at investigating the effectiveness of hydroxyapatite and chitosan nanoparticles blend (HCNB) for the removal of Cu (II) and Ni (II) ions from aqueous solutions.
Methodology
Preparation of Hydroxyapatite-Chitosan Nanoparticles Blend (HCNB)
To obtain the blend of Hydroxyapatite and Chitosan Nanoparticles (HCNB): hydroxyapatite from eggshells had earlier been prepared and reported [8]. Also, chitosan nanoparticles which were separately prepared from blue crab shells had earlier been prepared and the routes for the preparation of the natural biopolymer had been reported [9]. After the separate preparations of the two biomaterials, a composite of hydroxyapatite and chitosan nanoparticles was then made by blending the two synthesised products in ratio 1:1.
Adsorption Process
pH Studies: Adsorption process was carried out using chitosan nanoparticles-hydroxyapatite blend (HCNB) as adsorbent for the removal of Ni (II) and Cu (II) ions from aqueous solutions. 50mL of 50mg/L of each solution was accurately measured and transferred into beakers labelled from pH 2 to 8. Accurately weighed 0.5g of HCNB was added to the beakers, this was accompanied with constant agitation for 5h. The solution was filtered, and the filtrate was analysed using AAS (Buck Scientific 210).
Contact Time and Concentration Studies: Contact time and concentration studies were carried out simultaneously using the optimum pH obtained from the earlier experiment (pH studies). Time dependence studies using the following time intervals: 5, 15, 30, 60, 90, 120, 180, 240, 300, and 360 min were investigated against each of the following concentrations, 25, 50, 75, 100 and 200mg/L. 50mL of 25mg/L was transferred into ten different beakers at each time interval, and 0.5g of HCNB was transferred into the beakers with constant stirring. The mixture was allowed to stand for a particular time interval and thereafter filtered, the filtrates were analysed using AAS (Buck Scientific 210).
Temperature Studies: Temperature studies were investigated at 25, 35, 45, 55, and 65oC. Putting the optimal pH and time interval into consideration: 50 mL of 50mg/L of each metal solution and 0.5g of the blend were transferred into a beaker and heated at a particular temperature, the mixture was gently agitated, filtered, and analysed using AAS. The quantity obtained at equilibrium was calculated as follows.

Where qe (mg/g), Co (mg/L), Ce (mg/L), V (mL), and m (g) are the ion uptake, initial concentration of metal ion, molecules not adsorbed, solution volume, and the adsorbent mass.
Results and Discussion
The effects of pH variation in the adsorption of Ni (II) and Cu(II) ions using HCNB are presented in Figure 1. For Ni (II) ion, there was a slow uptake at low pH, this was increased considerably with increased pH until an equilibrium was attained at pH 6. Beyond this level, there was slight decrease in the percentage removal, this development could be traced to further agitation after equilibrium had been reached, which would invariably lead to the movement of some attached ions back into the adsorbate. For Cu (II) ion, the removal of ion was slow at the lower pH values, the adsorption process progressed as the pH increased until an equilibrium was attained at pH 7. Low metal uptake at lower pH could be linked to the large number of hydrogen ions which offers strong competition with the metal of interest [10]. Similar report has been documented by Bhattit, et al. [11].

Figure 1: Effects of pH on Ni (II) and Cu (II) ions removal using HCNB.
Contact Time Studies at Different Concentration Using HCNB
The results of the time dependence studies for Cu (II) and Ni (II) ions at different concentrations are presented in Figures 2&3, respectively. There was a rapid adsorption of Cu (II) ions at 25, 50, 75, and 100mg/L in the first 120 min. The removal process at 25, 50, and 75mg/L reached an optimum at 180 min. After the optimum adsorption, there seemed not to be much evidence of further binding of the metal ions as the process appeared to be steady and at equilibrium. It can be suggested that the available active sites within the adsorbent had been utilized by some ionic species. At the highest concentration of 200mg/L, there was a rapid uptake of metal ion at the beginning as well, the optimum uptake was observed at 300 min. For the adsorptive removal of Ni (II) ion, the uptake at the concentrations of 50 and 75mg/L was rapid at the early stage, the removal progressed slowly until 120 min where equilibrium was attained. The removal process at the concentrations of 25, 100 and 200mg/L was also rapid at the beginning as the adsorbent offered so much active pores for metal binding, the pores were being reduced as the metal ion kept binding onto them, this led to slow uptake with further increase beyond 300 min. It was noticed that, as the resident time increased, the metal uptake also increased, this shows that increase in resident time favoured the removal of Ni (II) ion. On the other hand, it was observed that increase in the concentration of metal ions with the same quantity of the adsorbent did not lead to increase in metal ion removal. This could be attributed to the fact that increased concentrations offered more ionic load in the adsorbate, and since the weight of the adsorbent was constant, the adsorbent could not accommodate more ions into its pores, indicating that increased concentration of metal ion solutions did not favour adsorption, this is because more ionic species are available in the aqueous solution without a corresponding increase in the adsorbent dose.

Figure 2: Plots of Cu (II) ion removal at different concentrations using HCNB.

Figure 3: Plots of Ni (II) ion removal at different concentrations using HCNB.
Pseudo-First Order and Pseudo-Second Order Kinetic Models Using HCNB
The data were evaluated using pseudo-first order, pseudo-second order and Elovich kinetic models.
According to Lagergren [12], pseudo-first order model is expressed as follows:

Where qe (mg/g) and qt (mg/g) are the uptake at equilibrium and at time t. kad is first order rate constant expressed in L/min. The equation can also be expressed in a linearized form.

The pseudo-second order in its linear form is given as follows:

Where qe (mg/g) is the ion uptake at equilibrium and K2 (g mg-1min-1) is the rake constant of pseudo-second order Figures 4&5 show the plots of pseudo-first order plots for Cu (II) and Ni (II) ions, respectively, while Figures 6&7 show the pseudo-second order plots for the removal of Cu (II) and Ni (II) ions, respectively. The lines of best fit of the plots were used to obtain the slopes, intercepts, and correlation coefficient, R2. The values of various kinetic parameters for the adsorption of Cu (II) and Ni (II) ions from their metal solutions are presented in Table 1. R2 values in pseudo-first order kinetic model for Cu (II) ion ranged across the five different concentrations from 0.025 – 0.594 while the R2 values for Ni (II) ion ranged from 0.194 – 0.874. The closer to unity the R2 value, the higher the conformity to the model. The R2 values for Cu (II) ion at 25, 50, 75, and 100mg/L were below 0.50, indicating no conformity to pseudo-first order model, but a fair conformity was observed at 200 mg/L where R2 value was 0.5941. For Ni (II) ion, R2 values at 25 and 75 were below the conformity level. However, some levels of conformity were observed at 50, 100, and 200 mg/L having R2 values of 0.558, 0.724, and 0.874, respectively. Nevertheless, high correlation coefficient (R2) is not enough to claim that pseudo-first order model has been obeyed. Therefore, there is a need to compare the Qe obtained on experimental and estimation bases. QeExperimental for Cu (II) ion at 25mg/L was 2.077 while QeEstimated at the same concentration was 0.098 mg/g. QeExp for Ni (II) ion at 25mg/L was 2.113 while QeEst at the same concentration was 0.212 mg/g. So, this implies that there was a wide gap between QeExp and QeEst values, and so there was no conformity to pseudo-first order kinetic model. Similar behaviours were also noticed in other concentrations under investigation.

Figure 4: Pseudo-first order for Cu (II) ion at different concentrations using HCNB.

Figure 5: Pseudo-first order for Ni (II) ion at different concentrations using HCNB.

Figure 6: Pseudo-second order plot for Cu (II) ion at different concentrations using HCNB.

Figure 7: Pseudo-second order for Ni (II) ion at different concentrations using HCNB.
In pseudo-second order kinetic model, the values of R2 for Cu (II) ion at different concentrations ranged from 0.9973-0.9998; for Ni (II) ions, the R2 values ranged from 0.9804-0.9989, both indicating strong conformity to pseudo-second order as the values were tending to unity. In a similar development, for Cu (II) ion, the QeExp ranged from 2.077 – 11.742 while QeEst ranged from 2.028 – 11.947 mg/g; for Ni (II) ion, the QeExp ranged from 2.113-11.787 while QeEst ranged from 2.151-11.976. As the two variables across the different concentrations were compared, it was observed that the values of QeExp and QeEst were close to one another, this indicated that pseudo-second order kinetic model was fully obeyed in the removal process of both ions. Billah, et al. [6] reported that the kinetic data conforms to pseudo-second-order model when chemical bonds are established between metal and composite adsorbent (Table 1).

Table 1: Kinetic parameters for the removal of Ni (II) and Cd (II) ions using HCNB.
Elovich Kinetic Model
Elovich model is expressed follows;
qt = βln(αβ) + βlntsss
Where α represents sorption rate in mol/g min and β connotes the desorption constant in g/mol. The model can be simplified using the following conditions αβt << 1; qt=0; t=0 to generate a linear equation.
qt = βln(αβ) + βlnt
The constants, α and β can be extrapolated from the intercept and slope of the plots of qt versus ln(t).
Figures 8&9 show the plots of Cu (II) and Ni (II) ion removal using HCNB. Table 2 shows the Elovich parameters for the removal of Cu (II) and Ni (II) ions. The correlation coefficient (R2) values for Cu (II) ion at different concentrations ranged from 0.7409-0.9006. Since the values were above 0.5000, it means that Elovich kinetic model was fully obeyed. For Ni (II) ion, the correlation coefficient (R2) values ranged from 0.7654-0.9756. The highest R2 value (0.9756) was recorded at 25 mg/L which tended to unity the most, this means that Elovich model was strongly obeyed. R2 values across other concentrations were above 0.5 showing some degree of conformity to the model as well.
Isotherm Studies
Langmuir Isotherm: Isotherm models such as Langmuir, Freundlich, Temkin, and Dubinin-Radushkevich were used to test the veracity of the adsorption data with a view to establishing which of the models was best obeyed. The original Langmuir equation is given as follows:


Figure 8: Elovich plot for Cu (II) ion at different concentrations using HCNB.

Figure 9: Elovich plot for Cu (II) ion at different concentrations using HCNB.

Table 2: Elovich parameters for Cu (II) and Ni (II) ions using HCNB.
Where qe and qmax are solid phase adsorbate concentration at equilibrium (mgg-1) and maximum adsorption capacity (mgg-1), Ce is the adsorbate concentration at equilibrium (mg/L) and KL is the Langmuir constant (L/mg). Langmuir isotherm is a model that is often employed for metal ion uptake during adsorption, it suggests that a certain adsorbent possesses a definite number of active pores with similar energy level for monolayer coverage [13]. The original Langmuir equation can be expressed in a linear form as follows:

Where qm (mgg-1) and b (mLmg-1) are the maximum adsorption capacity for monolayer coverage and Langmuir constant.
Figures 10&11 show the Langmuir plots for the adsorption of Cu (II) and Ni (II) where the values of qm and b were extrapolated from the intercepts and the slopes. An important quantity of the Langmuir isotherm is the separation factor (RL), a dimensionless constant also known as equilibrium parameter which was described by Weber and Chakraborti [14].


Figure 10: Langmuir plots for Cu (II) ion at different time interval using HCNB.

Figure 11: Langmuir plots for Ni (II) ion at different time interval using HCNB.
Where Co represents the initial metal concentration in mg/L. If RL is 0, it implies irreversible process; it is favourable if 0<RL<1; not favourable if RL>1; linear if RL =1 [15]. In Table 3, the values of RL at different time interval for Cu (II) ion ranged from 0.4545-0.6803. These values were less than 1 but greater than 0, the implication is that the adsorption process was favourable. Also, the monolayer saturation capacity, qmax for Cu (II) at different time intervals ranged from 10.5820-16.3132 mg/g. The values of separation factor RL across different time intervals ranged from 0.3872-0.5253. The results imply that the adsorption process was favourable since the RL values were less than unity. The R2 values across different time interval ranged from 0.8179-0.9321. The fact that the R2 values were close to 1 showed that Langmuir isotherm was obeyed. The monolayer saturation capacity, qmax for Ni (II) ion removal at different time interval ranged from 10.2987-16.7785 mg/g. This showed that the monolayer coverage of Ni (II) ion onto the particles is confirmed, it also revealed that there was homogenous distribution of active sites round the adsorbent. The result was in line with the report submitted by Thanh, et al. [7]. Separation factor RL focusses on the favourability of the adsorption process, the values of RL across all the time intervals were between 0-1. Since the RL values were below one and higher than zero. It can be adduced that the adsorption process was favourable. The R2 values across different time interval ranged from 0.7219-0.9756, if the values are tending to one, then Langmuir isotherm is obeyed. The results in this study showed that the experimental data conformed to Langmuir isotherm.
Freundlich Isotherm: The Freundlich isotherm, according to Kamari and Ngah [16] is based on the assumption of reversible adsorption in heterogeneous setup.

KF in mgg-1 is the Freundlich constant and 1/nF (also known as bF) is Freundlich heterogeneity factor. The heterogeneity of the solid phase is more pronounced when the values of bF tend to zero [17]. Constants, kF and 1/nF (or bF) can be estimated from the intercepts and slopes of Freundlich plots. Figures 12&13 show the Freundlich plots of Cu (II) and Ni (II) ion removal. The Freundlich isotherm describes reversible adsorption which is not restricted to monolayer formation only [18]. Table 3 shows the isotherm parameters of Cu (II) and Ni (II) ions removal using HCNB. For Cu (II) ion removal at different time intervals, the bF values ranged from 0.4817-0.5693. The surface tends to be more heterogeneous as bF tends to zero. The correlation coefficient R2 across different times ranged from 0.9580-0.9886. The R2 values from the experimental data all tended to unity, this means that the experimental data conformed to Freundich isotherm. For Ni (II) ion removal, the bF values across different time intervals ranged from 0.4353-0.6399, a particular surface is more heterogeneous when the Freundlich constant bF approached zero. Freundlich isotherm mathematically predicts the infinite surface coverage indicating a multilayer system of adsorption [19]. Another parameter that determines the conformity of experimental data to Freundlich isotherm is correlation coefficient (R2). The R2 values for Ni (II) ion removal at different time interval ranged from 0.8077-0.9956. Since these values were close to unity, it can therefore be ascertained that Freundlich isotherm was obeyed by the adsorption system.

Figure 12: Freundlich plots for Cu (II) ion at different time interval using HCNB.

Figure 13: Freundlich plots for Ni (II) ion at different time interval using HCNB.

Table 3: Isotherm parameters for Cu (II) and Ni (II) ions using HCNB.
Temkin Isotherm: Temkin model points to the even distribution of the energies available for binding in all the active sites. The original Temkin equation is given as follows:
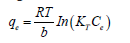
The model is usually applied in its linearized form [20].
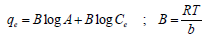
Where A and B are Temkin isotherm constant (equilibrium binding constant) and Temkin constant attached to heat of adsorption (J/mol). The parameter, b (J/mol) is a constant related to heat energy available in sorption, R is gas constant (8.314 J/molK) and T is the absolute temperature in Kelvin.
Figures 14&15 show the Temkin isotherm plots for the removal of Cu (II) and Ni (II) ions at different time intervals. Table 3 shows the Temkin parameters for the removal of Cu (II) and Ni (II) ions. The Temkin constant (A) values for the removal of Cu (II) ion at different time intervals ranged from 0.2626-0.4154. This showed that the adsorption potential increased with time. The Temkin constant, B (heat of sorption) ranged from 4.5584-7.1096 kJ/mol. The values obtained in this study indicated some levels of interaction between the adsorbent and the adsorbate, pointing to an ion-exchange mechanism. The correlation coefficient R2 values ranged from 0.8454-0.9058. It can be concluded that the experimental data conformed to Temkin isotherm. For Ni (II) ion removal, the Temkin constant (A) values ranged from 0.1291-0.4754, the Temkin constant, B ranged from 4.2689-5.0260 kJ/mol., and the R2 values across different time intervals ranged from 0.7338-0.9659 indicating the conformity of the experimental data to Temkin model.
Dubinin–Radushkevich Isotherm: Dubinin–Radushkevich isotherm is generally applied to express the adsorption mechanism onto a heterogeneous surface [21,22]. The model is often applied in adsorption system to distinguish between physical and chemical adsorption of metal ions [23,24].
The linearized Dubinin–Radushkevish (D-R) equation is expressed as follows:
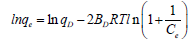
Where, BD is the free energy of sorption, qD is the Dubinin-Radushkevich constant, R is known as gas constant (8.314 Jmol-1K-1), and T is the absolute temperature in Kelvin. The Dubinin-Radushkevish isotherm was chosen to estimate the characteristic porosity of adsorbent and the adsorption energy [25].
Figure 16 shows the plot of lnqe against RTIn(1 + 1/Ce) for Cu (II)and Ni (II) ions removal. Both qD and BD were calculated from the intercepts and slopes of the plots. The enegy (E) of the adsorption system is expressed as follows:


Figure 14: Temkin plots for Cu (II) ion at different time interval using HCNB.

Figure 15: Temkin plots for Ni (II) ion at different time interval using HCNB.

Figure 16: Dubinin-Radushkievich plots for Cu (II) and Ni (II) ions using HCNB.
Table 4 shows the Dubinin-Radushkevich isotherm parameters. The parameter, E suggests the type of adsorption process, if the values of E are below 8 kJ/mol, then it is physical adsorption. It was observed in this study that the values (0.289 and 0.316 k kJmol-1; Cu (II) and Ni (II) ions) of E were less than 8 kJmol-1, this indicates that physical adsorption was involved. The R2 values for of Cu (II) and Ni (II) ions were 0.790 and 0.571, indicating some level of conformity to the model. This is similar to the report of Temkin and Phoyez [26]. The adsoption capacity, qD values were 2.494 and 2.570, the higher the values of qD, the higher the adsorption capacity.

Table 4: Dubinin-Radushkievich parameters for Cu (II) and Ni (II) ions.
Temperature Dependence Studies
Figure 17 shows the percentage removal of Cu (II) and Ni (II) ions at different temperature from aqueous solutions. In the case of Cu (II) ion, at the lowest temperature of 301K, 83.54% was adsorbed; at 308 K, 83.06% was adsorbed, at the highest temperature of 338 K, 44.24% of the metal ion was adsorbed. For Ni (II) ion, 85.76% adsorption was obtained at the lowest temperature of 301 K; 68.74% was adsorbed at 308 K; at the highest temperature of 338 K, 40.64% was adsorbed. It was observed that increase in temperature resulted to decrease in the percentage removal of the metal ions. Abdul-Raheim, et al. [3] reported that at increased temperatures could lead to desorption because high temperature would likely shrink the adsorbent and then release some of the ions already adsorbed. It can therefore be concluded that increased temperature does not favour adsorption.

Figure 17: Dubinin-Radushkievich plots for Cu (II) and Ni (II) ions using HCNB.
Thermodynamic Studies: The thermodynamic expression as postulated by vant’ Hoff was used to estimate the thermodynamic parameters for the removal of Cu (II) and Ni (II) ions. The mathematical expression is given as follows.

ΔH (enthalpy change) and ΔS (entropy change) can be obtained from the slope and the intercept of the plot of lnKd against 1/T as presented in Figure 18. R is 8.314 kJ/molK, T is Temperature (K), and Kd is the thermodynamic equilibrium constant.

Cb is the amount of metal ion bound and Ce is the amount of metal unbound when equilibrium has been reached.

Figure 18: Vant’Hoff plots for Cu (II) and Ni (II) ions using HCNB.
The Gibbs free energy (ΔG) equations can be expressed as follows:
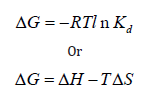
The thermodynamic parameters as calculated from the slopes and intercept of vant’Hoff plots are presented in Table 5. The results showed that ΔS for both Cu (II) and Ni (II) ions removal process were negative, this implies there was an association of metal ions onto the adsorbents, the negative values also suggested that the degree of randomness was negligible as it offered little restriction for the adsorbate species to adhere onto the active sites of the adsorbent. The values of ΔH were negative, indicating exothermic system. ΔG values for Cu (II) ion at 301, 308, 318, 328 K were negative indicating spontaneous reaction but positive at the highest temperature, 338 K. For Ni (II) ion, ΔG values were negative at 301, 308, and 318 K, but were positive at high temperatures of 328 and 338 K. However, that ΔG values were positive at some points do not mean that the reaction was not feasible, simple agitation can however initiate the reaction process.

Table 5: Thermodynamic parameters for the removal of Cu (II) and Ni (II) ions using.
Conclusion
The efficacy of HCNB to remove heavy metals from aqueous solution was investigated. The research revealed the levels of effectiveness of the adsorbent. The kinetics of the removal process showed that the data fitted well into pseudo-second order kinetic model, while the isotherm studies showed that the data generated fitted most into Freundlich isotherm. The thermodynamic studies revealed that both ΔH and ΔS were negative, indicating exothermic process and reduced entropy. The Gibbs’s free energy (ΔG) values were negative for most of the processes and positive at some. The negative ΔG showed that the process was spontaneous, while the positive ΔG showed that the process was not spontaneous, but feasible when external factors such as gentle agitation are applied.
Acknowledgement
None.
Conflict of Interest
None.
References
- Atar N, Olgun A, Wang S (2012) Adsorption of cadmium (II) and zinc (II) on boron enrichment process waste in aqueous solutions: Batch and fixed-bed system studies. Chem Eng J 192: 1-7.
- Mahdavi S, Jalali M, Afkhami A (2012) Removal of heavy metals from aqueous solutions using Fe, ZnO, and CuO nanoparticles. J Nanoparticle Res 14: 1-18.
- Abdul Raheim MA, Farag RK, El Saeed SM, Abdel Raouf ME (2015) Modified Starch Iron Oxide Nanocomposites as Low-Cost Absorbents for Selective Removal of Some Heavy Metals from Aqueous Solutions. Res J Pharm, Biol Chem Sci 6(6): 1197-1212.
- Azimi A, Azari A, Rezakazemi M, Ansarpour M (2017) Removal of Heavy Metals from Industrial Wastewaters: A Review. Chem Bio Eng Rev 4: 37-59.
- Zamri MFMA, Kamaruddin MA, Yusoff MS, Aziz HA, Foo KY, et al. (2017) Semi-Aerobic Stabilized Landfill Leachate Treatment by Ion Exchange Resin: Isotherm and Kinetic Study. Appl Water Sci 7(12): 581–590.
- Billah R El K, Ayouch I, Abdellaoui Y, Kassab Z, Khan MA, et al. (2023) A Novel Chitosan/Nano-Hydroxyapatite Composite for the Adsorptive Removal of Cd (II) from Aqueous Solution. Polymers 15(6): 1524.
- Thanh DN, Novák P, Vejpravova J, Vu H N, Lederer J, et al. (2018) Removal of copper and nickel from water using nanocomposite of magnetic hydroxyapatite nanorods. J Magnetism Magnetic Mater 456: 451-460.
- Ayodele O, Olusegun SJ, OluwasinaO O, Okoronkwo EA, Olanipekun EO, et al. (2021) Experimental and theoretical studies of the absorption of Cu and Ni ions from wastewater by hydroxyapatite derived from eggshells. Environ Nanotechnol, Monitor Management 15: 100439.
- Ayodele O, Okoronkwo AE, Oluwasina OO, Abe TO (2018) Utilization of blue crab shells for the synthesis of chitosan nanoparticles and their characterization. Songklanakarin J Sci Technol 40(5): 1039-1042.
- Qiu Y, Cheng H, Xu C, Sheng SD (2008) Surface characteristics of crop-residue-derived black carbon and lead (II) adsorption. Water Res 42(3): 567-574.
- Bhatti HN, Mumtaz B, Hanif MA, Nadeem R (2007) Removal of zinc ions from aqueous solution using Moringaoleifera Lam. (horseradish tree) biomass. Process Biochem 42(4): 547-553.
- Lagergren SK (1898) About the theory of so-called adsorption of soluble substances. K Sven Vetenskapsakad Handlingar Band 24: 1-39.
- Febrianto J, Kosasih AN, Sunarso J, Ju Y H, Indraswati N, et al. (2009) Equilibrium and kinetic studies in adsorption of heavy metals using biosorbent: A summary of recent studies. J Hazard Mater 162(2-3): 616-645.
- Weber TW, Chakraborti RK (1974) Pore and solid diffusion models for fixed-bed adsorbents. AIChE J 20(2): 228-238.
- McKay G, Blair HS, Gardener JR (1982) Adsorption of dyes on chitin. I. Equilibrium studies. J Appl Poly Sci 27: 3043-3057.
- Kamari A, Ngah WSW (2009) Isotherm, kinetic and thermodynamic studies of lead and copper uptake by H2SO4 modified chitosan. Colloids Surf B Biointerfaces 73(2): 257-266.
- Haghsherest F, Lu G (1998) Adsorption characteristics of phenolic compounds onto coal-reject-derived adsorbent. Energy Fue 12(6): 1100-1107.
- Mohammad RH, Mina S, Pourya B (2011) Removal of Cr (VI) from aqueous solution using pine needles powder as a biosorbent. J Appl Sci Environ San 6(1): 1-13.
- Mobasherpour I, Salahi E, Pazouki M (2011) Removal of Divalent Cadmium Cations by Means of Synthetic Nano Crystallite Hydroxyapatite. Desalination. 266(1-3): 142–148.
- Temkin MI, Zh Fiz Chim (1941) Adsorption equilibrium and process kinetics on homogenous surfaces and with interaction between adsorbed molecules. Zhurnal Fizichesko Khimii 15(3): 296-332.
- Dabrowski A (2001) Adsorption—from theory to practice. Adv Colloid Interface Sci 93(1-3): 135-224.
- Gunay A, Arslankaya E, Tosun I (2007) Lead removal from aqueous solution by natural and pretreated clinoptilolite: adsorption equilibrium and kinetics. J Hazard Mater 146(1-2): 362-371.
- Dubinin MM (1960) The potential theory of adsorption of gases and vapours for adsorbents with energetically non-uniform surface. Chem Review 60: 235-241.
- Hobson JP (1969) Physical adsorption isotherms extending from ultra-high vacuum to vapour pressure. J Physical Chem 73: 2720-2727.
- Igwe JC, Abia A A (2007) Adsorption isotherm studies of Cd (II), Pb (II) and Zn (II) ions bioremediation from aqueous solution using unmodified and EDTA-modified maize cob. Electica Quimica 32(1): 33-42.
- Temkin MI, V Phoyez (1940) Kinetics of ammonia synthesis on promoted iron catalysts. Acta Physicochim URSS 12: 327-356.


 We use cookies to ensure you get the best experience on our website.