Review Article 
 Creative Commons, CC-BY
Comparative Study of Classification Mechanisms of Machine Learning on Multiple Data Mining Tool Kits
*Corresponding author: Ahmad Abuashour, Computer studies department, Arab Open University, Kuwat.
Received: March 28, 2024; Published: April 04, 2024
DOI: 10.34297/AJBSR.2024.22.002913
Abstract
Machine Learning methods are beneficial to extract information from the raw data. These methods are applied in numerous fields, such as medicine, education, finance, business, etc. Classification methods are prominent approaches in data mining for predicting the target variable using the independent factors. There are various software mechanisms and tools for achieving this prediction, such as WEKA, Rapid Miner, Orange. The accuracy of the created model from the training data is vital for effective prediction. This accuracy fluctuates with the specified algorithms and the selected data mining mechanisms. So, it is necessary to know which data mechanism produces better results for the chosen method and which is better for the selected dataset. This study explores three datasets from the repository: Iris Dataset, Car Evaluation Dataset, and Tic-Tac-Toe end game Dataset. Also, four Classification algorithms are explored for analyses, such as Decision Tree, Naïve Bayes, Random Forest, and Neural Network. These algorithms are applied to the three chosen datasets that were previously stated, using three different Data Mining mechanisms, which are Orange, WEKA, and Rapid Miner. Using these algorithms, we shall examine the accuracy of each method in each data mining mechanism. Those findings will establish the link between the dataset’s size, algorithm type, and data mining tool picking.
Keywords: Orange, WEKA, Rapid miner, Iris, Car evaluation, Tic-Tac-Toe game, Decision tree, Naïve bayes, Random forest, Neural network, Data mining tools, Accuracy
Introduction
Data mining refers to the act of “digging through” (meaning analyzing using computers) vast amounts of data to uncover intriguing anomalies, patterns, and relationships. This form of study has its origins in statistical approaches like Bayes’ Theorem that were first developed by hand [1]. However, today’s data mining is more complex, reflecting a combination of statistics, data science, database theory, artificial intelligence, and machine learning approaches. With data mining technologies, enterprises of any size may extract valuable insights from their databases, including information about customers, prices, and future trends. This technique may be applied to answer some of the business issues that used to take a long time to address. In addition, it is used to make knowledge-driven choices based on the absolute best facts available. The process details that underpin data mining are a helpful approach. It illustrates how this sort of analysis may produce the best data analysis and which tools are likely to be most effective for your firm [2,3]. Before we get into tools for data mining, let’s look at some typical data-mining strategies. Data mining involves various methods and processes, but we can categorize them into two primary types: descriptive and predictive.
Descriptive data mining methods are used to detect similarities in data and to uncover trends. Such as:
I. Association: This function is intended to identify interesting correlations and associations between objects or values inside the datasets. For instance, it may benefit knowing whether goods are regularly bought together since these things might be displayed closer together in real shops or provided as special bundles in digital markets.
II. Clustering: This function combines things into clusters that have similar properties. This method can be used in anything from biology to climate science to psychology. In business, clustering may be used to split clients into tiny groups that may be responsive to various marketing initiatives [4-6].
Predictive data mining methods are used to predict future outcomes utilizing identifiable factors from the present. Such as:
I. Classification: This function often comprises a machine learning model that allocates objects in a collection to predetermined categories or classes. This may appear like a descriptive function, but the purpose of classification is typically to anticipate certain outcomes based on current data. A classification model might, for instance, be used to categorize loan applicants as low, medium, or high credit risks.
II. Regression: it is a statistical approach widely applied in supervised machine learning that is used to first discover the connection between a dependent variable and independent variables. Second, use that relationship to predict a range of numeric values, given a specific dataset. Regression may, for instance, be used to forecast the cost of a product or service when factors like the cost of gasoline are considered. Your choice of approach will be influenced by the use case and intended goal [1,2,7].
There are innumerable instances of how this may play out in practice. Here are just a few instances:
I. Marketing and data mining technologies may help you discover more about customer preferences and acquire demographic, gender, location, and other profile data. Also, harness all that information to enhance your marketing and sales efforts. Correlations in purchase behavior, for instance, may be utilized to construct more complex customer profiles that can, in turn, help you produce more focused marketing.
II. Fraud detection, financial institutions depend on data mining to help identify (and even foresee) fraud and assist other risk management functions. Transaction behavior may be monitored to discover fraudulent transactions before clients realize their card or account has been hacked. Supply chain inventory management, Data mining, and other business intelligence technologies may give insights into your whole supply chain. They can even anticipate out-of-stock projections at the store/product level.
III. Decision-making, with data mining, you may reveal insights about processes and patterns that never would have been accessible otherwise. This information may help you make better educated and ultimately data-driven judgments regarding crucial subjects. For example, your gut may be that a product isn’t selling because it’s priced too high, but data mining may indicate that it’s not being promoted to the proper demographics.
IV. Human resources departments in big firms may utilize data mining to monitor employee information and unearth insights that may be valuable about recruiting, retention, and pay plans [8]. Data mining is highly beneficial in hiring since it may find vital information in résumés and applications that basic keyword filtering may overlook. However, you choose to apply data mining; you’ll need to be armed with the necessary tools to get the maximum return on value [8-10]. Figure 1, illustrates the general process of preparing and selected the data from a raw data in a database, extract the data, then transforming the data by applying some data mining techniques, and finally evaluation, interpretation, and producing a beneficial information (Figure 1).
Data Mining Tool Kits
Classification methods are prominent approaches in data mining for predicting the target variable using the independent factors. There are various software mechanisms and tools for achieving this prediction, such as Orange, WEKA, Rapid Miner. The operating effectiveness of the mechanisms may vary from each other. Data mining mechanisms are employed in numerous domains since they are simple to manage and easy to run. The following points provide an overview of three Data Mining Tool Kits that are discussed in this article:
Orange
Orange is a data mining program that is available as open-source software. In addition to having a user interface, it is built on component technology [11-14]. Widgets are the components that make up this system. Implementing an algorithm on an orange tool is like constructing a circuit. This tool has a high level of interaction with the user. This tool is the ideal match for kids since it is simple to learn and practice. In this tool, the chosen three datasets are classified, and the correctness of the models that have been generated is recorded. Orange is a data visualization, machine learning, and data mining toolkit that is free and open source. It has a visual programming front-end for quick qualitative data analysis and interactive data visualization. Orange is a component-based visual programming software package for data visualization, machine learning, data mining, and data analysis. It is available in both free and commercial versions. Known as widgets, the orange tool components cover various topics, from basic data visualization, subset selection, and preprocessing to the empirical assessment of learning techniques, predictive modeling, and machine learning. When using Orange, visual programming is implemented via an interface in which workflows are constructed by combining preset or user-designed widgets. Still, experienced users may utilize the orange tool library as a Python library for data processing and widget modification. Orange is a free and open-source software package distributed under the GNU General Public License. Versions up to 3.0 contain core components written in C++ and wrappers written in Python, and they are accessible on the GitHub repository. Starting with version 3.0, Orange uses widely used Python open-source libraries for scientific computing, such as NumPy, SciPy, and scikit-learn. At the same time, its graphical user interface is built on top of the Qt framework, which is available on all major platforms. Many machine learning, preprocessing, and data visualization methods are included in the default installation, divided into six widget sets (data, visualize, classify, regression, evaluate, and unsupervised). Additional functions are available as add-ons to the basic package (bioinformatics, data fusion, and textmining). Besides being compatible with macOS, Windows, and Linux, Orange also can be downloaded via the Python Package Index repository (pip install Orange3). As of May 2018, the stable version is 3.13, which is compatible with Python 3, while the legacy version 2.7, which is compatible with Python 2.7, is still available for download [15]. As of November 2021, the most recently downloaded (and tested) version available on the website is version 3.30.2 [2-11] (Figure 2).
Weka
WEKA (Waikato Environment for Knowledge Analysis) is a prominent machine learning software written in Java, created at the University of Waikato, New Zealand, in 1993. WEKA is free software accessible under the GNU General Public License [4,5]. The WEKA workbench offers a variety of visualization tools and algorithms for data analysis and predictive modeling, combined with graphical user interfaces providing simple access to these capabilities. WEKA is a set of machine learning methods for handling real-world data mining challenges. It is developed in Java and operates on practically any platform. The algorithms may be applied directly to a dataset or invoked from your own Java code. The first non-Java version of WEKA had a TCL/TK front-end to (mainly third-party) modeling algorithms written in other programming languages, including data preparation tools in C, and a Makefile-based method for launching machine learning experiments. This first version was initially created to evaluate data from agricultural domains. Still, the most current entirely Javabased version (WEKA 3), developed in 1997, is now utilized in various application areas, particularly for educational purposes and research. Advantages of WEKA include Free availability under the GNU General Public License. Portability is entirely developed in the Java programming language and operates on practically any computer platform. A comprehensive set of data preparation and modeling approaches. Ease of usage owing to its graphical user interfaces, WEKA supports numerous typical data mining tasks, more notably, data preparation, clustering, classification, regression, visualization, and feature selection. All of WEKA's strategies are dependent on the idea that the data is supplied as a single flat file or relation, where each data point is characterized by a set number of characteristics (usually, numeric or nominal attributes, although certain additional attribute types are also supported) (typically, numeric or nominal attributes, but some other attribute types are also supported) [16,17]. WEKA enables access to SQL databases via Java Database Connectivity and can handle the result produced by a database query. It is not capable of multi-relational data mining. Still, there is separate software for turning a collection of connected database tables into a single table appropriate for processing using WEKA. Another important topic that is presently not addressed by the methods provided in the WEKA package is sequence modeling. Finally, WEKA is a blend of C, Tk, and Make Files, and this tool supports various machine learning algorithms with high efficiency. In this research, this technique is used to categorize the specified three datasets and reports the accuracy of those classifications [1,18,19] (Figure 3).
Rapid Miner
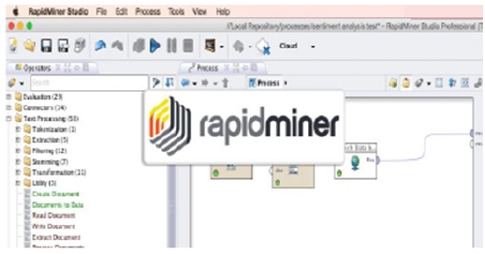
Rapid Miner is a data mining application developed by the Rapid Miner company in 2001, under the name YALE at the time of its creation [5]. It provides a comprehensive environment for datasets, including tools for preparing them, applying machine learning algorithms, deep learning, and making predictions with analysis. When used in a business setting, this instrument is easier to operate and keep up to date in any firm or industry. With the use of this tool, the three datasets that have been selected are classified using some method, and the tool then reports on the accuracy of those classifications. Rapid Miner is a comprehensive data science tool that allows for visual process design and total automation. It suggests that we will not need to code to do data mining operations. Rapid miner is one of the most widely used data science tools on the market. The blank method in rapid miner has a graphical user interface, shown below in Figure 3. It has a repository that contains our dataset [1,18]. We can import our datasets. It also provides a variety of publicly available datasets that we may use to test our hypotheses. We may also deal with the connection to a database. It has an operator at the bottom of the repository window. Everything we need to develop a data mining process is included in the operators, including data access, data purification and modeling, and validation and scoring. The parameters window is located on the right side of the screen. The operators may be adjusted using the parameters window. Rapid miner is one of the solutions that may substantially simplify data mining tasks since it is built on Nocode development platforms. Rapid miner is one of the data mining technologies that are both effective and timesaving in many situations. Data pre-processing and algorithm selection are also included in the rapid miner package. The Rapid Miner will give visuals to us after the work so that we may get insight. Compared to manual coding, all the activities completed in quick miner are a piece of cake [4,5]. Figure 4 shows the logo and a screenshot for the RapidMiner Tool kit for Data Mining (Figure 4).
Dataset in Data Mining
A data set (also known as a dataset) is a collection of information. A data set corresponds to one or more database tables for tabular data. Each table column corresponds to one or more variables of the data set in question. Each row corresponds to one or more records of the data set in question [9]. The data set contains values for each variable, such as the height and weight of an item, for each data set member. It is also possible for data sets to consist of a collection of papers or files. In the open data discipline, a data set is a unit used to quantify the amount of information that has been made available via a publicly accessible open data repository. More than half a million data sets are gathered on the European Open Data platform [5]. Other concerns (such as real-time data sources, non-relational data sets, and so on) contribute to the difficulty in reaching an agreement on this subject. Several criteria define the structure and features of a data collection. These include the quantity and kinds of features or variables and the many statistical measures applied to them, such as the standard deviation and kurtosis, among other factors. The values may be numbers, such as real numbers or integers, indicating a person's height in centimeters. Still, they may also be nominal data (i.e., data that does not consist of numerical values), for example, reflecting a person's ethnicity, as well as any combination of the two. For this definition, values may take on any form defined as a measurement level. The values for each variable are generally all the same types for the most part. However, certain values may not be present, and these must be communicated in some manner. In statistics, data sets are often derived from actual observations gathered via sampling a statistical population. Each row corresponds to observations on one population element in question [20]. Algorithms may also create a data set to evaluate certain software, such as a computer program. The traditional data set format is still used by current statistical analysis tools, such as SPSS, to show their data. If data is missing or suspect, an imputation approach may be used to fill in the gaps in a data collection and complete it [9].
Iris Dataset
The Iris dataset is a well-known dataset in the field of machine learning. This dataset has been compiled from the UCI repository for your convenience. It has five variables, four of which are independent (1. Sepal length, 2. Sepal breadth), and one of which is dependent on the other. Three variables (petal length, petal width, and petal width) are controlled, one being the goal variable (5. Species). There are no missing values in the data, consisting of 150 cases [21].
Car Evaluation Dataset
The dataset for Car Evaluation is taken from the UCI repository. This dataset contains 1728 occurrences of 7 variables out of a total of 7 variables. This dataset has no missing values at all. It contains information on the characteristics of cars, including the number of passengers who may ride in the vehicle, the number of doors in the vehicle, the cost of maintenance, the cost of purchase, the amount of baggage space available, and the safety of the vehicle. The primary outcome variable is whether the client accepts the automobile. The classification algorithms on the three different tools will be used to make this forecast, which will be done in real-time [21].
Tic-Tac-Toe End Game Dataset
The data for the Tic-Tac-Toe End game is also gathered from the UCI repository. This dataset contains information on the current position of each block on the board. Whether the player's location on the board is positive or negative is the variable under consideration. The values in this dataset correspond to the player 1 in question [21].
Classification Algorithms in Data Mining
Data mining is a process of extracting relevant patterns or information from large quantities or vast volumes of data. Knowledge mining is another word for data processing. The overall purpose of the data mining approach is to extract information from a data collection and organize it into a complete structure that may be used to make decisions in the future. Statistical models, mathematical algorithms, and machine learning methodologies are examples of technologies used. As a result, data processing encompasses more than just collecting and managing data; it also involves analyzing and predicting data. Classification techniques are becoming more popular since they can process a more excellent range of data than regression techniques. The k-nearest neighbor method, Naïve Bays technique, support vector machine algorithm, and neural network algorithm are all well-known categorization algorithms. Machine Learning (ML) has a wide range of applications, the most important of which is data mining, the first and most important. People are often prone to make errors throughout their studies or, more specifically, while establishing linkages between different alternatives. Machine learning may often be used effectively to these difficulties, resulting in increased system efficiency and improved machine design. Classification is the grouping of information into specified classes; it is often referred to as supervised classification. It employs predetermined class labels to arrange the items in the data collection in a particular order. The following classification procedures are used to categorize the datasets under consideration:
Neural Network
When it comes to data assimilation, the Artificial Neural Network (ANN) takes its cues from how the human brain goes about processing information. Millions of neurons, tiny cells that process information in electric impulses, may be found throughout the brain. The brain receives information or stimuli from the outside world, then analyses the information and generates an output [22]. When it comes to data assimilation, the Artificial Neural Network (ANN) takes its cues from how the human brain goes about processing information. Millions of neurons, tiny cells that process information in electric impulses, may be found throughout the brain. The brain receives information or stimuli from the outside world then analyses the information and output. Additionally, the input to ANN is received through an enormous number of processors working in parallel and organized in layers. The first tier gets the raw input data, which it processes using networked nodes and has their packages of knowledge and rules [23]. The second layer receives the processed input data. The processor sends it to the next rung of processing as an output. The output from each successive layer of processors and nodes is received and further processed by the tiers that come after it, rather than processing the raw data from the beginning over and again. In learning from their extensive initial training and then from the continual self-learning that they encounter because of digesting new information, neural networks adapt themselves. The practice of weighing input streams in favor of those that are more likely to be correct is an essential learning model that neural networks may use to improve their accuracy. Priority is given to the input streams with a more significant weight, the higher the weight, the greater the unit's impact on another unit in the system. By using gradient descent algorithms, the practice of eliminating predicted mistakes by weighing may be accomplished. Finally, output units are the final stage of the process; this is when the network reacts to the information entered and may be further processed [24].
Naïve Bayes
The Naive Bayes classification method is a probabilistic classifier that uses a random number generator. It is built on probability models that make substantial assumptions about independence from one another. In many cases, the independence assumptions have little effect on the actual situation. As a result, they are seen as being Naïve by others [25]. Using Bayes' theorem, you can create more accurate probability models (credited to Thomas Bayes). You may train the Naive Bayes algorithm in a supervised learning environment, depending on the nature of the probability model. In Info Sphere TM Warehouse, data mining for Naive Bayes models is based on the maximum likelihood method of parameter estimation. The Predictive Model Markup Language (PMML) standard creates the Naive Bayes model. A Naive Bayes model comprises a giant cube with the following dimensions on each side: The name of the input field, the value of the input field for discrete fields, or the range of values for continuous fields. The Naive Bayes method divides continuous fields into discrete bins based on the value of the target field. This implies that a Naive Bayes model keeps track of how often a target field value occurs in conjunction with a value of an input field value [16].
Random Forest
Random forest is a supervised learning technique that may be used to learn new things. The "forest" creates an ensemble of decision trees that are often trained using the "bagging" approach. The bagging approach is based on the premise that a mixture of learning models improves the overall outcome of the experiment. Random forest is a machine learning technique that is versatile and simple to use, and it consistently gives excellent results, even when no hyper-parameter tweaking is performed. It is also one of the most widely used algorithms due to its simplicity and range of applications (it can be used for classification and regression tasks). It is discussed in this article how the random forest method works, how it varies from other algorithms, and how to use it. Random forest features hyperparameters similar to a decision tree or a bagging classifier. Fortunately, there is no need to combine a decision tree with a bagging classifier since the classifier-class of random forest may be used instead. Using the method’s regressor may also deal with regression problems while employing the random forest technique. While the trees are developing, the random forest adds even more unpredictability to the model, increasing its overall randomness. To split a node, instead of searching for the essential feature, it searches for the best feature among a random subset of features. There is a great deal of variety, which generally results in a better model. As a result, when dividing a node in a random forest, splitting a node takes into account just a randomly selected subset of the characteristics. You may even make trees more random by utilizing random thresholds for each feature in addition to looking for the best possible thresholds for each feature, rather than searching for the best possible thresholds (like a standard decision tree does) [1,6,15,16].
Decision Tree
Intelligent Miner is capable of supporting a decision tree implementation for categorization purposes. To construct a decision tree, the Tree Classification method is employed. It is simple to comprehend and change decision trees, and the model that has been constructed may be stated as a collection of decision rules. It is possible to use this technique to scale well even in situations where there are many training examples and a significant number of characteristics in massive databases. Decision Tree Classification delivers output in the form of a binary tree-like structure, which is very simple to read for marketing personnel and allows for identifying relevant factors for churn management to be performed with relative ease. A Decision Tree model is a set of rules that may forecast the target variable. The Tree Classification approach gives a simple explanation of the underlying data distribution that is straightforward to grasp. Essentially, the idea is that by categorizing a more significant number of datasets, you would significantly enhance the accuracy of your classification model. In classification, the scenario is represented by a collection of sample records, referred to as a training set, where each record has several fields or characteristics. The attributes are either numerical (originating from an ordered domain) or categorical (originating from a definite domain or coming from an unordered domain). Class label field (target field) is one of the characteristics that specify which class an example belongs to. It is one of the attributes that is used to identify the class. Using the other features, the classification may be used to create a class label model, which can then be applied. After a model has been created, it may be used to identify the class label of records that have not yet been categorized.
Applications of categorization may be found in a wide range of industries, including retail target marketing, customer retention, fraud detection, and medical diagnosis, to name a few. Decision trees are one of the models that are especially well suited for data mining. Compared to other approaches, decision trees may be formed in a concise amount of time. Another benefit of decision tree models is that they are straightforward to comprehend. Decision trees are class discriminators that split the training set recursively until each partition is wholly or mainly composed of instances from a single class. It has been determined that each non-leaf node of the tree has a split point, which is a test on one or more characteristics that define how the data is partitioned. The tree is constructed by recursively splitting the data. After each partition becomes 'pure' (all members belong to the same class), or until each partition becomes suitably tiny, partitioning continues (a parameter set by the user). The first lists generated from the training set are associated with the decision tree's root node, represented by the arrow. To accommodate the tree’s growth and the splitting of nodes to produce additional children, the attribute lists for each node are partitioned and assigned to the children. The construction of a decision tree classifier is divided into two phases: After the original tree has been constructed (the 'growth phase,') a sub-tree with the lowest predicted error rate is constructed (the 'prune phase') after the initial tree has been constructed (the 'growth phase'). In the process of pruning the original tree, tiny, deep nodes of the tree that have formed because of the 'noise' present in the training data are removed.
This reduces the likelihood of 'overfitting' and results in a more accurate categorization of unknown data. While the decision tree is being constructed, the purpose at each node is to find the split attribute and the split point that will divide the training records about that leaf the most effectively and efficiently. The importance of a split point is determined by how well it divides the classes. Several splitting indices have been presented in the past to measure the quality of the split. The Gini index is used by Intelligent Miner [5,15,26]. The accuracy of an algorithm is the essential characteristic to consider when determining its degree of performance. Using the optimal model makes it possible to construct the best link between the independent and target variables and forecast new data more accurately. Accuracy is critical in any profession, such as decision-making in the corporate world. There are high cost, time, and resource differences that may be made by a single choice in that sector, among other things. As a result, the quality of the model constructed is critical in accurately forecasting previously unknown data with greater precision. The algorithms described above are the most widely used in machine learning. These strategies are employed in the datasets in all three tools, Orange, WEKA, and Rapid miner. Following the application of those algorithms, we will record the accuracy of those methods in a tabular format and attempt to draw some inferences from the results.
Related Work
Kumar Raj, et al. [27] used a variety of classification approaches on the datasets, including Naive Bayes and C4.5 classification, Apriori classification, K-nearest neighbor classification, AdaBoost classification, and others. The term "classification" refers to generalizing information derived from cases. This aids in the forecasting of future data. Zainal K, et al. [5] used a spam SMS dataset from the UCI repository and various clustering and classification techniques on the data, including support vector machine, naive Bayesian, k-nearest neighbor, k-means, hierarchical clustering, and cobweb clustering and classification. The algorithms mentioned above are applied to the SMS dataset using two separate data mining tools: WEKA and Rapid Miner. The results are derived by combining the results from both tools. The authors investigated the accuracy of the algorithms in those two tools. They determined which algorithm was the most appropriate for the data set in question and which tool provided superior accuracy compared to the other tool. Also, the author highlighted the processing time required to get results for the algorithms employed in both programs. This information helps determine which tool is most effective for obtaining rapid results for the specified dataset.
Naik, et al. [4] looked at a Liver Patient Dataset and analyzed the classification algorithms using five different data mining tools: Orange, Rapid Miner, Knime, Tanagra, and WEKA. The classification techniques are Decision tree, K-Nearest Neighbor, and Naive Bayes. They were applied to the specified dataset by the authors utilizing these tools and the selected dataset, and the results were reported. The authors drew certain inferences from the data produced, which were dependent on the correctness of the algorithm used in the tool. In their research, the authors focused on the efficiency of data mining tools, which means they looked at which tool provided the highest accuracy for the model. He listed the correctness of the algorithm in each tool in a tabular format, which allowed him to compare and analyze the findings. In their paper [28], Puyalnithi, Thendral, and colleagues picked two datasets from a repository and applied specific machine learning algorithms on them using the RapidMiner soft tool. The authors’ goal in this article was to determine a relationship between dataset size and classification accuracy, which classifier performs better for smaller datasets and better for more extensive datasets. According to the authors, the datasets were improved via boosting and bagging methods. That is also indicated in the analysis table of accuracy, recall, and precision of the algorithms for the datasets used in the study. At the end of the article, the authors draw some conclusions based on the data received from the tool. One of the outcomes is that naive Bayes classifiers perform better than the other classifiers when dealing with a smaller dataset. In other words, the accuracy of the Naive Bayes algorithm is inversely related to the quantity of the dataset being used.
Bin Othman and colleagues [29] researched the breast cancer dataset using various machine learning techniques. The authors of this work employed WEKA, the most widely used data mining tool on the market. On the breast cancer dataset, the following machine learning algorithms were used: Pruned Tree, Bayes Network, Nearest Neighbors Algorithm, Radial Basis Function, Single Conjunctive Rule Learner, and Single Conjunctive Rule Learner. Following such methods, the authors offered a review of the findings produced. The accuracy of the method and the time required for its execution were given in tabular form by the authors. Based on their findings, the authors found that the Bayes network algorithm is the most accurate method, with an accuracy of 89.71 percent for the breast cancer dataset on the WEKA tool. Chandra Prakash V. and colleagues [30] developed a model for predicting the proper employment based on psychological aspects that were appraised about the student. Using an N-Coin problem, we may assess the psychological aspects of the situation. Developing a cognitive model and forecasting the work [31]. The authors employed specific linear ranges to make their forecasts. Because of this, there is the possibility of utilizing any data mining tool instead of linear ranges, which would imply that developing the cognitive model and training all the cognitive models using any machine learning algorithm and doing the forecasting task might provide superior results.
Machine learning is commonly employed in medicine for the goal of diagnosing patients. This strategy can provide outcomes more quickly and effectively than the old way. Amin, Syed Umar, and colleagues [32] developed an intelligent system to predict heart disease based on various risk variables. The author gathered data from the patient that included certain risk variables such as smoking, drinking, blood pressure, and other characteristics and then trained the data. They will be able to determine the level of heart disease via this sort of study even before visiting the hospital and getting medical exams. The author built the classification technique in MATLAB, which also employed neural networks to make the classifications. It has been determined that the method devised by the author is 89 percent accurate. Johann Heinrichs, et al. [33] discussed the significance of data mining technologies in business to extract information. The author discussed web-based data mining techniques that may be used to enhance decision-making capabilities. Businesses that train their employees in knowledge extraction methods and data mining technologies may have a greater chance of success.
Accuracy Analysis
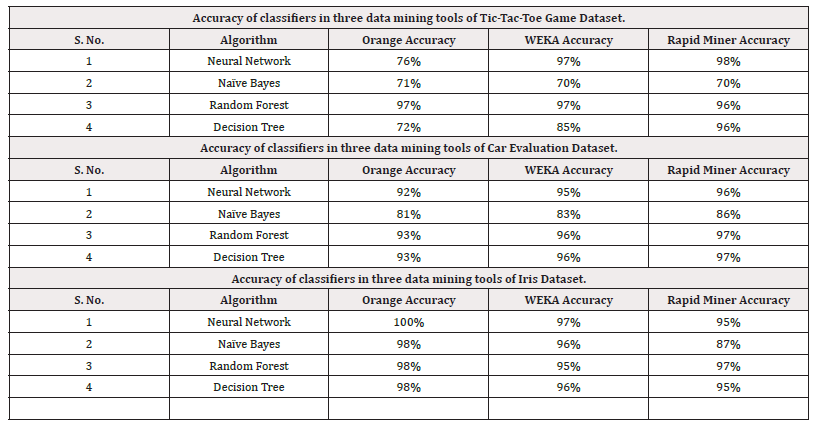
Tic-Tac-Toe Game, Car Evaluation, and Iris datasets are considered and applied in four different classification algorithms in three data mining tools (Orange, WEKA, and Rapid Miner). The accuracy of those models is mentioned in the table below (Table 1).
Result and Analysis
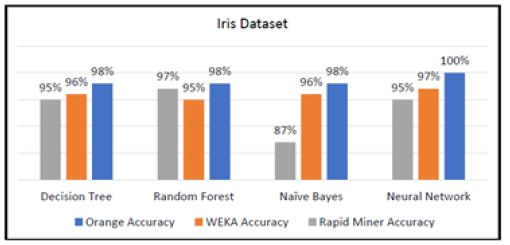
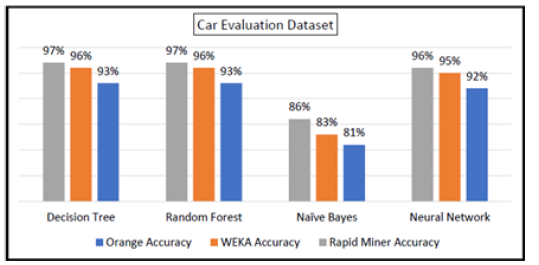
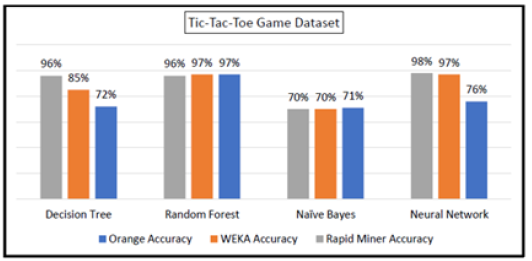
The data mining tools are analyzed through graphs as discussed below. Initially, the Iris dataset is considered and constructed by taking the accuracy of classifiers on the x-axis and four algorithms on the y-axis. The three curves in the graph represent three tools, i.e., Orange, WEKA, and Rapid Miner, as shown in Figure 5. Similarly, the remaining two datasets also represented the accuracy of their classification in four algorithms are represented in the below-represented graphs (Figures 5-7).
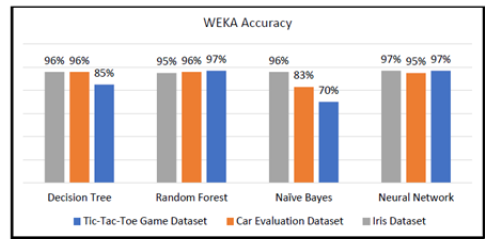
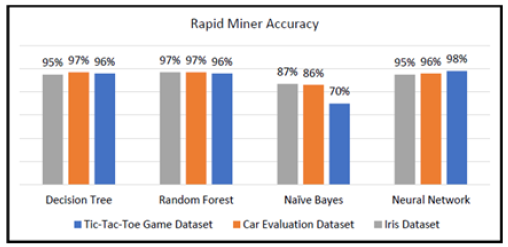
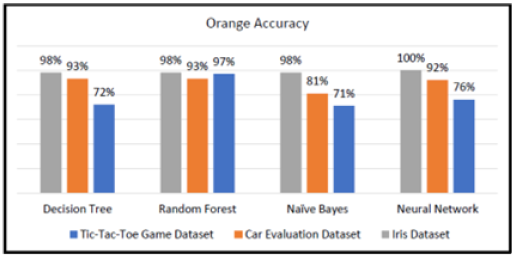
Figures 5-7 show that for any dataset among the three tools. The WEKA tool constructs the model with accuracy, which is consistent, meaning the WEKA line is approximately between the lines of the other two tools, Rapid Miner, and Orange, as can be seen in the graphs above (Figures 5-7). The Orange tool performs well with a dataset with few occurrences. As the number of occurrences in the dataset grows, the accuracy of the orange tool decreases because of this. RapidMiner is a program that generates high accuracy models as the number of instances in the dataset grows. Each tool is examined individually, and accuracy curves for datasets are shown on a graph for each tool. Four's methods are depicted on the x-axis in Figures 8-10, and the accuracy of classifiers is represented on the y-axis in these figures. A data mining tool is represented by three curves related to each other. Figure 8 depicts the WEKA tool, Figure 9 depicts the Rapid Miner tool, and Figure 10 depicts the orange tool (Figures 8-10).
We can see from the graph charts above (Figures 8-10) that the Iris dataset is categorized with high observed accuracy among other datasets in all three data mining algorithms, as shown in the figures. A few days after the Iris dataset, the automobile assessment dataset was categorized with a higher degree of accuracy than the Tic-Tac-Toe dataset. As a result, as the number of occurrences in the dataset grows, categorization accuracy drops, as seen in the graph.
Conclusion
According to the investigation results mentioned above, neural networks categorized the datasets with the highest accuracy in all three data mining tools compared to the other four methods. The Decision Tree is the most effective categorization strategy since it maintains some consistency across all tools. The accuracy of Nave Bayes classification increases as the number of occurrences in the dataset increases. The examined datasets are studied without considering the noise in the data; therefore, the findings may be consistent when all of the elements impacting the datasets considered, such as noise, are taken into account. This study may be enhanced by considering the noise in the data in further research, and some more tools can be explored since there are several data mining tools accessible in the machine learning field. That method may also aid in the improvement of the findings that have been reached before.
Acknowledgments
None.
Conflicts of Interest
None.
References
- J Teja, G Seshu, M Varma (2020) Relative Exploration of Classification Techniques of Machine Learning on Various Data Mining Tools. Journal of Xi’an University of Architecture & Technology 12(4): 5150-5156.
- IBP Jayawiguna (2020) Comparison of Model Prediction for Tile Production in Tabanan Regency with Orange Data Mining Tool. International Journal of Engineering and Emerging Technology 5(2): 72-76.
- AB Devale (2012) Applications of Data Mining Techniques in Life Insurance. International Journal of Data Mining & Knowledge Management Process 2(4): 31-40.
- K Zainal, N F Sulaiman, Zalisham Jali (2015) An Analysis of Various Algorithms for Text Spam Classification and Clustering Using RapidMiner and Weka. Int J Comput Sci Inf Secur 13(3): 66-74.
- A Naik, L Samant (2016) Correlation Review of Classification Algorithm Using Data Mining Tool: WEKA, Rapidminer, Tanagra, Orange and Knime. Procedia Computer Science 85(2): 662-668.
- An Orange, C Lueg, V Malhotra (2009) Using interactivity to help users understand the impact of spam filter settings. Proceedings of the ASIST Annual Meeting 46(3): 155-176.
- A Jović, K Brkić, N Bogunović (2014) An overview of free software tools for general data mining. 2014 37th International Convention on Information and Communication Technology Electronics and Microelectronics MIPRO 2014 Proceedings 1112-1117.
- J Demšar, B Zupan (2013) Orange: Data mining fruitful and fun - A historical perspective. Inform 37(1): 55-60.
- N Chandra, S Reddy, KS Prasad, A Mounika (2017) Classification Algorithms on Datamining: A Study. International Journal of Computational Intelligence Research 13(8): 2135-2142.
- M Gera, S Goel (2015) Data Mining _Techniques, Methods, and Algorithms: A Review of Tools and their Validity. Int J Comput Appl 113(18): 22-29.
- M Štajdohar, J Demšar (2013) Interactive network exploration with Orange. J Stat Softw 53(6): 1-23.
- Uzma Thange, Vinod Kumar Shukla, Ritu Punhani, Wonda Grobbelaar (2021) Analyzing COVID-19 Dataset through Data Mining Tool “Orange”. International Conference on Computation Automation and Knowledge Management 0-5.
- H Muneeb Ahmad, M Sohail, M Muneeb Ahmad, S Iqbal, A Sarfaraz, et al. (2020) Predictions of Pneumonia Disease using Image Analytics in Orange Tool.
- MS Kukasvadiya, D Nidhi, H Divecha (2017) Analysis of Data Using Data Mining tool Orange. International Journal of Engineering Development and Research 5(2): 1836-1840.
- An International, P Reviewed (2019) Orange Tool Approach for Comparative Analysis of Supervised Learning Algorithm in Classification Mining. J Anal Comput 13(1): 1-10.
- B Sarangam Kodati, R Vivekanandam, S Kodati α, R Vivekanandam σ (2018) Analysis of Heart Disease using in Data Mining Tools Orange and WEKA. 18(1).
- SB Jagtap, Kodge BG (2013) Census Data Mining and Data Analysis using WEKA. 35-40.
- Y Ramamohan, K Vasantharao, CK Chakravarti, SK Ratnam (2012) A Study of Data Mining Tools in Knowledge Discovery Process. International Journal of Soft Computing and Engineering 2(3): 191-194.
- Abdullah H Wahbeh, Qasem A Al-Radaideh, Mohammed N Al-Kabi, Emad Al-Shawakfa (2011) A Comparison Study between Data Mining Tools over some Classification Methods. International Journal of Advanced Computer Science and Applications 1(3).
- David J Armstrong, Maximilian N Günther, James McCormac, Alexis MS Smith, Daniel Bayliss, et al. (2018) Automatic vetting of planet candidates from ground-based surveys: Machine learning with NGTS. Mon Not R Astron Soc 478(3): 4225-4237.
- (2022) https://www.kaggle.com/.
- S Pang, A Du, MA Orgun, Z Yu (2019) A novel fused convolutional neural network for biomedical image classification. Med Biol Eng Comput 57(1): 107-121.
- LA Pastur-Romay, F Cedrón, A Pazos, AB Porto-Pazos (2016) Deep artificial neural networks and neuromorphic chips for big data analysis: Pharmaceutical and bioinformatics applications. International Journal of Molecular Sciences 17(8): 1-26.
- Chensi Cao, Feng Liu, Hai Tan, Deshou Song, Wenjie Shu, et al (2018) Deep Learning and Its Applications in Biomedicine. Genomics Proteomics and Bioinformatics 16(1): 17-32.
- N Nosiel, S Andriyanto, M Said Hasibuan (2021) Application of Nave Bayes Algorithm for SMS Spam Classification Using Orange. International Journal of Advanced Science and Computer Applications 1(1): 16-24.
- J Marrs, W Ni-Meister (2019) Machine learning techniques for tree species classification using co-registered LiDAR and hyperspectral data. Remote Sens 11(7): 1-18.
- R Kumar, R Verma (2012) Classification algorithms for data mining: A survey. International Journal of Innovations in Engineering and Technology 1(2): 7-14.
- T Puyalnithi, M Viswanatham, A Singh (2016) Comparison of Performance of Various Data Classification Algorithms with Ensemble Methods Using RAPIDMINER. Int J Adv Res Comput Sci Softw Eng 6(5): 2277.
- MF Bin Othman, TMS Yau (2007) Comparison of different classification techniques using WEKA for breast cancer. IFMBE Proceedings 15: 520-523.
- SU Amin, K Agarwal, R Beg (2013) Genetic neural network-based data mining in prediction of heart disease using risk factors. 2013 IEEE Conference on Information and Communication Technologies 1227-1231.
- V Chandra Prakash, JKR Sastry, B Tirapathi Reddy, JS Ravi Teja, AB Venkatesh, et al. (2019) An expert system for building a cognitive and career prediction model based on N-Coin puzzle game. International Journal of Emerging Trends in Engineering Research 7(11): 410-416.
- VC Prakash, JKR Sastry, G Reeshmika, M Pavani, PC Sree, et al. (2019) Development of a comprehensive and integrated expert system for career assessment based on cognitive models. Int J Emerg Trends Eng Res 7(11): 617-627.
- JH Heinrichs, JS Lim (2003) Integrating web-based data mining tools with business models for knowledge management. Decision Support Systems 35(1): 103-112.





 We use cookies to ensure you get the best experience on our website.