Research Article 
![]() Creative Commons, CC-BY
Creative Commons, CC-BY
Inference of Long-Term Outcomes and Overdiagnosis using the National Lung Screening Trial Data
*Corresponding author: Wu Dongfeng, Department of Bioinformatics and Biostatistics, School of Public Health and Information Sciences, University of Louisville, USA.
Received: April 13, 2024; Published: April 19, 2024
DOI: 10.34297/AJBSR.2024.22.002933
Abstract
We evaluate the long-term outcomes of lung cancer screening using a recently developed probability model and the National Lung Screening Trial chest X-ray data. We divided participants in the cancer screenings into four distinct groups: symptom-freelife, no-early-detection, true-early-detection, and overdiagnosis. We conducted simulation studies and applied Bayesian inference techniques, while considering factors such as age at study entry, screening frequency, sensitivity, and another relevant parameter. Our analysis revealed that the probability of overdiagnosis among the screen-detected cases started at a low level but increased as individuals’ age at their first screening advanced. Additionally, we found that male heavy smokers exhibited a greater susceptibility to overdiagnosis compared to females. However, it’s important to note that, the issue of overdiagnosis was minimal and not a major concern, particularly among heavy smokers who underwent chest X-ray screenings. In conclusion, this newly developed probability model provides policymakers with valuable insights into the distribution of individuals within the overdiagnosis and true-earlydetection groups. These insights are instrumental in helping policymakers mitigate the long-term consequences associated with frequent screenings for lung cancer, ensuring that screening programs are both effective and safe.
Keywords: Lung cancer screening, Sojourn time, Transition density, Overdiagnosis, Sensitivity
Introduction
Cancer screening may detect cancer at an early stage. By the time symptoms appear, cancer may have begun to spread. If any abnormalities in tissues or cancer can be found early, patients may have more choices for appropriate treatment and usually have a better prognosis, which could increase survival. According to the American Lung Association, lung cancer screening for heavy smokers has the potential to identify 80% of cases at an early stage when they are more likely to be curable. In contrast, without screening, approximately 70% of lung cancers are discovered at a later, less treatable stage [1]. Therefore, early detection can play a crucial role in reducing cancer mortality for lung cancer.
Lung cancer screening has a low radiation exposure risk, similar to other screening tests. The level of radiation exposure is slightly higher than that experienced by women during a mammogram [2]. While lung cancer screening holds the potential to reduce mortality, it may also identify tumors that would not cause clinical symptoms. Consequently, there is a need to quantify the long-term outcomes of repeated screening, particularly the probability of overdiagnosis. Overdiagnosis is a concern in lung cancer screening, as advanced imaging technologies can detect tiny lung nodules [3]. Despite these nodules being considered abnormal, their clinical significance remains uncertain. Therefore, overdiagnosis is a critical consideration when assessing the balance between potential benefits and harms associated with cancer screening, as it can lead to unnecessary treatment.
Overdiagnosis is essential for understanding early detection as it refers to a screening exam that detects a disease through a scheduled screening exam, but the clinical symptoms would not appear before death. There is much research on overdiagnosis based on observational studies, however, the results varied greatly due to a lack of modeling [4]. have developed a probability method for evaluating the long-term effects of cancer screening. They categorized all participants into four mutually exclusive groups: symptom-free-life, no-early-detection, true-early-detection, and overdiagnosis. The long-term effects of continued cancer screening can be evaluated by estimating the probability of each group and the risk of overdiagnosis among the screen-detected cases. Individuals participating in a screening program would eventually fall into one of the four mutually exclusive groups, and these probabilities vary with factors such as a person’s age at the study entry, screening frequency, screening sensitivity, and other parameters. Additionally, human lifespan is treated as a random variable and a competing risk factor for death from other causes. Here are the definitions of each group:
Group 1: Symptom-free-life (Symp F)-The participant went through the screening exams, but lung cancer was never detected, and ultimately, he/she died of other causes.
Group 2: No-early-detection (No ED)-The participant went through the screening exams, and the disease was revealed clinically but was not detected by scheduled screening exams.
Group 3: True-early-detection (True ED)-The participant was diagnosed with lung cancer at a scheduled screening exam, and his/her clinical symptoms would have appeared before his/her death.
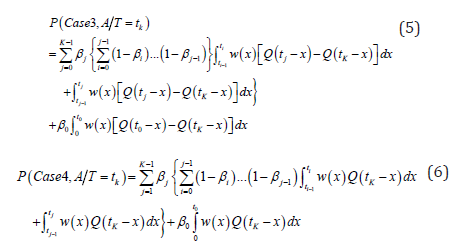
Group 4: Overdiagnosis (Over D)-The participant of the Group 4 was diagnosed with lung cancer at a scheduled screening exam, but his/her clinical symptoms would not appear before his/her death.
We will apply this method to the National Lung Screening Trial study using the chest X-ray data. We will briefly review the probability methods in Section 2, perform Bayesian inference on the conditional probabilities in Section 3, and provide a discussion of the outcomes in Section 4.
Materials and Methods
We will briefly review the National Lung Screening Trial (NLST) data and the probability method introduced in [4], which is based on the progressive disease model. This method will be applied to analyze the NLST chest X-ray data.
Materials
The National Lung Screening Trial, initiated by the National Cancer Institute in 2002 [5] was a randomized clinical trial designed to screen a high-risk population (i.e., heavy smokers) using either low-dose helical (spiral) Computed Tomography (CT) or standard chest X-ray (X-ray). In this study, we focus on the standard chest X-ray data, which includes two distinct groups: heavy-smoking males (15,396) and heavy-smoking females (10,634). The trial initially screened asymptomatic participants aged 55 to 74 from 33 centers across the United States between August 2002 and April 2004. Participants from both groups underwent three annual screening exams. To facilitate accurate estimation, the data were meticulously organized. For each participant, at each age upon study entry and for each screening event, we recorded the following information: the total number of individuals screened, denoted as ni; the number of screen-detected and confirmed cancer cases represented as si and the number of interval cases, labeled as ri, who had clinical cancer before the subsequent screening. There were 279 heavy smokers diagnosed with lung cancer at the scheduled screening, 165 males plus 114 females. There were 117 clinical incidence cases, 107 males and 70 females [5].
Methods
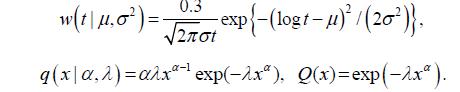
The progressive model assumes that the disease develops through three states S0→Sp→Sc, where S0 refers to the disease-free state, or the state in which the disease cannot be detected by screening. Sp is the preclinical state, in which an asymptomatic individual unknowingly has the disease that a screening exam can detect. Sc refers to the disease state at which the disease manifests itself in clinical symptoms. We let β(t) be the screening sensitivity at age t, i.e., the probability that the screening exam is positive given that the individual is in the preclinical state. Here t is the individual’s age at the exam. Define w(t)dt as the probability of a transition from S0 to Sp during t,t+dt). Let q(x) be the Probability Density Function (PDF) of the sojourn time in Sp, and let  be the survival function of the sojourn time. We define event
A = {A person is asymptomatic of lung cancer before and at }.
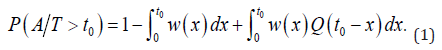
This is the requirement for entering the screening program. And the conditional probability of no symptomatic lung cancer before and at age t0, given that one’s lifetime T exceeds t0is:
For an initially asymptomatic individual taking K screenings at ages  . The conditional probability of each of the four groups, given that one’s lifetime
  , was derived as follows:

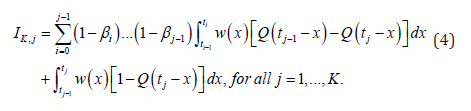
where IK,j is the probability of an interval case in  [18]:
[18]:
It was verified that for any screening number K ≥1 [4]:

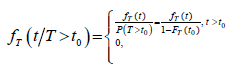
For a future screening schedule t <|t < ..., since we don’t know how long one will live, the screening number K = K(T) is a random variable changing with the lifetime T , and K = n if  . The probability of each case, when one’s lifetime T is longer than t0, would be:

for all i=1,2,3,4
where
 otherwise (9)
And it was proved that [4]:

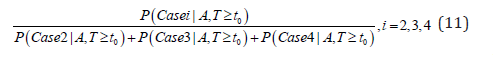
For those who would be diagnosed with cancer after one’s current age t0, including both screen-detected and interval incident cases, we can estimate the probability of the cases 2, 3 and 4 by this formular:
And for the screen-detected cases, we can calculate the conditional probability of overdiagnosis among the screen-detected cases by
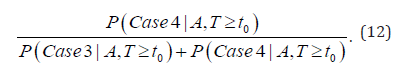
This probability is what causes much debate in the research community and the general public recently.
Result
We applied the methods in section 2 to the NLST chest X-ray data. The probability of each of the four cases was the function of the three key parameters β(t), w(t), and q(x), which were estimated from the NLST chest X-ray data in [6]. We used the estimated sensitivity β(t)=0.61 for male smokers and β(t)=0.62 for female smokers, and the parametric model for the transition density and sojourn time [6].
The unknown parameters were θ= (µ, σ2, α, λ) in the above model, and we have obtained 1500 Bayesian posterior samples of θ using a likelihood function and Markov Chain Monte Carlo simulations. For more details, see [6]. The posterior predictive probability of each case can be estimated using the NLST data by the following:

Where n=1500 is the posterior sample size and θ∗ is the 1500 MCMC posterior samples. Bayesian inference for three asymptomatic hypothetical cohorts with initial screening ages 55, 60, and 65 were carried out. For each age group, various screening frequencies were examined with screening intervals ∆=12, 18, 24 months. The number of screens  , the largest integer less than or equal to
  was a function of the lifetime T, a random variable.
We obtained the lifetime distribution data from the 2016 actuarial life table provided by the Social Security Administration [7]. This table, based on mortality statistics, offers the probability of death from age 0 to 119 for males and females separately. We estimated the conditional lifetime distribution  using the 2016 life table and the method in [8]. The resulting conditional density functions for the lifetime T for both males and females, are illustrated in Figure 1. These plots correspond to three different initial screening ages (t0) of 55, 60, and 65, and are independent of screening or specific causes of death.
The probabilities of each of the four cases P(Casei | A;T >t ;NLST) are reported in Table 1. The first column ∆ is the future screening interval in months. The next eight columns are the conditional probabilities (in percentage) of each case, corresponding to the probability of symptom-free-life, no-early- detection, true-early-detection, and overdiagnosis for male and female heavy smokers correspondingly.
The probability of symptom-free-life is high for all age groups, ranging from approximately 80% to 82% for males and around 80% to 83% for females. This means about 80% of the heavy smokers will not have clinical lung cancer during their lifetime. This probability slightly increases as the screening interval, or as the current age increases.
The probability of no-early-detection is 8.36%, 8.25%, and 8.02% for males, and 7.99%, 7.69%, and 6.91% for females, when participants initiate screening at ages 55, 60, and 65, respectively, using a 12- month screening schedule. This probability increases as the screening interval increases and decreases as the age at initial screening increases, except for case of males at the 18-months intervels.
The estimated probability of true-early-detection for initial screening ages 55, 60, and 65 is 10.72%, 10.32%, and 10.11% for males, and 11.10%, 10.76%, and 9.81% for females, respectively, when annual screening is conducted. It decreases with longer screening time intervals and as initial screening age increases. It seems that males have a slightly lower propensity for true-early-detection compared to females. The probability of overdiagnosis is very low across all three age groups. Specifically, for the 12- month screening interval and initial screening ages of 55, 60, and 65, the probabilities of overdiagnosis are approximately 0.33%, 0.38%, and 0.43% for males, and 0.23%, 0.24%, and 0.29% for females, respectively. It is worth noting that these probabilities decrease as the screening interval (∆) increases. While the probability of overdiagnosis is slightly higher when the initial screening age is 65, there is minimal difference observed for the other age groups. The results presented in Table 1 demonstrate that males exhibit a slightly higher susceptibility to overdiagnosis compared to females.
Boxplots of the results for the probabilities of each case when t0=60 for male and female are provided in Figures 2 and 3. In Figure 2, the probability of symptom-free-life (and the probability of overdiagnosis) are almost the same for the 12-month and the 18-month screening intervals, and it is slightly lower for the 24-month intervals. On the other hand, the probability of no-early detection increases monotonically with the screening time interval, while the probability of true-early-detection decreases monotonically with the length of the screening time interval. This pattern is the same for all the ages of screening for both males and females.

Figure 1: The conditional PDF of the lifetime of males and females derived from the life table when t0 = 55, 60, 65.

Table 1: A projection of lung cancer screening effects of male and female using the NLST chest X-ray data.
Note*:  is the planned time interval between screens in the future.
bThe mean probability and it’s standard error (in parenthesis) are reported as percentages in the table.

Figure 2: The boxplot of the estimated probability of male for each case with t0 = 60.

Figure 3: The boxplot of the estimated probability of female for each case with t0 = 60.
The conditional probabilities were evaluated for cases 2, 3, and 4, given that the person was diagnosed with cancer, which is calculated using equation (11). The probabilities are reported as percentages in Table 2. The probability of overdiagnosis is 1.61%, 1.94%, and 2.29% for males, and 1.13%, 1.19%, and 1.50% for females, in the 12-month screening group when the starting age is 55, 60, and 65, respectively. The conditional probability of true-early-detection, given a diagnosed case, decreases significantly as the screening interval ∆ increases. It ranges from around 56% to 38% in the 60-year-old male group and from around 58% to 38% in the 60-year-old female group. Conversely, the conditional probability of no-early-detection increases within each age group as the screening interval increases.
The probability and its 95% HPD intervals of true-early-detection and overdiagnosis, given it is a screen-detected case, are listed in Table 3, which is calculated by equation (12). This (conditional) probability of overdiagnosis is at the center of hot debate among research community and general public. For males, the percentage of overdiagnosis is 3.87%, 4.26%, and 5.12% for different screening ages with a 24-month screening interval, which is higher than any other age group and screening interval. For females, the percentages are 2.43%, 2.71%, and 3.46%. In summary, the probability of overdiagnosis is much lower than expected, while the probability of true-early-detection is often above 94% and higher. The length of 95% Highest Probability Density (HPD) interval for these two probabilities (percentages) decreases as the screening interval increases. However, these credible interval lengths increase as the initial screening age increases (Table 2,3).

Table 2: The estimated probability of male and female given that it is a diagnosed cancer case.
Note*:c he estimated conditional probability was calculated as  i=2, 3, 4, for each of the 1500 posterior samples, then averaged. It is in percentage.
dThe event D= {Diagnosed cases: including both interval incident and screen-detected cases}.

Table 3: The estimated probability of male and female for the screen detected cases with 95% credible Interval.
Note*:d The estimated conditional probability was calculated as  i=3, 4, for each of the 1500 posterior samples, then averaged. It is in percentage.
eThe event ScrD= {Screen-detected case}.
Discussion
In this study, we aimed to assess the long-term outcomes of lung cancer screening using chest X-rays. Asymptomatic participants in the screening program were eventually separated into four distinct groups: symptom-free-life, no-early-detection, true-early-detection, and overdiagnosis based on their diagnosis status and disease status. Our analyses provide policymakers with valuable estimates of the probability of true-early-detection, overdiagnosis, and other relevant outcomes that arise from a periodic lung cancer screening program. To address uncertainty and calculate variations, we used the Bayesian approach, which allows for the estimation of credible intervals (percentages).
On March 9, 2021, the U.S. Preventive Services Task Force released [9] new recommendations endorsing annual screening for lung cancer using Low-Dose Computed Tomography (LDCT) for individuals aged 50 to 80 years who have a 20 pack-year smoking history and currently smoke or have quit within the past 15 years. Based on data from the NLST chest X-ray, our findings indicate a high probability of symptom-free-life, ranging from 78% to 82% for all participants, i.e., heavy smokers. Additionally, the probability of overdiagnosis is very low, less than 0.43%, among all participants, regardless of gender (as shown in Table 1) for annual screening. The estimated rates of overdiagnosis in the 55-year-old cohort are as follows: for males, the rates are 2.94% if screenings are conducted annually and 3.87% if screenings occur every other year (as shown in Table 3). These estimates come with a 95% Highest Posterior Density (HPD) interval ranging from 2.69% to 5.16%. Comparatively, for females in the 55-year-old cohort, the rates of overdiagnosis among screen-detected cases are 1.75% if screenings take place annually and 2.43% if screenings happen every other year. It’s important to note that the overdiagnosis rates are lower for females than for males. Additionally, as individuals age, the probability of overdiagnosis increases for both males and females, even among those cases detected through screening.
The probability of symptom-free-life can be calculated as the complement of the lifetime risk. According to [10], the lifetime risk of developing lung cancer is 17.2% for male current smokers and 11.6% for female current smokers. However, the risk is substantially reduced for individuals who have never smoked regularly. For the 55-year-old age group, the estimated probability of symptom-free-life is approximately 80.49% for males and 80.64% for females, which aligns with the accepted lifetime risk. This probability indicates the likelihood of remaining free of symptoms throughout one’s life.
In a study by [11], it was found that 26% of individuals selected for screening based on USPSTF criteria had risks below the threshold defined by the PLCOm2012risk lung cancer risk prediction model. This model, derived from the Prostate Lung Colorectal and Ovarian Screening (PLCO) study, assesses the risk of lung cancer based on various factors. For former smokers with a quit time of more than 15 years, 8.5% had risks exceeding the threshold. Notably, the risks of lung cancer were significantly higher in PLCO smokers aged 65-80 years compared to those aged 55-64 years. In the study by [12], which analyzed NLST CT scan data for lung cancer, they found that the probability of overdiagnosis increases with age. Specifically, the probability ranged from 3% to 9% when individuals aged from 60 years to 80 years. This suggests that older individuals have a higher risk of being over diagnosed [13]. conducted a research study on screening with Low-Dose Computed Tomography (LDCT) for lung cancer. They reported that the probability of overdiagnosis was 18.5% (95% CI, 5.4%-30.6%) for any lung cancer detected by LDCT screening [3]. Identified 46 cases of overdiagnosis (0.75%) among 6,101 patients in the incidence follow-up of the Mayo Lung Project. This finding further supports the existence of overdiagnosis in lung cancer screening. [14] investigated the risk of overdiagnosis through the detection of lung cancer using chest X-ray and/or sputum cytology. They found that approximately 51% of cases (46 in 90) may be attributed to overdiagnosis. [15] analyzed different birth cohorts and their rates of overdiagnosis in screen-detected lung cancer cases. They observed that the 1950 birth cohort had a higher rate of overdiagnosis (10.5%) compared to the 1990 birth cohort (5.9%) using the cumulative excess-incidence approach. [16] reported that 6.75% of all screen-detected cases in the chest X-ray arm and 8.62% of all screen-detected cases in the CT arm of the NLST were considered over diagnosed. These percentages were relatively low, considering that approximately 75% of NLST participants were younger than 65, suggesting a lower potential for overdiagnosis in that particular population.
Late diagnosis might be one of the reasons for failure among patients. Early detection is necessary as lung cancer may remain incurable for patients in the advanced stage at diagnosis. Early detection trials proved a 20% reduction in lung cancer-related mortality by screening high-risk individuals with low-dose computed tomography [17]. In [18], they analyzed the NLST CT scan data for lung cancer and found that the probability of true-early-detection depends more on future screening interval and the current age than on the past screening interval and the probability of true-early-detection would decrease to about 75% if the future screening interval changes from annual to biennial. Probability model to early-detection could prove major advancement as it addresses sojourn time (time duration in preclinical states) and transition into preclinical state. Most of the recent research dealt with overdiagnosis alone. In contrast, long term effects associated with the outcomes from true-early-detection, no-early-detection, screen-diagnosed, screen-detected cases were considered along with overdiagnosis in this research. Very few studies had dealt with probability modeling while evaluating overdiagnosis. Most of the studies relied on other characteristics, such as tumor size, cancer stage, cancer growth rate etc. It is necessary to develop better estimates of overdiagnosis, because at the time of screening, clinicians do not know which patients have been over diagnosed. They tend to treat all of them. Thus, overdiagnosis is associated with the problem of escalating healthcare costs. Even patients cannot benefit from unnecessary treatment, instead it is harmful. In this case, accurate estimation of the sensitivity, sojourn time, and the transition probability are very crucial. Apart from screening history and smoking status, other risk factors, such as family history, genomic aspects, inhalation of hazardous chemicals, etc. can be considered for future research.
Acknowledgement
This research was supported by NIH/NCI 1R15CA242482 (Wu). We authors thank the National Cancer Institute (NCI) for access to the NCI’s data collected by the NLST team. The statements contained herein are solely those of the authors and do not represent or imply concurrence or endorsement by the NCI.
Conflict of Interest
The authors declare that they have no conflict of interest.
References
- (2022) American lung association. ALA.
- Hendrick RE (2010) Radiation doses and cancer risks from breast imaging studies. Radiology 257(1): 246-253.
- Marcus PM, Bergstralh EJ, Zweig MH, Harris A, Offord KP, et al. (2006) Extended lung cancer incidence follow-up in the Mayo lung project and overdiagnosis. J Natl Cancer Inst 98(11): 748-756.
- Wu D, Kafadar K, Rosner GL (2014) Inference of long-term effects and overdiagnosis in periodic cancer screening. Statistica Sinica 24(2): 815-831.
- Team NLSTR, Denise R Aberle, Christine D Berg, William C Black, Timothy R Church, et al. (2011) The national lung screening trial: overview and study design. Radiology 258(1): 243-253.
- Rahman F, Wu D (2021) Inference of sojourn time and transition density using the NLST X-ray screening data in lung cancer. Med Res Arch 9(5).
- (2020) Social security administration (SSA). NIH.
- Wu D, Kafadar K, Rosner GL, Broemeling LD (2012) The lead time distribution when lifetime is subject to competing risks in cancer screening. Int J Biostat 8(1).
- (2021) Lung cancer screening. USPSTF.
- Villeneuve PJ, Mao Y (1994) Lifetime probability of developing lung cancer, by smoking status, Canada. Can J Public Health 85(6): 385-388.
- Tammemaegi MC, Church TR, Hocking WG, Silvestri GA, Kvale PA, et al. (2014) Evaluation of the lung cancer risks at which to screen ever-and never-smokers: screening rules applied to the PLCO and NLST cohorts. PLoS Med 11(12): e1001764.
- Wu D, Liu R, Levitt B, Riley T, Baumgartner K, et al. (2016) Evaluating long-term outcomes via Computed Tomography in lung cancer screening. J Biom Biostat 7(313): 2.
- Patz EF, Pinsky P, Gatsonis C, Sicks JD, Kramer BS, et al. (2014) Overdiagnosis in low-dose computed tomography screening for lung cancer. JAMA intern Med 174(2): 269-274.
- Welch HG, Black WC (2010) Overdiagnosis in cancer. J Natl Cancer Inst 102(9): 605-613.
- Blom EF, Ten Haaf K, de Koning HJ (2020) Trends in lung cancer risk and screening eligibility affect overdiagnosis estimates. Lung Cancer 139: 200-206.
- Ten Haaf K, de Koning HJ (2015) Overdiagnosis in lung cancer screening: why modelling is essential. J Epidemiol Community Health 69(11): 1035-1039.
- Vansteenkiste J, Dooms C, Mascaux C, Nackaerts K (2012) Screening and early detection of lung cancer. Ann Oncol 10:x320-x327.
- Wu D, Rosner GL, Broemeling LD (2007) Bayesian inference for the lead time in periodic cancer screening. Biometrics 63(3): 873-880.


 We use cookies to ensure you get the best experience on our website.