Research Article 
 Creative Commons, CC-BY
Protective Lung Ventilation Procedure during General Anaesthesia Reduces the Incidence of Pulmonary Complications After Abdominal Surgery
*Corresponding author: Maša Kontić MD, General Hospital Zabok, Department of Anaesthesia and IC, Bračak 8, 49210 Zabok, Republic of Croatia.
Received: April 04, 2024; Published: April 15, 2024
DOI: 10.34297/AJBSR.2024.22.002923
Abstract
Anesthetic effects, surgery, and invasive mechanical intubation can impair respiratory function during general anaesthesia. The risk factors for Postoperative Pulmonary Complications (PPCs) include the type of surgery and duration, ventilation-perfusion discrepancy, and the presence of pain. Mitigating PPCs under anaesthesia is a goal, but effective strategies are yet to be defined. Conventional Ventilation (CV) procedure uses more inspired oxygen during pre-oxygenation and anaesthesia maintenance. The Protective Lung Ventilation (PV) procedure, on the other hand, includes high positive end-expiratory pressure, lung recruitment manoeuvre, oxygen saturation levels above 94%, lower inspired oxygen levels, and continuous positive airway pressure before the tube is removed. In this study, 56 consecutive patients undergoing abdominal surgery were randomly assigned, with 30 in the CV and 23 in the PV group, while 3 were lost during the follow-up. Using optimized protective lung ventilation in the PV group showed a non-significant mean arterial pressure reduction during surgery compared to the CV group and led to a significant decrease five days after surgery. Bicarbonate concentrations varied significantly between groups, with values in the PV group closer to normal levels five days post-surgery. The mean extubation time in the PV group was non-significantly shorter. Patients from both groups spent similar amounts of time in the ICU and hospital, but substantially fewer PV patients needed intensive care after the operation. We concluded that the implementation of protective lung ventilation strategies has the potential to reduce the occurrence of PPCs, recommending these strategies be adopted as the standard practice in general anaesthesia.
Keywords: General anaesthesia, Intraoperative complications, Postoperative complications, Lung recruitment procedure during general anaesthesia, Therapeutic positive-pressure respiration
Introduction
The most prevalent problems following surgery in general anaesthesia are postoperative hypoxemia (a decrease in the Partial Pressure of Oxygen in the blood [PaO2] with haemoglobin oxygen saturation <90%) and Postoperative Pulmonary Complications (PPCs). In one large study encompassing 833 patients, 21% of them encountered one or more episodes of hypoxemia for 10 minutes or longer after noncardiac surgical procedures [1]. The presence of hypoxemia, in the absence of any additional problems, has been observed to have a significant impact on the clinical outcome, leading to an extended duration of hospitalization, a higher likelihood of re-admission to the Postanesthesia/Intensive Care Unit, and increased mortality rates [2,3]. With an incidence of between 0.8% and 6.9%, the pathophysiological mechanisms of PPCs include atelectasis, ventilator-induced lung injury (VILI), hypoventilation (respiratory rate <8 breaths/min or arterial carbon dioxide pressure [PaCO2] >50mmHg) or upper-airway obstruction (laryngospasm or stridor), imbalances in ventilation and perfusion distribution, and pulmonary edema [2-4].
In patients undergoing surgery under general anaesthesia, it is important to consider the parameters of mechanical ventilation, as lung recruitment and oxygenation may critically depend on them. An alveolar Recruitment Maneuver (RM) is a sustained increase in airway pressure with the goal of opening collapsed alveoli, after which sufficient Positive End-Expiratory Pressure (PEEP) must be applied to keep the lungs open. Besides improving oxygenation, RM serves as part of a lung protection strategy and is also beneficial in improving lung mechanics through better distribution of ventilation and oxygenation within the lungs and enhancement of lung compliance. These effects in turn prevent or mitigate PPCs. Mechanical ventilation encompasses several key parameters, of which ventilation settings, respiratory volume, and Positive End-Expiratory Pressure (PEEP) are the most important. Based on previous findings, it is established that individuals with a breathing tidal volume (Vt) of about 6-8ml/kg of predicted body weight and PEEP of 5 cm H2O experience a reduction in atelectasis and an improvement in oxygenation [5]. Individual RM should last as short as possible (minimum is 7-8seconds, but sometimes 15-40seconds is needed), whereas the PEEP levels during the recruitment maneuvers should be higher than the baseline PEEP used in mechanical ventilation, typically in the range of 10-20cm H2O or sometimes even higher depending on the patient's condition, lung compliance, and the clinical situation, to keep lungs open and alveoli stretched [5,6]. To keep the lungs aerated once the RM procedure is completed, to prevent barotrauma and VILI, the PEEP level should be adjusted to a lower value, typically between 5 and 10cm H2O, but sometimes a slightly higher than baseline PEEP is needed (8 cm H2O or some other carefully adjusted level that optimizes the patient's oxygenation and pulmonary compliance while avoiding excessive pressure on the lungs). Namely, higher PEEP pressure may be associated with an observed increase in the concentration of inflammatory molecules, pulmonary edema, and alveolar overstretching. Such a sequence of events could result in hypoxia and pulmonary injury. Conversely, a decrease in respiratory volume has been observed to have beneficial effects, including reduced inflammation, improved lung mechanics, and limitation of excessive stretching of the alveoli [5,6]. In the case of the occurrence of atelectasis, inflammation of the lung parenchyma, and hypoxia with mechanical ventilation with lower respiratory volumes raise questions about the severity of these clinical conditions. The implementation of a high PEEP has been found to effectively mitigate the occurrence and progression of atelectasis, while also enhancing arterial oxygenation (P/F oxygenation index = arterial pO2/FiO2 [fraction of inspired oxygen that the patient is receiving expressed as a decimal number, e.g. 40% oxygen is 0.40 {a P/F ratio less than 300 indicates acute respiratory failure}]) and pulmonary compliance (compliance of the respiratory system, Crs) [6]. However, although in the majority of trials, the higher levels of PEEP were associated with improved Crs, better oxygen parameters, and mitigation of VILI and barotrauma, it is important to note that high levels of PEEP (>12 cm H2O) can also compromise hemodynamics, especially in very obese patients [7,8] and in animal models were shown to be associated with the occurrence of hypotension, a reduction in cardiac output, or development of hyperlactatemia [9].
The significance of positive pressure ventilation, i.e. the application of higher PEEP was first recognized in 1952 when it played a crucial role in reducing mortality rates associated with respiratory failure during the Danish poliomyelitis pandemic [10]. Ever since the implementation of this clinical practice has resulted in the preservation of numerous lives by enabling better critical care and safe surgical treatment under general anaesthesia. However, with the advent of computerized tomography (CT) in the 1970s, it has been established that positive pressure breathing itself has the potential to induce some pulmonary damage too [11-13]. According to a recent editorial, the reason for this shortcoming in the application of PEEP during general anaesthesia can be ascribed to two main mechanisms: 1) overdistension of alveoli due to large tidal excursions between breaths, and 2) smaller functional lung size because some of the airspaces become atelectatic, consolidated, or flooded with edema thus reducing functional residual capacity [14]. Overdistension of alveoli and excessive PEEP generated by the ventilator may create positive (or at least less negative pressure) in the alveolar space and thoracic cavity, which may increase the right atrial pressure and decrease venous return to the heart, in turn generating a decrease in preload and potentially reducing cardiac output. If a patient’s compensatory response by increasing systemic vascular resistance is not adequate, this will cause a drop in Mean Arterial Pressure (MAP), which happens especially in inadequately hydrated patients. If the increase in MAP occurs due to pain, stress, or other factors related to the surgical or critical care situation, the anaesthesiologist may again consider decreasing the pressure of PEEP. As to the second mechanism, if the pressure setting on the ventilator is too high or if the patient’s lungs are not compliant (elastic enough), the mechanical forces exerted by the ventilator may cause barotrauma, particularly when using PEEP above 12cm H2O. As a potential consequence of both of the aforementioned mechanisms, even though modifying PEEP based on respiratory mechanics is a quite straightforward technique, its effectiveness in reducing PPCs remains relatively unpredictable. As the number of surgical procedures performed exceeds 313million individuals annually, of which over 20 million are in the European Union [15], mitigating adverse pulmonary outcomes represents an important issue to be resolved. Additionally, despite accumulated knowledge and careful monitoring, sometimes an anaesthesiologist is still unable to entirely avoid the occurrence of atelectasis, a common phenomenon observed during general anaesthesia. Altogether, it can be concluded that the effects of mechanical ventilation and oxygenation over an extended period are not yet well understood, particularly regarding the impact of reducing tidal volume and using higher PEEPs.
After studying in great detail how to interpret the protective role of higher PEEP and reduced tidal volume on the development of hypoxia and PPCs, Bluth and colleagues also concluded that this problem is still unresolved and designed a protocol for a randomized controlled trial [8]. They suggested that by observing the ventilation settings of respiratory volume from 6 to 10ml/kg of body weight and PEEP from 5 to 8 cm H2O, the primary outcome in the first hour after surgery should be measured through the saturation and inspiratory oxygen concentration ratio. Secondary outcomes should include time-dependent oxygenation, postoperative duration of hospital treatment, and the total number, severity, and duration of PPCs. When determining how each variable affects the outcome, the study's design is crucial since it provides a much more detailed justification for the decisions that had been taken. A crossover design should be utilized in addition to the randomization procedure to properly address outcome variability. Therefore, Bluth and colleagues suggest that each patient within the group should be associated with a certain procedure sequentially to avoid seasonal effects. With these recommendations in mind, and by incorporating the recommendations of Bluth, et al. [8] (crossover design, randomization, and sequential association), the main aim of the present study was to compare the influence of the application of two different mechanical ventilation intraoperative lung ventilation strategies, conventional (standard) procedure (CV group of patients) and protective (extended and optimized) procedure (PV group of patients), on respiratory and hemodynamic parameters during general anaesthesia. Our specific objectives were to compare the impact of the application of these two different lung ventilation procedures on
1) hemodynamic parameters, such as the mean arterial pressure, systolic and diastolic pressure, and pulse;
2) the occurrence of early PPCs such as hypoxemia, hypercapnia, hypocapnia, lactacidemia, metabolic acidosis or alkalosis;
3) the appearance of late PPCs such as an increase in inflammatory parameters (C-reactive protein concentration in blood) and clinical and X-rays signs of pneumonia, and their influence on
4) rate of ICU admission and duration of intensive care and overall hospital stay after the surgery.
Subjects and Methods
This study was a prospective, single-center, randomized controlled, patient- and evaluator-blinded clinical investigation with a two-arm parallel design to assess the advantage of the protective (optimized) ventilation procedure (PV group of patients) compared to the conventional (standard) method of lung ventilation (CV) during general anaesthesia. The primary outcome was the incidence of early (within the first 5 postoperative days) and late PPCs (after the fifth day post-surgery), where the end of the fifth day is defined as the boundary between the early and late periods based on the clinical experience of many experts and their recommendation [16,17].
The study was conducted at the General Hospital “Dr. Ivo Pedišić” in Sisak (Croatia). Upon patient enrollment using strict inclusion and exclusion criteria described below, and after loss due to follow-up, fifty-three subjects were included in the study for 19 months: from March 2015 to September 2016. The inclusion period of two years was foreseen by the planned speed of inclusion of the patients in the study. The local Ethics Committee of the General Hospital "Dr. Ivo Pedišić" in Sisak, Croatia, approved the study protocol on March 24, 2015 (Case no. 2176-125-04-2516-2/15), as well as the informed consent form, where aims of the research were explained to the participants in the study. To report the results of the study in the doctoral thesis of the first author, ethical permission was again requested and approved by the Central Ethics Committee of the University of Zagreb Medical School (Case no. 380-59-10106-21-111/148, Class 641-01/21-02/01 from June 29, 2021).
The inclusion criteria were as follows: subject status according to the American Society of Anaesthesiologists Association classification ASA I (normal healthy patients, i.e. patients without associated comorbidities) or ASA II (patients with mild systemic disease, such as well-controlled hypertension), normal heart and lung function, both sexes, non-smokers, normal X-ray findings for heart and lungs, age 18–65 years, planned operation of medial laparotomy for colorectal cancer with a minimum duration of anaesthesia of at least one hour, signed informed consent. In the case of hypertension in ASA II patients enrolled in the study, by examining the self-monitoring diary for the past three months [18], there was no increase in systolic pressure more than 20 mmHg from the average daily value and no increase in diastolic arterial pressure more than 10 mmHg from the average daily value. In the case of diabetes type II in ASA II patients enrolled in the study, the HbA1c values were not higher than 7% while taking oral hypoglycaemic drugs and having a regulated diet. The patients enrolled also had no complications or episodes of hypoglycaemia in the past three months, as described by Gropper, et al. [18]. In the case of thyroid disease in ASA II patients enrolled in the study, values of TSH, fT3, and fT4 in the period up to 6 months since the last examination were normal.
Exclusion criteria were as follows: ASA III (patients with severe systemic disease that is not life-threatening but with substantive functional limitations) or higher (ASA IV-VI), positive history of lung diseases, heart failure according to New York Heart Association classification NYHA III (marked limitation in activity due to symptoms, even during less-than-ordinary activity, e.g. walking short distances of about 20-100 m and being comfortable only at rest) and NYHA IV stages (severe limitations; these mostly bedbound patients experience symptoms even while at rest), body mass index greater than 40, sleep apnea diagnosis, hypoxemia with oxygen partial pressure less than 8 kPa, hypoxia with peripheral saturation less than 92%, hypercarbia with carbon dioxide partial pressure greater than 6 kPa, intrinsic PEEP greater than 3 kPa, postoperative complications such as acute heart attack, haemorrhagic shock, the existence of other inflammatory foci and prolonged mechanical ventilation. In both groups of subjects, the same preparation for surgery and anaesthesia was used. The subjects enrolled in the study were randomly divided into two groups. In contrast to anaesthesiologists, other staff members were unfamiliar with and unaware of the protective ventilation procedure being performed. In group 1 (CV group), a standard lung ventilation procedure was applied, and the group consisted of 30 subjects. In group 2 (PV group), an extended and carefully optimized procedure of protective lung ventilation was applied. The PV group consisted of 23 subjects (Figure 1).

Figure 1: Flowchart of study randomization, allocation, follow-up, and analysis. CV, conventional (standard) ventilation group; PV, protective (extended and optimized) ventilation group.
Subjects
The study included 24 male and 29 female subjects. Eighteen male and 12 female patients were selected by randomization for the conventional ventilation procedure (the CV group). Protective Ventilation (PV) was assigned to six male and seventeen female patients undergoing general anaesthesia. The proportion of male patients in the CV group was significantly higher compared to the PV group (Pearson's =6.04, df=1, P=0.014). All patients gave informed consent for participation in this study. The demographic and anthropometric characteristics of patients according to the group assigned, as well as their ASA status and comorbidities (COPD), are given in Table 1.
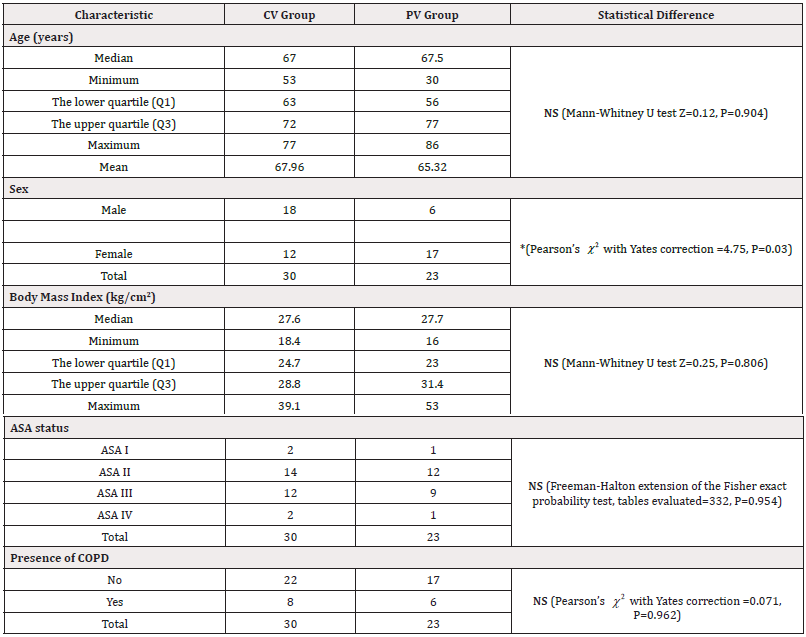
Table 1: The demographic and anthropometric characteristics of the patients included in the study, as well as their ASA status and comorbidities (COPD).
Of the 30 patients from the CV group, 19 had arterial hypertension, 10 had diabetes, 8 had COPD, 6 had cardiomyopathy, 5 had coronary heart disease, 5 had asthma, and 4 had thyroid disease. Of the 23 patients from the PV group, 18 had arterial hypertension, 6 had COPD, 6 had asthma, 3 had cardiomyopathy, 3 had diabetes, 3 had thyroid disease, 1 had coronary heart disease, and 1 had depression.
Methods
In the CV group of patients, the conventional (standard) method of lung ventilation was applied and consisted of preoxygenation with 100% oxygen for 3 minutes, endotracheal intubation, and volume-controlled mechanical ventilation with respiratory volume values of 6-8 ml/kg and breathing frequency 10-12 per min, and carbon dioxide partial pressure values were maintained in the range of 4.6-6 kPa to maintain normocarbia. For the sake of normal gas exchange, the ratio of inhalation to exhalation was maintained at 1:2 while maintaining anaesthesia with inspiratory oxygen concentrations of 50%, which maintained the target peripheral saturation above 94% and peak airway pressure values up to 40 kPa.
The procedure of protective lung ventilation in the PV group of patients included preoxygenation with 60% oxygen in a mixture with air for 3 min, which maintained the target peripheral oxygen saturation at values above 94%, endotracheal intubation, volume-controlled mechanical ventilation, a tidal volume of 6 ml per kg of body weight. Normocarbia during the protective ventilation procedure was maintained by adjusting the minute ventilation, which is the product of the respiratory rate (12-14 breaths per minute) and the tidal volume set to 6 ml/kg of body weight. The most critical variable for the adjustment was the inhalation-exhalation ratio of 1:2, which ensured adequate oxygenation and removal of carbon dioxide during anaesthesia. Identically as in the PV group, the target peripheral saturation was kept above 94% with an inspiratory oxygen concentration of 50% and peak airway pressure values of up to 40 kPa. However, in the PV group, the protective ventilation of the lungs also included the procedure of opening the alveoli (recruitment maneuver, RM). In every patient undergoing the PV procedure, the RM was performed twice. The first instance occurred following the administration of anaesthesia, with a FiO2 value of 50% (0.5). The second instance took place shortly before extubation. RM consisted of maintaining an airway pressure of 40-45 kPa for 40 s [19], which keeps the collapsed alveoli open and corresponds to maximum spontaneous inhalation. The specified pressure of PEEP during RM refers to conditions where hemodynamic stability is achieved i.e., without the presence of hypotension and desaturation (oxygenation below 92%). During anaesthesia in the PV procedure, PEEP was set at 7 kPa, but just before the extubation and awakening, patients were switched to spontaneous breathing the PEEP was set to 10 kPa. In this way, there was no additive effect of positive pressure, just an addition of 3 kPa positive airway pressure was applied to keep current alveoli open continuously and possibly recruit some new ones in that short period, which corresponds to the stochastic model of respiration (described in the Discussion section).
For patients from both CV and PV groups during the postoperative period, supplemental oxygen support was increased to maintain saturation above 92%. In the first phase immediately after the end of the operation, the level of consciousness, physical activity, blood pressure, heart rate, respiration rate, oxygen saturation, pain sensation, postoperative nausea and vomiting, temperature, and bleeding were monitored. No scoring criteria were used neither for the mentioned variables nor for the need for oxygen therapy. The point-scoring system was used only for the degree of oxygen saturation. With 2 points we scored the condition of the patient in which the oxygen saturation was above 92% while the patient was on oxygen therapy and had an opportunity to self-administer analgetics (patient-controlled analgesia, PCA), with 1 point we assessed the condition in which the oxygen saturation was above 92% without oxygen therapy but the i.v. PCA was available, and with 0 points when saturation was below 92% despite oxygen therapy.
During the anaesthesiology procedure, the hemodynamics of both groups of patients were monitored. Invasive hemodynamic monitoring included measuring systolic, diastolic, and mean blood pressure, as well as watching the heartbeat. Neuromuscular block-Train-of-Four (TOF) monitoring was also performed, as well as diuresis monitoring. Midazolam, fentanyl, propofol, and non-depolarizing muscle relaxants (vecuronium bromide or rocuronium bromide) were used to start the anaesthesia. After that, sevoflurane, fentanyl boluses, and one of the non-depolarizing muscle relaxants were used to keep the anaesthesia going. Ventilation, hemodynamic, and inflammatory parameters were monitored at four time points: before anaesthesia, after intubation, half an hour from the start of anaesthesia, repeat measurements every two hours from the beginning of anaesthesia, half an hour after extubation, 12 hours after extubation, and 24 hours after extubation. Extubation time was measured in both groups of subjects, and X-rays of the heart and lungs were always done within two hours after surgery and after 48 hours. In the postoperative course, late complications were monitored in the period from the X-ray imaging of the lungs to five days after the operation.
Statistical Analysis
For the sample size determination and power analysis, the following parameters were used: the level of statistical significance was set at α=0.05, and the power of the test (defined as one minus the probability of a type II error) was set at 1-β=0.80 (conventionally, a power of 80% is used for clinical trials). The required sample size, i.e., the number of patients per group, was calculated based on the data of Oikkonen, et al. [20]. related to the arterial oxygenation index (PaO2/FiO2), where the mean value of arterial oxygenation was 357 (SD=36) in the experimental group in which the alveolar strengthening method was applied by providing the positive pressure, or 392 (SD=36) in the control group where this was not done. Using the methodology according to Machin, et al. [21], with a standardized effect size =1.0 (meaning that the difference in the mean value between groups is one SD (357+36=393), it was determined from their Table 5.1 (sample sizes for the two-sample t-test with two-sided α=0.05) on page 54 [21] that 17 subjects per group were required. Calculating the recommended attrition rate of 15%, we rounded the final sample size in each group to 20 respondents per group (20x0.15=3; 17+3=20).
Descriptive statistics were presented with frequency, percentage, median, mean, and Standard Deviation (SD) values. Graphical representations of the measured continuous variables also include 95% confidence intervals. In the analyses of categorical and discrete variables, the difference in proportions of subjects between groups was compared with Chi-squared () or Fisher’s exact test. Parametric statistical methods were used to compare continuous variables whose values followed a normal distribution. Between-group differences were assessed with a Student’s t-test. Dependent continuous variables measured over three or four different time points were analyzed using the mixed analysis of variance (mixed ANOVA). When an overall significant difference was found in ANOVA, Tukey-Kramer Honestly Significant Difference (HSD) post-hoc analysis was used to perform multiple pairwise comparisons between all possible pairs of group means if variances between groups were equal (homoscedasticity), the size of groups was relatively large, and the data was normally distributed. In cases where sample sizes were smaller and the data did not meet the assumptions of homoscedasticity and normality, post-hoc pairwise comparisons between groups after significant ANOVA results were obtained by using Fisher’s Least Significant Difference (LSD) post-hoc analysis. For continuous variables where the normality of the data was not met, non-parametric statistical methods were used. A Mann-Whitney U-test was used in accordance with the data distribution. Correlations between variables were tested using the Pearson method for variables with a normal distribution or the Spearman method for variables that did not meet the criteria of a normal distribution. Subjects were also analyzed by clustering around the variables of tidal volume and PEEP. Where we assumed the existence of a causal relationship between the variables, the hypothesis was tested using the linear regression analysis. All statistical analyses were done in SPSS v.22 (SPSS, Chicago, IL, USA). The level of statistical significance was set at α =0.05.
Results
The main results of our study were as follows:
1) Compared to the CV group, the intraoperative Mean Arterial Pressure (MAP) drop was non-significantly smaller in the PV group and also significantly lower in the PV group five days after the operation;
2) Peripheral capillary oxygen saturation (SpO2) was non-significantly higher in all time points in the PV group, and, compared to the time point one hour after the operation, overall significantly lower after 5 days;
3) Regardless of the group to which they were assigned by randomization, male patients had significantly higher intraoperative pulmonary compliance compared to female patients;
4) Regardless of group assignment, compared to female patients, peripheral (capillary) oxygen saturation (SpO2) was significantly higher in male patients before the operation and one hour after the operation but lower 5 days postoperatively;
5) the concentration of C-reactive protein rose overall almost three times from the preoperative time point to the fifth postoperative day, which was highly significant in both groups;
6) the overall difference in bicarbonate concentrations between the three time points (preoperatively, 1 hour, and 5 days after surgery) calculated for both groups together was significantly different (P0.001), with closer to normal values in the PV group;
7) In comparison to the CV group, the proportion of patients requiring ICU care was significantly lower in the PV group (*P=0.03); and
8) In comparison to the CV group (200.67 ±24 min), the mean extubation time in the PV group was 66.5 minutes shorter (134.17 ± 135.62 min) but this difference did not reach significance (P=0.122).
In all subjects, we measured and followed many hemodynamics, respiratory, laboratory, and other parameters. The main hemodynamics parameters followed were mean arterial pressure, systolic and diastolic pressure, pulse, and cardiac output. The main respiratory parameters were respiratory compliance and airway resistance. Both hemodynamics and respiratory parameters were correlated with acid-base status and laboratory parameters that included peripheral (capillary) oxygen saturation (SpO2), arterial oxygen saturation (SaO2), partial pressure of carbon dioxide (pCO2) in the blood, partial pressure of oxygen (pO2) in the blood, blood bicarbonate level, pH value, and the level of base excess in the blood. The main inflammatory parameters measured were C-reactive protein levels in the blood, differential blood count, frequency of breathing, and diuresis, as well as the development of the clinical picture of pneumonia (febrility above 38°C, leukocytosis above 12,000, leukopenia below 4,000 leukocytes, increase in CRP above 0.694 nmol/l, productive cough, X-ray signs of pneumonia). Some of the listed variables were measured at four time points: before the operation, during the operation, 1 day after the operation, and 5 days after the operation, and some in three time points: before the operation, 1 h after the operation, and 5 days after the operation (will be specified in the description of each variable). Here we describe in detail the selected variables measured and the relationships between the CV and PV groups of patients.
Mean Arterial Pressure (MAP)
Comparison of the Mean Arterial Pressure (MAP) at four different time points between the CV and PV groups showed that there was neither a significant overall difference between the groups (F=0.687, df=47, P=0.411) nor a significant statistical difference between the groups at any given time point, except at the last time point, where the CV group has a significantly higher mean MAP value (T=2.06, df=57, *P=0.044) (Figure 2).

Figure 2: Comparison of the Mean Arterial Pressure (MAP) at four different time points between the CV and PV groups. There is neither a significant overall difference between the groups (P=0.411) nor a significant statistical difference between the groups at any given time point, except at the last time point, where the CV group has a significantly higher mean MAP value (*P=0.044). Bars represent SD. CV, conventional ventilation group; MAP, mean arterial pressure; PV, protective ventilation group.
However, testing the effect of the ventilation procedure (CV or PV) on MAP changes at four different time points revealed that the overall effect of time was significant (mixed ANOVA F=3.69, df=45, *P=0.018), which means that in the two studied groups, MAP did not change uniformly across all four time points. The LSD post-hoc test confirmed that the mean MAP values were significantly different over some of the four time points and also that they did not behave equally in the CV and PV groups of patients. In the CV group, the intraoperative mean MAP value in the CV group was significantly lower than before the operation (post-hoc LSD ***P<0.0005) and five days after the surgery (post-hoc LSD **P=0.004). On the other side, there was no significant difference in the mean MAP values before, during, and after the operation in the PV group (Figure 3).
Systolic and Diastolic Pressures, Pulse, and Cardiac Output
Comparison of the systolic pressure at four different time points between the investigated groups showed no significant overall difference either between the groups (F=1.083, df=47, P=0.303) or at any given time point (Figure 4).
Nevertheless, there was an overall difference in systolic pressure over the analyzed time points (F=6.814, df=45, **P=0.001), which included significant interactions between the CV and PV groups at different time points (F=3.45, df=45, *P=0.024). Although these differences were clinically difficult to detect, some of them were statistically significant. Specifically, the LSD post-hoc test revealed that the systolic arterial pressure values were significantly different when comparing the time point before the operation and the time point during the operation (***P<0.0001) as well as between the intraoperative time point and the fifth day after the operation (*P=0.028). The dynamics of changes in systolic pressure followed the pattern described for MAP: systolic pressure first dropped intraoperatively compared to preoperative value but then returned to higher values, and this increase was quicker and more pronounced in the CV group. Thus, in the PV group, the systolic pressure value rose more slowly and reached a lower level after 5 days than was the case in the CV group of patients. Comparison of the diastolic pressure at four different time points between the investigated groups showed no significant overall difference either between the groups or at any given time point (F=0.04, df=47, P=0.842; Figure 5).
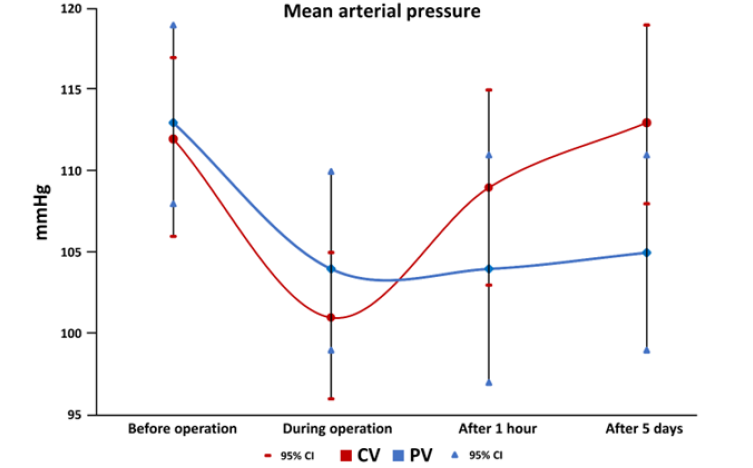
Figure 3: In the CV group, the intraoperative mean MAP value is significantly lower than before the operation (post-hoc LSD P<0.0005) and five days after the surgery (post-hoc LSD P=0.004). In the PV group, there was no significant difference in the mean MAP values before, during, and after the operation. Bars represent SD. CV, conventional ventilation group; MAP, mean arterial pressure; PV, protective ventilation group.
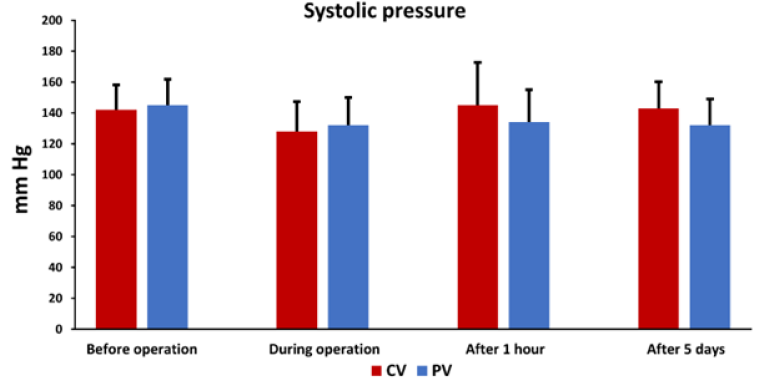
Figure 4: Comparison of the systolic pressure at four different time points between the CV and PV groups. There is neither a significant overall difference between the groups (P=0.3) nor a significant statistical difference between the groups at any given time point. Bars represent SD. CV, conventional ventilation group; PV, protective ventilation group.
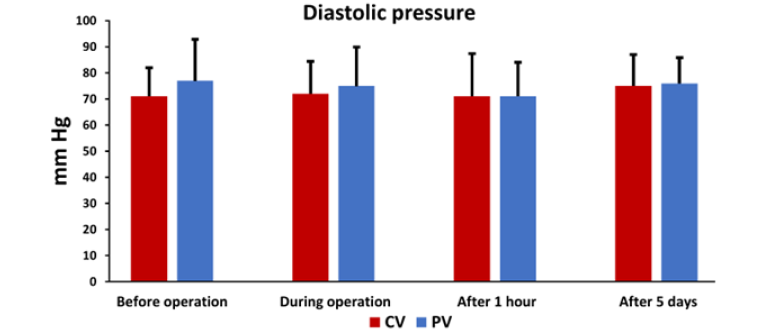
Figure 5: Comparison of the diastolic pressure at four different time points between the CV and PV groups. There is neither a significant overall difference between the groups (P=0.84) nor a significant statistical difference between the groups at any given time point. Bars represent SD. CV, conventional ventilation group; PV, protective ventilation group.
Similarly to systolic pressure, there was an overall effect of time on the diastolic pressure over the analyzed time points (F=6.129, df=45, **P=0.001), which included significant interactions between the CV and PV groups at different time points (F=2.97, df=45, *P=0.042). Again, these differences were clinically difficult to detect, but some of them were statistically significant. Specifically, the LSD post-hoc test revealed that the diastolic arterial pressure values were significantly different when comparing the time point before the operation and the time point during the operation (*P<0.016) as well as the time point one hour after the operation (**P=0.002). The diastolic pressure at the intraoperative time point and one hour after the operation differed significantly from the mean value measured on the fifth day after the operation (**P=0.002 and ***P=0.0001, respectively).
We have also monitored the pulse of all patients. Although the effect of time had a significant overall effect on the mean pulse values in four time points (F=4.659, df=44, **P=0.007), there were no significant differences between the CV and PV groups at any given time point (F=0.088, df=46, P=0.768; Figure 6).
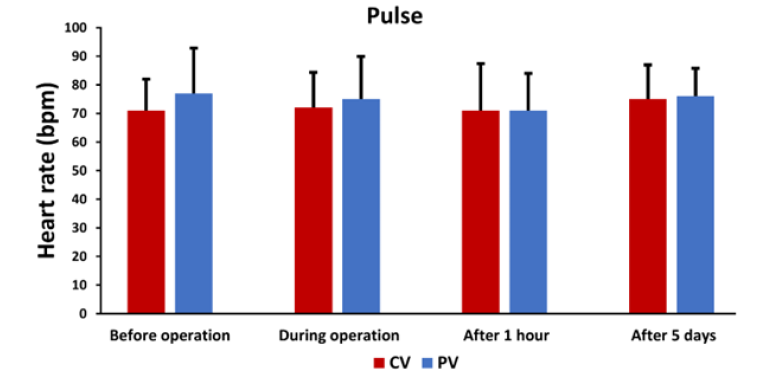
Figure 6: A comparison of the pulse mean values at four different time points between the CV and PV groups shows no significant differences between the CV and PV groups (P=0.669). CV, conventional ventilation group; bpm, beats per minute; PV, protective ventilation group.
There was no significant difference in the intraoperative cardiac output between the CV and PV groups (N=27, mean heart minute volume = 6.344 L/min ± 1.091 (SD) for the CV group and N=19, mean heart minute volume = 6.541 L/min ± 0.863 (SD) for the PV group; t-test T=-0.655, df=44, P=0.516).
Pulmonary Compliance
Intraoperative measurements of pulmonary compliance (C) revealed no significant differences between the CV and PV groups. The mean value (± SD) of C measured in 26 patients in the CV group was 55.12 ± 19.04 ml/kPa and for 23 patients in the PV group, it was 50.73 ± 12.69 ml/kPa, which was a non-significant difference (T=0.935, P=0.355). While age had no influence, sex had a significant influence on pulmonary compliance. Namely, regardless of the group to which they were assigned by randomization, male patients (N=21, C=62.97 ± 14.486 ml/kPa) had significantly higher intraoperative pulmonary compliance compared to female patients (N=28, C=45.63 ± 13.66 ml/kPa), and this difference was highly significant (T=4.286, df=47, P<0.0001, Figure 7).

Figure 7: A comparison of the intraoperative pulmonary compliance between male and female patients. The difference was highly significant (P<0.0001). C, pulmonary compliance.
Peripheral (capillary) Oxygen Saturation (SpO2) and Arterial Oxygen Saturation (SaO2)
Analysis of variance for repeated measurements (before the operation, one hour after the operation, and 5 days after the operation) showed that there was an overall statistically significant difference in the peripheral capillary saturation with oxygen (SpO2) measured with a pulse oximeter in three different time points (F=6.32, df=2, **P=0.003); post-hoc testing using HSD test revealed that SpO2 values were significantly lower 5 days after the operation compared to the time point one hour after the operation (post-hoc HSD, df=74, *P=0.028) (Figure 8). There were no differences between the CV and PV groups (F=1.22, df=2, P=0.292). Likewise, interactions between time points and the group of patients (CV or PV) were not significant (F=1.22, df=2, P=0.301), indicating that the groups behaved equally over time.
However, the differences between sexes were significant (regardless of the group) (F=4.8, df=2, *P=0.011) (Figure 9).
The peripheral (capillary) oxygen saturation (SpO2) measured with a pulse oximeter on a finger did not correlate well with the arterial oxygen saturation (SaO2) measured through a direct blood sample, which is the more accurate method. The Pearson’s correlation coefficient r for SpO2 and SaO2 measurements before operation (N=52, r=0.22, no outliers were found), 1 hour after operation (N=51, r=0.38, no outliers were found), and 5 days after operation (N=37, r=0.42, one outlier was removed from the analysis) were only low to moderate.
Triple interaction between time points, group (CV and PV), and sex, was also significant (F=4.11, df=2, *P=0.02), which indicates complex relationships regarding SpO2 changes.
Correlations of MAP with SpO2 and pulse
There were no statistically significant differences between Mean Arterial Pressure (MAP) and oxygen saturation (SpO2) in the CV and PV groups. The only significantly positive correlations were those between MAP and SpO2 one hour after the operation in the PV group (r=0.773, ***P<0.0001) and between MAP and SpO2 five days after the operation in the CV group (r=0.448, *P=0.032). The results of the analysis of variance for repeated measurements (before the operation, one hour after the operation, and 5 days after the operation) however showed that there was an overall difference in the SpO2 in three different time points (F=6.32, df=2, **P=0.003).
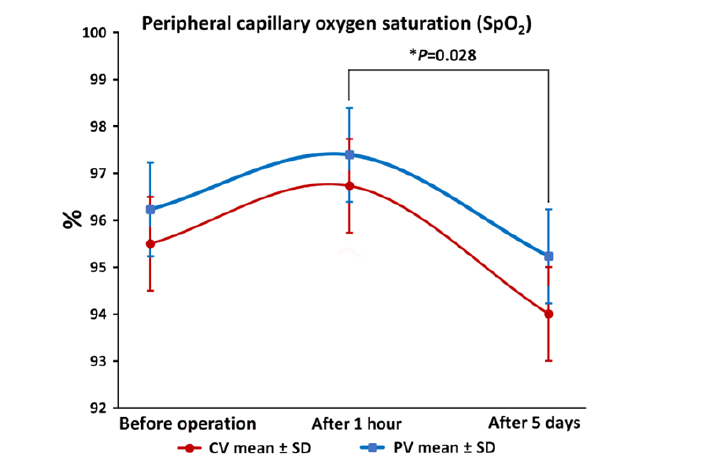
Figure 8: Peripheral (capillary) oxygen saturation (SpO2) is significantly different between the time point one hour after the operation and after 5 days (*P=0.028) and overall (**P=0.003), while there are no significant overall differences between the CV and PV groups (P=0.011). Interactions between time points and the group of patients (CV or PV) are not significant either (P=0.301), indicating that the groups behaved equally over time. CV, conventional ventilation group; PV, protective ventilation group; SpO2, peripheral capillary oxygen saturation.
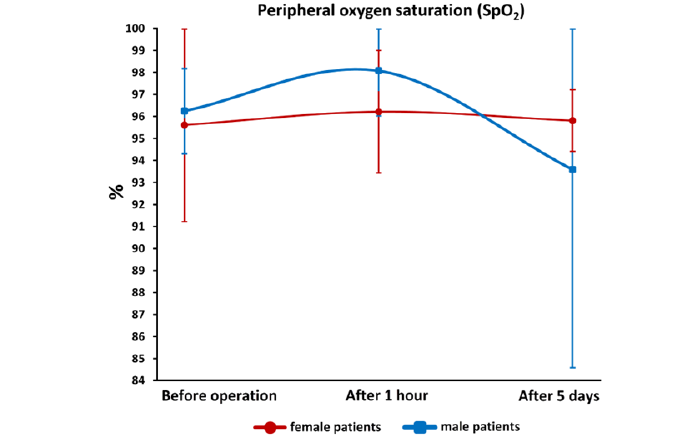
Figure 9: Peripheral (capillary) oxygen saturation (SpO2) is significantly higher in male patients in comparison to female patients (*P=0.011). The graph shows mean values ± SD. It can be seen from the graph that SpO2 is slightly higher in men before the operation and after 1 hour, while after 5 days it is significantly lower than in women. SpO2, peripheral capillary oxygen saturation.
Generally, correlations between MAP and heart rate were not statistically significant either. Pulse and MAP positively correlated only intraoperatively in the PV group (N=22; r=0.452, *P=0.035), which means that patients with a higher pulse had, on average, a slightly higher MAP value.
Correlation of Pulmonary Compliance and SpO2 By Groups
The correlation between pulmonary compliance and SpO2 was not statistically significant in either group in the study (N=25, r=0.186, P=0.373 for the CV group; N=21, r=0.214, P=0.352). This relationship was only possible to assess intraoperatively because only for that time point, we had measured compliance.
The Partial Pressure of Carbon Dioxide (pCO2)
The results of the ANOVA for repeated measures showed that there was a statistically significant difference in pCO2 over time (F=5.231, df=2, **P=0.008). Post-hoc analysis indicated that the preoperative pCO2 mean value was significantly lower than the mean value of pCO2 one hour after the operation (post-hoc HSD, df=72, *P=0.015) and that the mean value of pCO2 one hour after the operation was significantly higher than after 5 days (post-hoc HSD, df=72, **P=0.005). The interaction between time and group was not statistically significant (F=0.422, df=2, P=0.657), which indicates that the CV and PV groups behaved similarly over time. The interaction between time and sex was also non-significant (F=0.053, df=2, P=0.949), which indicates that pCO2 behaved equally over time by sex. Triple-way interactions between time points, groups, and sex were also not significant (F=0.895, df=2, P=0.413) (Figure 10).
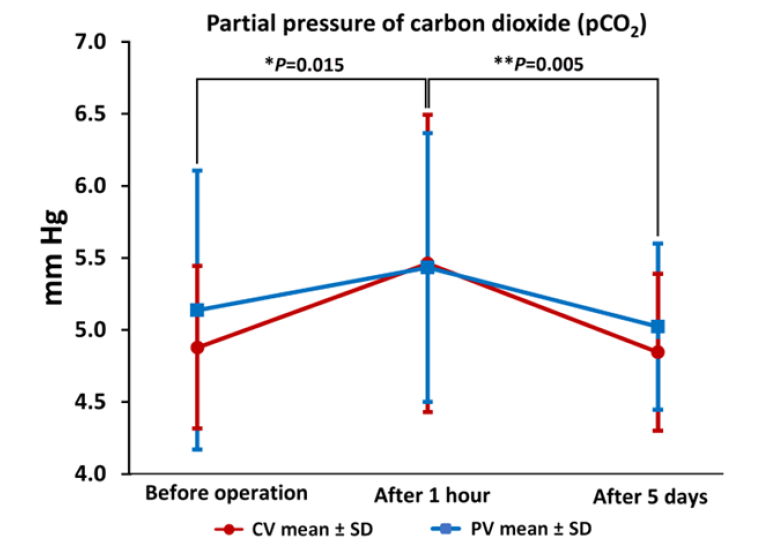
Figure 10: Carbon dioxide pressure (pCO2) between CV and PV groups in three measured time points. The preoperative pCO2 mean value was significantly lower than the mean value one hour after the operation (post-hoc HSD *P=0.015) and the mean value of pCO2 one hour after the operation was significantly higher than after 5 days (post-hoc HSD **P=0.005). SD, standard deviation; pCO2, partial pressure of carbon dioxide.
The C-Reactive Protein Concentration in the Blood
The C-reactive protein concentration was measured at two time points: preoperatively and 5 days after surgery. While its concentration rose overall almost three times from the preoperative time point (mean 32.68 ± 52.07 mg/l) to the fifth postoperative day (86.88 ± SD 59.5 mg/l), which was highly significant (F=30.989, P<0.0001), there were no significant differences between the CV (CRP levels raised from 32.81 ± SD 55.62 mg/l preoperatively to 89.81 ± SD 61.32 mg/l 5 days after the operation) and PV (CRP levels raised from 32.5 ± SD 48.05 mg/l to 79.42 ± 56.26 mg/l 5 days after the operation) groups (F=0.517, df=1,49, P=0.476; Figure 11).
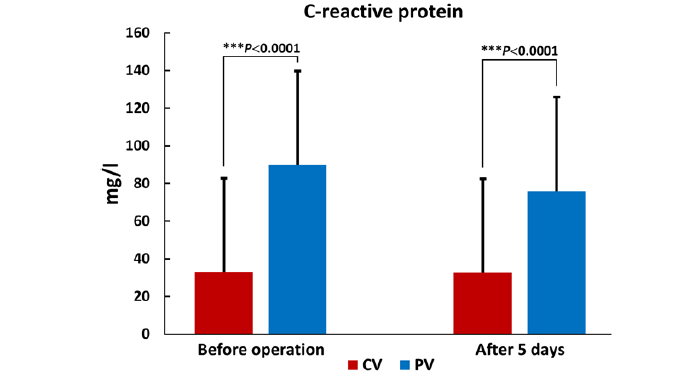
Figure 11: The C-reactive Protein (CRP) differences between CV and PV groups in two measured time points. The postoperative concentration of CRP was significantly higher (***P<0.0001), but there was no difference between the groups (P=0.476). CRP, C-reactive protein; CV, conventional ventilation group; PV, protective ventilation group.
The Lactic Acid Measurements in the Blood
The lactic acid measurements in blood were taken at two time points: 1 h and 5 days after surgery. The mean lactate concentration one hour after surgery in the CV group (N=27; 1.307 ± 1.076 mmol/l) was higher than in the PV group (N=22; 0.905 ± 0.542 mmol/l) but this difference did not reach statistical significance (F=2.665, df=47, P=0.097). Inversely, the mean lactate concentration 5 hours after surgery in the CV group (N=28; 0.964 ± 0.532 mmol/L) was lower than in the PV group (N=18; 1.442 ± 1.31), and this difference was not significant either (F=3.271, df=44, P=0.157). ANOVA showed that the difference in lactate concentrations between the two time points (1 hour and 5 days after surgery) calculated for both groups together was not significant (F=0.348, df=1, P=0.558) and also confirmed that the difference between CV and PV groups is not significant (F=0.091, df=1, P=0.765). However, it also showed that the interaction between the time and group was significant (F=5.36, df=1, *P=0.026) because lactate in the CV group decreased between the two measurements, while lactate in the PV group increased between the two measurements (Figure 12).
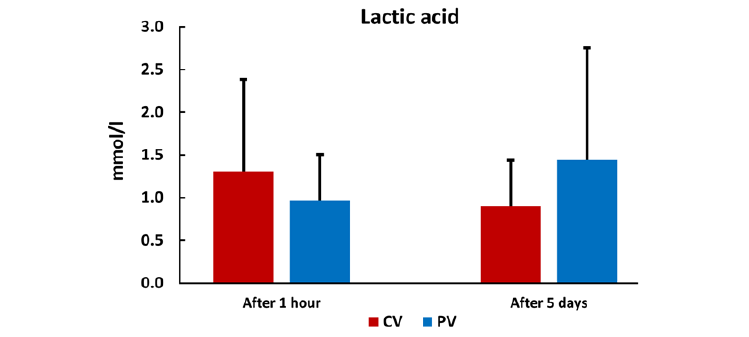
Figure 12: The lactic acid concentrations in the CV and PV groups one hour and 5 days after the operation. The differences between the time points and the groups were not significant, but the interaction between the time points and the group was (*P=0.026). CV, conventional ventilation group; PV, protective ventilation group.
Bicarbonate (HCO3-) Measurements in the Blood
The blood bicarbonate (HC O3-) measurements were taken at three time points: preoperatively, 1 h, and 5 days after the operation. The mean bicarbonate concentration before the operation in the CV group (N=30; 26.757 ± 3.056 mmol/l) was lower than in the PV group (N=23; 28.096 ± 4.648 mmol/l) but this difference was not significant (t=-1.263, P=0.212). The mean bicarbonate concentration one hour after the before operation in the CV group (N=29; 24.945 ± 3.99 mmol/l) was lower than in the PV group (N=21; 25.033 ± 3.702 mmol/l) but this difference was not significant either (t=-0.08, P=0.937). The mean bicarbonate level 5 days after the operation in the CV group (N=25; 27.38 ± 3.16 mmol/l) was higher than in the PV group (N=17; 26.747 ± 3.942 mmol/l) but this difference was also not significant (t=0.576, P=0.633). ANOVA confirmed that the difference between the CV and PV groups was not significant for each time point (F=0.176, df=1, P=0.678), nor was the interaction between the time and group (F=0.43, df=2, P=0.652), confirming what is seen on the graph (Figure 13), which is that the drop in time point one hour after surgery was similar in both groups, as was the rise in the time point after 5 days. However, the LSD post-hoc test indicated that bicarbonate levels significantly differed between the time point 1 hour after surgery compared to preoperative values (**P<0.001), as well as between 1 hour and 5 days after surgery (**P<0.005). Most importantly, the difference in bicarbonate concentrations between the three time points (preoperatively, 1 hour, and 5 days after surgery) calculated for both groups together was highly significant (F=7.488, df=2, **P<0.001) since better (closer to normal) values were measured in the PV group after 5 days even though the PV group started with much higher mean bicarbonate levels (Figure 13).
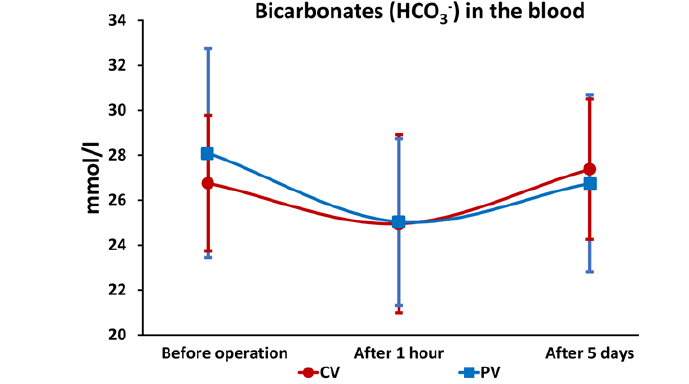
Figure 13: The bicarbonate (HCO3-) concentrations in the CV and PV groups preoperatively, one hour, and 5 days after the operation. While the differences between the CV and PV groups were not significant at individual time points (F=0.176, df=1, P=0.678), as well as the interaction between the time and group (F=0.43, df=2, P=0.652), the overall difference in bicarbonate concentrations between the three time points (preoperatively, 1 hour, and 5 days after surgery) calculated for both groups together was highly significant (F=7.488, df=2, **P<0.001). Better (lower) values were measured in the PV group after 5 days although the PV group started with higher bicarbonate levels. CV, conventional ventilation group; PV, protective ventilation group.
Extubation Times Difference between the CV And PV Groups
The mean extubation time in the CV group (200.67 ± 168.24 min) was 66.5 minutes longer than in the PV group (134.17 ± 135.62 min). However, although a clear trend was present towards shorter mean extubation times in the PV group, the extubation time difference between the groups did not reach statistical significance (t=1.57, df=52, P=0.122; Figure 14).
Rate of ICU Admission and Duration of Intensive Care and Hospital Stay
The mean number of days spent in the ICU for patients in the CV group was 3.31 ± 1.57 days (N=26), whereas patients in the PV group spent in the ICU 3.62 ± 1.98 days (N=13), the difference being statistically non-significant (t=0.529, df=37, P=0.6). Likewise, the number of days spent in the hospital was not significantly different between the groups (CV group: 11.9 ± 4.34 days vs PV group: 11 ± 7.31 days; t=0.559, df=51, P=0.579). However, the fact that only 13 out of 23 patients in the PV group required ICU care (two of whom developed pneumonia), was significantly fewer compared to 26 (four of whom developed pneumonia confirmed by clinical signs and X-ray image) out of 30 patients from the CV group who needed ICU ( with Yates correction factor=4.63, *P=0.03; without correction for small numbers =6.09, *P=0.014; Figure 15).

Figure 14: The difference in the mean extubation time between the CV and PV groups. The respiratory status of patients in the PV group allowed for shorter extubation times, but the difference did not reach statistical significance (P=0.122). CV, conventional ventilation group; PV, protective ventilation group.

Figure 15: Only 13 out of 23 patients in the PV group required ICU care (two of whom developed pneumonia), whereas 26 out of 30 patients from the CV group needed intensive care after the surgery (four of whom developed pneumonia confirmed by clinical signs and X-ray images). This difference is significant (*P=0.03). CV, conventional ventilation group; PV, protective ventilation group.
Discussion
In this randomized study, patients were operated under general anaesthesia for uncomplicated abdominal laparoscopic surgery using intraoperative mechanical ventilation with tidal volumes of 6 ml/kg body weight in the CV group versus 10 ml/kg body weight and a PEEP of 5-8cm H20 in the PV group. In previous studies, the level of oxygenation has been established as a dependable indicator of respiratory problems, predicting the potential early onset of acute respiratory distress syndrome (ARDS), the emergence of pulmonary complications, and hospital mortality. As such, oxygenation constituted one of the primary measured outcomes in our study too. However, we found no clinical and statistical significance on the P/F arterial oxygenation index in the early postoperative period (in the awakening room). Moreover, there were also no statistically significant interactions between tidal volume and PEEP. Most of the other outcomes were also not significantly different between the CV and PV groups, including oxygenation in the later postoperative period, adverse respiratory events, and length of hospitalization. However, significantly fewer patients from the PV group needed intensive care due to their postoperative condition, where respiratory problems and postoperative pain were the most common reasons that required additional intensive monitoring in the ICU. Compared to the CV group, we determined significantly lower mean MAP values five days after the operation and significantly closer to normal values of bicarbonate ions after the surgery in the patients from the PV group. Moreover, mean extubation time also showed a strong trend toward being shorter in the PV group but did not reach statistical significance.
While some previous studies conducted on critically ill patients undoubtedly demonstrated the benefits of employing protective ventilation techniques (utilizing lower tidal volumes, moderate PEEP values, and recruitment maneuver) in reducing the risk of lung damage, overall morbidity, and mortality (list all the references you consider necessary - there is room for 14 or 15 more references in the text, you will know better which are of higher quality and more important), our study did not establish a clear link between variations in respiratory volumes and the occurrence of atelectasis based on chest CT findings. The relatively lower PEEP pressure used in our study contributed to improved oxygenation during intraoperative mechanical ventilation. However, this enhancement did not demonstrate a sustained effect, nor did it impact the recovery process. It is crucial to note here that comparing the outcomes of our study, conducted on abdominal surgical patients with normal lung function and shorter ventilation periods, with the aforementioned studies on mechanically ventilated patients undergoing prolonged, intensive treatment for acquired severe lung conditions might not be feasible due to the disparity in the level and duration of ventilatory support between these patient cohorts. ASA 1 and ASA 2 patients, who made up the majority of patients in our study (29 out of 53), compensated well for breathing problems due to general anesthesia and abdominal surgery.
Hence, it may be more crucial to highlight that various sizable, randomized trials have previously documented comparable results to ours, albeit employing different intraoperative ventilation strategies. The first is the PROtective Ventilation using HIgh versus LOw positive end-expiratory pressure (PROVHILO) trial, conducted on 900 patients undergoing abdominal surgery, which compared the outcomes of two ventilation approaches. The trial found that employing intraoperative low tidal volume ventilation with PEEP levels of 12 cm H2O alongside a recruitment maneuver (classified as the high PEEP group, which consisted of 447 patients) did not demonstrate better protection against PPCs in comparison to using PEEP levels of 2 cm H2O or less without a recruitment maneuver (encompassing the low PEEP group, which consisted of 453 patients) [22]. Likewise, ventilation with high vs. low PEEP levels during the general anesthesia for abdominal surgery has not affected postoperative spirometry test results [23].
In a more recent single-center, assessor-blinded, randomized clinical trial involving 1236 patients over 40 years old undergoing major surgeries under general anesthesia, those admitted for non-cardiothoracic, non-intracranial operations were subjected to PEEP at 5 cm H2O. They were randomized to receive a tidal volume of either 6 ml/kg of predicted body weight (614 patients in the low tidal volume group) or 10 ml/kg of predicted body weight (592 patients in the conventional tidal volume group). That study, conducted by Karalapillai, et al. [24], did not reveal any significant differences in primary or secondary outcomes. Our study's findings also share some similarities with the research by Severgnini, et al. [16]. In Severgnini's study, 56 patients scheduled for abdominal surgeries lasting longer than 2 hours were randomly assigned to two groups: one receiving mechanical ventilation with a tidal volume of 9 ml/kg of ideal body weight and zero PEEP (standard ventilation group), and the other with tidal volumes of 7 ml/kg of ideal body weight, 10 cm H2O PEEP, and recruitment maneuvers (protective ventilation group). The protective ventilation strategy, reported in Severgnini's study, improved respiratory function and reduced PPCs without affecting hospital stay duration. However, in contrast to Severgnini's study, our research did not exhibit improved pulmonary function tests up to the fifth day, nor did it demonstrate fewer chest X-ray alterations up to the third day after surgery. Additionally, higher arterial oxygenation was not observed in our findings.
We find the results concerning bicarbonate levels in our study to be of particular significance. The substantial difference in bicarbonate concentrations observed across the three time points (preoperatively, 1 hour, and 5 days post-surgery) for both groups collectively was notably significant. Namely, the patients in the PV group initially displayed considerably higher mean bicarbonate levels compared to those randomly assigned to the CV group. This suggests that, on average, following protective ventilation during anesthesia, the PV group tended to achieve markedly improved (nearer to normal) values five days after surgery. Bicarbonate levels play a pivotal role in preserving the body's acid-base equilibrium, indirectly impacting crucial factors such as enzyme activity, cellular function, and the overall physiological stability and response to stress, particularly for organs like the lungs and kidneys. Consequently, in conjunction with the observed decrease in mean arterial pressure, it is plausible that at least a portion of the positive outcomes associated with the protective ventilation procedure could be linked to the reduction of elevated bicarbonate levels.
Limitations of the Study
The process of randomization process in our study was genuinely random and conducted without bias and deliberate manipulation of the groups' assignments. However, it is important to understand that randomization does not guarantee an equal distribution of all variables, as it is entirely possible for random chance to result in unequal group compositions. In our case, randomization resulted in the fair distribution of patients according to their age, body mass index, ASA status, and comorbidities. However, it assigned significantly more men to the CV group and more women to the PV group (sex bias). To address this issue or prevent potential biases related to the unequal sex distribution between groups, researchers conducting similar future studies can consider using stratified randomization, where they intentionally divide participants into subgroups based on sex and then apply randomization separately within each subgroup. Alternatively, they can consider covariate adjustment or propensity score matching, to account for this imbalance in subsequent data analysis.
Some other significant limitations are present in our research. These include the relatively small groups’ sample sizes, and also a low number of blood sample withdrawals and tests made at only two to four time points. The skill of the operator during the laparotomy procedure and the different approaches to the mesocolon region might have influenced the obtained results as well. Additionally, the experience of the anaesthesiologist in managing balanced anaesthesia and ensuring the correct application of protective ventilation might have affected the outcomes. From the technical point of view, many possible factors can introduce differences between the peripheral (capillary) oxygen saturation (SpO2) measured with a pulse oximeter and the arterial oxygen saturation (SaO2) measured through a direct blood sample, which is the more accurate method. In an approximate order based on their potential impact on the correlation between these two measurements, the likely main reasons are the location of measurement, coexisting medical conditions (especially smoking), and physiological variabilities such as lower heart rate, oxygen consumption, and oxygen pulse [25].
To better discern the distinctions in the effects of the two tested ventilation procedures, a more meticulous approach might be needed too. This should involve precise monitoring of awakening progression and consciousness level. The inclusion criteria for subjects enrolling in the study require more substantial and homogeneous groups of participants. Regarding the study subjects, it is imperative to consider individual differences more comprehensively when defining inclusion criteria. Furthermore, a more detailed measurement and follow-up are essential to assess the impact of anaesthetics and muscle relaxants on the observed variables.
To enhance result interpretation, a stricter definition of the precise testing times, coupled with more frequent sampling is needed. Future studies should also consider an extended monitoring period for postoperative respiratory complications, which should include evaluating the somatic senses and intensity of postoperative pain as well as ensuring the appropriateness of physical therapy in the recovery process.
Finally, although we haven't observed distinct variations in oxygenation levels resulting from diverse ventilation techniques employed in general anaesthesia for abdominal surgery, forthcoming clinical studies should delve deeper into understanding how blood circulation bypasses oxygen-deprived lung areas, a process known as shunting. Shunting is a physiological response to diminished oxygenation that is very difficult to correct with conventional oxygen therapy. Even when the blood is rerouted, it fails to efficiently absorb oxygen, culminating in hypoxemia, and potentially, the onset of ARDS and lung dysfunction. Given that our patients did not experience critical compromise necessitating the activation of shunting mechanisms, this underscores the significance of future research in developing strategies to mitigate the impact of shunting, especially in scenarios such as pneumonia, through the safeguarding of protective ventilation procedures. An additional valuable tool for surveillance and optimizing patient care can be the non-invasive measurement of bioelectrical lung impedance that allows for continuous monitoring of lung function, both in terms of assessing the efficacy of protective ventilation and early detection of pulmonary complications.
Conclusions
While our study’s findings align with larger randomized studies, indicating no significant differences in primary and secondary outcomes between conventional and protective ventilation methods during and after major abdominal surgery, it is necessary to highlight our distinct contributions as well. We objectively established that, in contrast to conventional ventilation, the protective anaesthesia ventilation method resulted in statistically favorable changes in certain variables: notably, a substantial reduction in mean arterial pressure five days post-surgery, a closer approximation to normal bicarbonate levels, and a significantly lower requirement for postoperative intensive care among patients. These results led us to conclude that employing protective lung ventilation strategies holds the potential to modestly yet effectively avert PPCs. Therefore, we strongly advocate for their integration as the standard practice in general anaesthesia.
Acknowledgments
The authors thank Vatroslav Jelovica and Pero Hrabač for their help with the statistical analysis.
References
- Sun Z, Sessler DI, Dalton JE, Devereaux PJ, Shahinyan A, et al. (2015) Postoperative hypoxemia is common and persistent: a prospective blinded observational study. Anesth Analg 121(3): 709-715.
- Karcz M, Papadakos PJ (2013) Respiratory complications in the postanesthesia care unit: a review of pathophysiological mechanisms. Can. J. Resp. Ther 49(4): 21-29.
- Zheng C, Lagier D, Lee JW, Vidal Melo MF (2022) Perioperative pulmonary atelectasis - Part I: biology and mechanisms. Anesthesiology 136(1): 181-205.
- MacIntyre NR (2019) Physiologic effects of noninvasive ventilation. Resp Care 64(6): 617-628.
- Young CC, Harris EM, Vacchiano C, Bodnar S, Bukowy B, et al. (2019) Lung-protective ventilation for the surgical patient: international expert panel-based consensus recommendations. Br J Anaesth 123(6): 898-913.
- Zhou L, Li H, Li M, Liu L (2023) Individualized positive end-expiratory pressure guided by respiratory mechanics during anesthesia for the prevention of postoperative pulmonary complications: a systematic review and meta-analysis. J Clin Monit Comput 37(2): 365-377.
- Perilli V, Sollazzi L, Modesti C, Annetta MG, Sacco T, et al. (2003) Comparison of positive end-expiratory pressure with Trendelenburg position in morbidly obese patient undergoing bariatric surgery: effects on hemodynamics and pulmonary gas exchange. Obes Surg13(4): 605-609.
- Bluth T, Teichmann R, Kiss T, Bobek I, Canet J, et al. (2017) Protective intraoperative ventilation with higher versus lower levels of positive end-expiratory pressure in obese patients (PROBESE): study protocol for a randomized controlled trial. Trials 18(1): 202.
- Algera AG, Pisani L, Carneiro de Freitas Chaves R, Amorim TC, Cherpanath T, et al. (2018) Effects of PEEP on lung injury in animals with uninjured lungs - a systematic review. Ann. Transl. Med 6(2): 25.
- West JB (2005) The physiological challenges of the 1952 Copenhagen poliomyelitis epidemic and a renaissance in clinical respiratory physiology. J Appl Physiol 99(2): 424-432.
- Webb HH, Tierney DF. (1974) Experimental pulmonary edema due to intermittent positive pressure ventilation with high inflation pressures. Protection by positive end-expiratory pressure. Am Rev Respir Dis 110(5): 556-565.
- Plataki M, Hubmayr RD (2010) The physical basis of ventilator-induced lung injury. Expert Rev Respir Med 4(3): 373-385.
- Garfield B (2021) Ventilator-associated lung injury. Encyclop Resp Med 2022: 406-417.
- Musch G, Vidal Melo MF (2022) Intraoperative protective mechanical ventilation: fact or fiction? Anaesthesiology 137(4): 381-383.
- Meara JG, Leather AJM, Hagander L, Alkire BC, Alonso EAA, et al. (2015) Global Surgery 2030: evidence and solutions for achieving health, welfare, and economic development. Lancet 386(9993): 569-624.
- Severgnini P, Selmo G, Lanza C, Chiesa A, Frigerio A, et al. (2013) Protective mechanical ventilation during general anesthesia for open abdominal surgery improves postoperative pulmonary function. Anesthesiology 118(6): 1307-1321.
- Güldner A, Spieth PM, Gama de Abreu M (2015) Non-ventilatory approaches to prevent postoperative pulmonary complications. Best Pract Res Clin Anaesthesiol 29(3): 397-410.
- Gropper MA, Eriksson LI, Fleisher LA, Wiener Kronish JP, Cohen NH, et al. (2019) Miller’s Anesthesia, 9th ed. Philadelphia (PA): Elsevier Health Sciences.
- Costa Leme A, Hajjar LA, Volpe MS, Fukushima JT, De Santis Santiago RR, et al. (2017) Effect of intensive vs moderate alveolar recruitment strategies added to lung-protective ventilation on postoperative pulmonary complications: a randomized clinical trial. JAMA 317(14): 1422-1432.
- Oikkonen M, Karjalainen K, Kähärä V, Kuosa R, Schavikin L (1991) Comparison of incentive spirometry and intermittent positive pressure breathing after coronary artery bypass graft. Chest 99(1): 60-65.
- Machin D, Campbell MJ, Tan SB, Tan SH (2009) Sample size tables for clinical studies, 3rd Ed. Chichester, UK: Wiley-Blackwell, 2009. p. 54, Table 5.1. ISBN: 978-1-4051-4650-0.
- Sabrine N T Hemmes, Marcelo Gama de Abreu, Paolo Pelosi, Marcus J Schultz (2014) PROVE Network Investigators for the Clinical Trial Network of the European Society of Anesthesiology. High versus low positive end-expiratory pressure during general anesthesia for open abdominal surgery (PROVHILO trial): a multicenter randomized controlled trial. Lancet 384(9942): 495-503.
- Treschan TA, Schaefer M, Kemper J, Bastin B, Kienbaum P, et al. (2017) Ventilation with high versus low PEEP levels during general anesthesia for open abdominal surgery does not affect postoperative spirometry: a randomized clinical trial. Eur J Anaesthesiol 34(8): 534-543.
- Karalapillai D, Weinberg L, Peyton P, Ellard L, Hu R, et al. (2020) Effect of intraoperative low tidal volume vs conventional tidal volume on postoperative pulmonary complications in patients undergoing major surgery: a randomized clinical trial. JAMA 324(9): 848-858.
- Ascha M, Bhattacharyya A, Ramos JA, Tonelli AR (2018) Pulse oximetry and arterial oxygen saturation during cardiopulmonary exercise testing. Med Sci Sports Exerc 50(10): 1992-1997.


 We use cookies to ensure you get the best experience on our website.