Research Article 
![]() Creative Commons, CC-BY
Creative Commons, CC-BY
Numerical Simulations on The Generation of Lung Sounds in Model of Asthma
*Corresponding author: Juntao Feng, Xiaozhao Li, Department of Respiratory Medicine, Xiangya Hospital, Central South University, China, Department of Nephrology, Xiangya Hospital, Central South University, China.
Received: August 09, 2024; Published: August 14, 2024
DOI: 10.34297/AJBSR.2024.23.003114
Abstract
Focusing on the generation of lung sounds in asthma, a 3-D geometrical model of the lower respiratory tracts with a 30% diameter reduction has been developed, and the airflow behavior and the resulting lung sounds are simulated under normal breathing conditions.
The results show that:
1) Vorticities at the junctions between airways are higher than those in tubes, and increase to the peak value in the middle of exhalation.
2) Sound pressure levels at the junctions between airways are higher than those in tubes, and the peak values are at the junction between G6 and G7 in the middle of exhalation (0.75s). Inside the airways, the average sound pressure level varies between 120-135dB, which is about 70dB higher than that on the surface of the body.
3) There were three energy peaks at approximately 970, 1900, and 2850 Hz in the computed lung sounds in the 30% diameter reduced airways.
4) The average sound pressure levels inside the constricted airways (30%) are about 12-20dB higher than those in normal airways. In contrast, on the body surface, it is only 5dB more than that of normal airways.
Keywords: Lung sounds, Asthma, CFD, Airflow, Airways, Fluent
Introduction
Asthma is a common chronic inflammatory disease of the lungs that kills about 1000 people every day and affects as many as 339 million people of all ages. Its prevalence is still rising [1] and exerts a large burden on society, especially in low and middle-income countries [2]. Lung sounds play an important role in the investigation of pulmonary disease [3,4] since they can offer a cheap, non-invasive, non-radioactive source of information. Wheeze is the most widely reported adventitious lung sound and has traditionally been used to define asthma in diagnosis and assess the effects of treatment [5,6], particularly in young children, both in research and clinical practice. Then, the specific events that generate wheezing have been a focus of speculation and many investigational efforts have been carried out in the past centuries. In 1726, Floyer [7] first mentioned that wheezes were generated at sites where muscular contraction generates and were noted predominantly during expiration. He also noted that wheezing was related to more severe constriction of the airways. In 1833, Williams [8] described the origin of sonorous rhonchi as a “flattened contraction in a bronchus of considerable size” where it “leaves little or no gaping aperture.” He indicated that “air forcing its passage” through “very viscid mucus” could cause a “ticking sound.” Since wheezes can be described as musical sounds, their mechanisms of production may be similar to those of wind instruments. Forgacs [9] first compared the airway at the point of closure to a reed in a toy trumpet and found the mass and elastic properties of the bronchus can determine the pitch of a wheeze. Gavriely also states the pitch of a wheeze does not change when breathing a helium-oxygen mixture [10]. As the air runs through the collapsible tubes, a typical vibration with a much higher frequency (termed flutter) may be produced [11,12], due to the dominant wall inertia. The flutter is regarded as the possible cause of wheezing. Grotberg and Davis proposed a simplified analytic model of flow through an infinite, two-dimensional, flexible channel [13]. With this model, Grotberg [14,15] obtained the critical flow velocity that will initiate airway walls flutter, which depends on the mechanical and physical characteristics of the tube and the gas. Gavriely documented the characteristics in the time and frequency domain of breath sounds in 10 wheezing patients, compared their experimental results with predictions from flutter theory, and concluded that wall flutters in compliance tubes were the probable mechanism that causes oscillations [16-18].
Another potential mechanism of wheeze generation may involve vortices. When the fluid is flowing through complex tubes or over obstacles, swirls will be formed. The generated pressure fluctuations can be sources of sound. The vortex shedding has been made visible in physical models [19] and explained in theory [20]. Some experimental results have supported to vortex shedding as one potential mechanism [21]. Nevertheless, the generating mechanism of wheezes has not been understood thoroughly, and this often causes confusion in diagnosis. Take asthma as an example, although the patients have the same features such as airflow limitation, variable airflow obstruction, and airway hyper-responsiveness, the clinical manifestations are heterogeneous, i.e., not all people with asthma have rhonchi (wheezes) [22]. This is the main problem in both research and daily clinical practice and often causes inadequate treatments in young children [23]. Due to its non-invasive character, lower cost, and better repeatability, Computational Fluid Dynamics (CFD) has been increasingly used in the research on these chronic obstructive lung diseases during the last two decades. Numerical investigations on geometrical modeling [24-27], airflow field [28,29], and drug delivery [30-34] have been reported. Furthermore, Computational Aeroacoustics (CAA) has been also employed to simulate the generation and propagation of noises in pipes [35,36], ducts [37], nose-throat airways [38,39], main airway [40], and constricted T-branch model [41].
The generation of wheezes is complex and cannot be understood completely unless the influence of the involved factors is investigated separately and thoroughly. One prominent feature of asthma is the constriction of airways, which has the most significant impact on airflow patterns and the resulting lung sounds. Computational Aeroacoustics (CAA) can quantitatively evaluate the influence of constriction and is attractive in this area. However, up till now, the application of CAA in the generation of lung sounds in the constricted lower respiratory tracts has scarcely been reported. Hence, based on CFD and CAA, the generation of lung sounds in airways (30% diameter reduction) is simulated in this paper, and the results are further compared with those from normal airways.
Numerical Method
Geometrical Model
As asthma mainly affects the small airways, a 3-D pulmonary model of G5-G8 is reasonable. Additionally, airway narrowing is a characteristic feature of patients who have asthma, and it may be the leading factor producing turbulence flow and wheezes. To represent asthma-associated airway narrowing, a 30% diameter reduction was implemented, which is consistent with the reports of Brown and Mitzner [42].
An idealized geometrical model is more appropriate in analyzing the influence of the airway narrowing. So, based on Weibel's 23-generation lung model [43], a 3-D model for 30% constriction is prepared and shown in Figure 1(a). The Geometric parameters are illustrated in Table 1 [44]. Tetrahedron elements were used to mesh the model in Ansys ICEM (Figure 1b) and the cell number was 1345,786 (Table 1) (Figure 1a,1b).

Figure 1: Geometrical model of G5-G8 (1-10 represent acoustic receiver locations, receivers 1-9 are in the airways and receiver 10 is on the body surface).

Table 1: main parameters of geometric model (unit: mm).
It is worth mentioning that these models were not patient-specific, the reasons why we choose the idealized ones are as follows:
1. Though many real geometrical models have been reported by using the data from CT or MRI [29,30], to the best knowledge of authors, it is almost impossible to develop the diameter reduced models based on the real ones with the software such as Pro-E, since the parameters such as curve, surface and diameter are all irregular.
2. If the patient-specific models are used to compute the aeroacoustic noise with the direct mothod, the associated computational cost will become prohibitive. It is reasonable to choose the idealized geometry instead of real one, since they are both effective to evaluate the influence of airway constriction.
Governing Equations
The sonic sources, which are induced by eddies in the transient flow, are distributed in the whole flowing area, so the flow field should be computed first, then followed by the acoustic field.
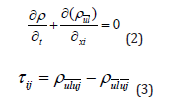
1. Flow Field by CFD
For flow in smooth cylindrical pipes, laminar flow occurs at low Reynolds numbers which is less than 2000. The flow will change from laminar to turbulent in the range of Reynolds numbers from 2000 to 4000 and Reynolds numbers greater than 4000 indicate fully turbulent flow. However, bifurcation geometries often experience transitional and turbulent flows at much lower Reynolds numbers [45]. Grigorio, Kostas, and Andrew also proposed the mixed turbulent-laminar flow is mostly encountered in human airways [46]. Besides, airway constriction in asthma can lead to higher Reynolds numbers, which may range from approximately 100 to 5900 in this study. Furthermore, the respiratory sounds can only be produced by turbulent airflow [47], turbulent solutions are necessary to resolve the flow fields and evaluate the associated aero-acoustic noises. LES (Large eddy simulation) was more suitable to analyze transient flows and then selected for this study with a sufficient degree of accuracy without being prohibitively expensive.
Within the LES method, small eddies are calculated by using a sub-grid scale model whilst also filtered versions of the Navier-Stokes equations are used for calculating the large-scale motion of the flow. Accordingly, the velocity is decomposed into two parts:  , where is filtered velocity
  and is the subgrid-scale velocity. The filtered Navier–Stokes equation is given in Eq. (1) as follows:
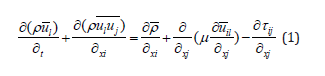
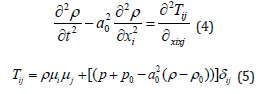
Where, i,j=1,2,3; ρ denotes density; μ is turbulent viscosity coefficient; τij is known as sub-grid scale stress.
2. Acoustics Computation
In this paper, FW-H method was used to compute the aero-acoustics field. First, the Lighthill equation is derived from N-S equation:
Subsequently, in order to solve the acoustic problem induced by moving objects in fluid, Ffowcs Williams & Hawkings proposed the generalized function method, i.e., the FW-H equation:
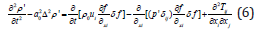
Where: 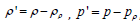 , Tij is Lighthill tensor. The three parts in the equation’s right side can be regarded as three types of sonic sources: monopole, dipole, and quadrupole, which are caused by surface acceleration or displacement distribution, surface pressure fluctuations, and fluid turbulence, respectively.
Computational set-up and Boundary Conditions
Since wheezes during exhalation are more obvious than that during inhalation, the transient analysis of exhalation under breathing conditions (60L/min) was implemented in this work. Inlets are set on the end surfaces of G8; the instantaneous values for the velocity profile were generated by the following equation [48] and shown in (Figure 3).
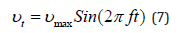
Where: vmax is the maximum inlet velocity, t is the nondimensional time, and f is the breathing frequency in cycles per unit of time. User-Defined Functions (UDFs) hooked in Ansys Fluent are given to set the above inlet velocity profile. The upper surface of G5 is the outlet, and the pressure outlet condition is applied.
The LES algorithm using the Smagorinsky sub-grid-scale model within ANSYS Fluent was used to analyze the flow first. The total solution period was 1.5 s, and the time step was chosen to be 1.5E-4s. Then, by using Ffowes-Williams&Hawkings model, the aero-acoustics field is simulated with the same solution period.
The fluid is assumed to be incompressible, as the flow speed is very low sub-sonic. The air is therefore treated as isothermal, and modeled using the ideal gas equation of state. Fluid properties are shown in (Table 2).

Table 2: Fluid properties.
Validation
The current simulation has been validated via comparisons with experimental data in Figure 2 For details of these particular case studies, see Zhaso and Lieber [49]. Generally, a good agreement between the simulated and experimental results has been achieved. This validation establishes the credibility of the present numerical method to tackle the airflow problem and the following aero-acoustic analysis in human airways (Figure 2).
Figure 3 and Figure 4 show the velocity and pressure fields on the symmetrical plane (y=0) under 45L/min.

Figure 2: Comparison of transient velocities (t=0.1T) in a single bifurcation with Lieber and Zhao [49].

Figure 3: Velocity profiles in the airway model during exhalation under 45L/min at: (a) t =0.06s; (b) t =0.75s; and (c) t =1.475s.

Figure 4: Pressure profiles in the airway model during exhalation under 45L/min at: (a) t =0.06s1; (b) t =0.75s; and (c) t =1.475s.
One can note:
I. both the velocity and the static pressure first increase, reach to the peak value at 0.75s and then falls gradually. Higher velocity or pressure can easily lead to turbulence flow. And this means a larger aero-acoustic noise will be produced at the middle of the exhalation.
II. The pressure and the velocity in junctions (especially that between G6 and G7) vary more greatly than those in the tubes of all generations. For example, velocity varies from 0 to 3.73m/s in junction between G7 and G6 (Figure 3 (b), which is much higher than those in other positions; And the pressure only decreases from 19.6Pa to 18.2Pa in tubes of G7; in contrast, pressure falls sharply from 18.2Pa to 15.6Pa in the 2 junctions between G7 and G6 (Figure 4 (b). This can be explained as follows: after rushing from 2 daughter airways, two blasts of air will crash and converge with each other and will result in a higher pressure or velocity area near the higher generation of airways, and a lower pressure or velocity area near the two daughter airways. So, the velocity and pressure fluctuations will produce the quadrupole and dipole sonic source, respectively.
Thus, one may suggest that the aero-acoustic noises are most likely to be produced in the junctions between airways, and that in the junction between G7 and G6 may be the highest one. Additionally, the noise will reach the peak value in the middle of the exhalation (about 0.75s) (Figure 5).

Figure 5: Contour of vorticity (Q-criterion) magnitude in the symmetry plane (z=0).
Forgacs proposed that it is only turbulent airflow that is capable of producing respiratory sounds [47]. Vortices are a major component of turbulent flow. In order to identify the turbulent vortices formed in airways, the widely used Q-criterion visualization (Q represents the balance between the rate of vorticity and the rate of strain) is obtained and illustrated in figure 5.
Obviously, the vorticity (Q-criterion) first increases, reaches the peak value at 0.75s, then falls gradually. Vorticity is the identification of the vortices, so higher vorticity generally means a stronger turbulence flow that is the cause of aeroacoustic noise. As a result, a larger aero-acoustic noise may be produced in the middle of the exhalation.
It can be clearly, seen that the boundary layer near the walls of the airways appears to be laminar and no evident turbulence structures appear due to the smaller vorticities. Vorticities at junctions are higher than those in the tubes of all generations. For example, at 0.03s, the peak value of vorticity is located at junctions between G7 and G6. This phenomenon can be explained as follows: after rushing from 2 daughter airways, two blasts of air will crash with each other and converge, then result in a higher pressure or velocity area near the higher generation of airways and a lower pressure or velocity area near the two daughter airways. Then in the junctions, the rollup of turbulent eddies is observed due to boundary layer flow separation and turbulence transition. The velocity and pressure fluctuations above may further produce the quadrupole and dipole sonic sources, respectively. Thus, it may suggest that lung sounds are most likely to be produced in the junctions between airways. Additionally, the sound will reach the peak value in the middle of the exhalation (about 0.75s).
In Figure 1 (b), ten receivers are placed in the airways to investigate the lung sounds: receivers 2, 4, 6, and 8 are located at the centers of tubes G8, G7, G6, and G5 respectively; receivers 3, 5, and 7 are at the junctions of G5-G6, G6-G7, and G7-G8 respectively; receiver 1 and receiver 9 lie in the centers of inlet and outlet respectively; receivers 10 is situated on the surface of the body (Figure 6).
The SPL (sound pressure level) was computed based on the whole airway (G5-G8). Figure 6 shows the predicted SPL for exhalation (0-1.5 s) in the frequency range of 0-3300. The smallest time step size was 1.5E-4 s, which was equivalent to a maximum frequency of 3300 Hz. The highest SPL occurs in the range of 0-20 Hz, which is below the audible frequency of human ears. There were three energy peaks at approximately 970, 1900, and 2850 Hz (Figure 7).
Figure 5 exhibits the computed average sound pressure and the Sound Pressure Level (SPL) of various receivers for the numerical simulations. For the 30% diameter reduced airways, the average SPLs at receivers 3, 5, and 7 are 132.89, 133.26, and 128.99dB, respectively; in contrast, the average SPLs at receivers 2, 4, 6, and 8 are 130.8, 131.4, 132.40, and 128.11dB. So, lung sounds at junctions (receivers 3, 5, and 7) are higher than those at the tubes (receivers 2, 4, 6, and 8). Receiver 5 has the highest value of average sound pressure and average sound pressure level, which means the lung sound is peaked at the junction between the G6 and G7 tubes. Moreover, the average SPL on the body surface (receiver 10) drops quickly to 40dB, which is approximately 70dB lower than those inside the airways. This marked discrepancy can be attributed to the dissipative behavior of the sound through the medium, namely, the tissue (muscles and bones) significantly impaired the propagation of the lung sounds.

Figure 6: Spectral Analyses of Pressure Signal for receiver 1-10.

Figure 7: Average sound pressure (a) and average sound pressure level (b) of various receivers.
Both the average sound pressure and the average SPL inside the airways with a 30% diameter reduction are notably higher than those in the normal airways, so the constriction of airways can lead to a louder lung sound. It is also observed that a 30% diameter reduction only results in a slight rise in lung sound on the body surface (receiver 10), namely, the average sound pressure increases from 0.0011Pa to 0.0021Pa, and the average SPL increases from 35dB to 40 dB. This means it is difficult to obtain the situation inside the airways with stethoscope since the signals on the body surface cannot accurately reflect the variation of airways such as remolding, constriction, and inflammation (Figure 8).
Since the normal breathing sound or wheezes usually range from 100 Hz to 1000 Hz, the spectral features of receiver 1 between 20-1000 Hz are further illustrated in Figure 8. According to Li S H [50], the peak intensity of wheezes was mainly distributing from 250 Hz to 500 Hz, and is relatively narrower than that of normal breathing sounds. In Figure 7, a comparatively higher sound pressure level is found in the range of 220 - 400Hz (black circle). The intensity of wheezes at frequencies less than 200Hz is lower. In Figure 7, the curve is steep as it looks at lower frequencies (<200Hz), though, the lung sounds may not be heard as the ear is less sensitive to low audio frequencies, and the actual sound pressure level should be decreased. So, to some extent, the constriction of airways did play a certain part in the generation of the wheezes.

Figure 8: Comparison of Spectral Analyses of receiver 1 between the 30% diameter reduced airways and the normal airways.
Despite the similarities above, significant differences are found between the computed lung sounds and the true wheezing sounds [50]. Several factors could weigh heavily for this discrepancy, first, the mechanical property and the flutters of airways were not considered in this work. Second, the input waveform was simplified as a sinusoidal wave which may affect the computation of the airflow and the lung sounds, so the improved waveform should be considered in the subsequent research. The generation of wheezes is a complicated process, which is caused by a number of factors, such as the vibration of the walls, turbulent flow, remolding of the airways, geometrical model, etc. The model presented can be a first step to constructing a functional method that in the future could shed light on the generation of wheezes.
Conclusion
In order to investigate the lung sounds of asthma, simulations of the aero-acoustissc noises during exhalation have been carried out on a 3-D geometrical model of lower respiratory tracts (G5-G8) with a 30% diameter reduction, and the results have been further compared with those from the normal airways. The conclusions are drawn as bellows:
1. Turbulent vortices mainly exist in the junctions between tubes and the vorticity (Q-criterion) increases to the peak value in the middle of exhalation.
2. The lung sounds at the junctions between airways are higher than those of tubes, the highest value of which lies at the junction between G7 and G6 in the middle of exhalation.
3. Three dominant frequencies (970, 1900, and 2850 Hz) are found in the resulting lung sounds in the 30% diameter reduced airways.
4. Due to the 30% diameter reduction, the average sound pressure levels inside the airways decrease by 12-20 dB. In contrast, a 30% diameter reduction only leads to a slight rise in lung sounds on the body surface, namely, average SPL increases from 35 dB to 40 dB.
Conflict of Interest
No conflict of interest exits in the submission of this manuscript, and manuscript is approved by all authors for publication. I would like to declare on behalf of my co-authors that the work described was original research that has not been published previously, and not under consideration for publication elsewhere, in whole or in part. All the authors listed have approved the manuscript that is enclosed.
Data Availability Statement
All relevant data are within the paper.
Funding Statement
This research was funded by grant from National Natural Science Foundation of China, number 81670027.
Acknowledgement
None.
References
- (2018) The Global Asthma Report. Auckland, New Zealand: Global Asthma Network.
- Decramer M, Janssens W, Miravitlles M (2012) Chronic obstructive lung disease. The Lancet 7;379(9823): 1341-1351.
- Wilkins RL, Dexter JR, Murphy RL, DelBono EA (1990) Lung sound nomenclature survey. Chest 98: 886-889.
- Nagasaka Y (2012) Lung Sounds in Wheezesal Asthma. Allergology International 61: 353-363.
- Meslier N, Charbonneau G, Racineux JL (1995) Wheezes. European respiratory journal 8(11): 1942-1948.
- Pasterkamp H (2018) The highs and lows of wheezing: a review of the most popular adventitious lung sound. Pediatric pulmonology 53(2): 243-254.
- Floyer J (1726) A Treatise of the Asthma. London: Wilkin & Innys.
- Williams CJB (1833) A Rational Exposition of the Physical Signs of the Diseases of the Lungs and Pleura. London: Churchill.
- Forgacs P (1967) Crackles and wheezes. Lancet 2: 203-205.
- Shabtai-Musih Y, Grotberg JB, Gavriely N (1992) Spectral content of forced expiratory wheezes during air, He, and SF6 breathing in normal humans. J Appl Physiol 72: 629-635.
- Bertram CD, Gaver DP (2005) Bio-fluid mechanics of the pulmonary system. Ann Biomed Eng 33(12): 1681-1688.
- Bertram CD (2008) Flow-induced oscillation of collapsed tubes and airway structures. Respiratory physiology & neurobiology 163(1-3): 256-265.
- Grotberg JB, Davis SH (1980) Fluid-dynamic flapping of a collapsible channel: sound generation and flow limitation. J Biomech 13(3): 219-230.
- Grotberg JB, Reiss ES (1982) A subsonic flutter anomaly. J Sound Vib 80: 444-46.
- Grotberg JB, Gavriely N (1989) Flutter in collapsible tubes: a theoretical model of wheezes. J Appl Physiol 66(5): 2262-2273.
- Gavriely N, Palti Y, Alroy G, Grotberg JB (1984) Measurement and theory of wheezing breath sounds. J Appl Physiol: Respirat Environ Exercise Physiol 57(2): 481-492.
- Gavriely N, Kelly KB, Grotberg JB, Loring SH (1987) Forced expiratory wheezes are a manifestation of airway flow limitation. J Appl Physiol 62(6): 2398-2403.
- Shabtai-Musih Y, Grotberg JB, Gavriely N (1992) Spectral content of forced expiratory wheezes during air, He, and SF6 breathing in normal humans. J Appl Physiol 72(2): 629-635.
- Schroter RC, Sudlow MF (1969) Flow patterns in models of the human wheezesal airways. Respir Physiol 7(3): 341-355.
- Hardin JC, Patterson JL (1979) Monitoring the state of the human airways by analysis of respiratory sound. Acta Astronaut 6(9): 1137-1151.
- Korenbaum VI, Safronova MA, Markina VV, Pochekutova IA, D'yachenko AI (2013) Study of the formation mechanisms of forced expiratory wheezes in a healthy person when breathing gas mixtures of different density. Acoustical Physics 59: 2040-2049.
- Lee P, Tan ZY, Pham T (2018) All that wheezes is not asthma, Thorax 73(8): 792.
- Skytt N, Bønnelykke K, Bisgaard H (2012) “To wheeze or not to wheeze’’: That is not the question. J Allergy Clin Immunol 130(2): 403-407.
- Neves LA, Frere AT, Nascimento AV, Santos CE (2003) Virtual Images of Lung structures. Annual International Conference of the IEEE Proceedings 1: 529-532.
- Martonen T, Fleming J, Schroeter J, Conway J, Hwang D (2003) In silico modeling of asthma. Adv Drug Deliv Rev 18;55(7): 829-849.
- Carson JP, Einstein DR, Minard KR, Fanucchi MV, Wallis CD, et al. (2010) High resolution lung airway cast segmentation with proper topology suitable for computational fluid dynamic simulations. Comput Med Imaging Graph 34(7): 572-578.
- Burrowes KS, Doel T, Brightling C (2014) Computational modeling of the obstructive lung diseases asthma and COPD. J Transl Med 28;12 Suppl 2(Suppl 2): S5.
- Li Z, Kleinstreuer C, Zhang Z (2007) Simulation of airflow fields and microparticle deposition in realistic human lung airway models. Part I: Airflow patterns. European Journal of Mechanics B/Fluids 26: 632-649.
- Pirnar J, Dolenc-Grošelj L, Fajdiga I, Žun I (2015) Computational fluid-structure interaction simulation of airflow in the human upper airway. J Biomech 15;48(13): 3685-3691.
- Chen X, Zhong W, Zhou X, Jin B, Sun B (2012) CFD–DEM simulation of particle transport and deposition in pulmonary airway. Powder Technology 228: 309-318.
- Piglione MC, Fontana ID, Vanni M (2012) Simulation of particle deposition in human central airways. European Journal of Mechanics B/Fluids 31: 91-101.
- Soni B, Aliabadi S (2013) Large-scale CFD simulations of airflow and particle deposition in lung. Airway Computers & Fluids 88: 804-812.
- Rahimi-Gorji M, Pourmehran O, Gorji-Bandpy M, Gorji TB (2015) CFD simulation of airflow behavior and particle transport and deposition in different breathing conditions through the realistic model of human airways. Journal of Molecular Liquids 209: 121-133.
- Jókay Á, Farkas Á, Füri P, Horváth A, Tomisa G, et al. (2016) Computer modeling of airway deposition distribution of Foster(®) NEXThaler(®) and Seretide(®) Diskus(®) dry powder combination drugs. Eur J Pharm Sci 10:88: 210-218.
- Xu Q, Zhang L, Liang W (2013) Acoustic detection technology for gas pipeline leakage. Process Safety and Environmental Protection 91(4): 253-261.
- Liu C, Li Y, Meng L, Wang W, Zhang F (2014) Study on leak-acoustics generation mechanism for natural gas pipelines. Journal of Loss Prevention in the Process Industries 32: 174-181.
- Astley RJ, Sugimoto R, Achunche IM, Kewin MF, Mustafi P, et al. (2010) A review of CAA for fan duct propagation and radiation, with application to liner optimization. Procedia Engineering 6: 143-152.
- Xi J, Si X, Kim JW, Guoguang Su, Haibo Dong (2014) Modeling the pharyngeal anatomical effects on breathing resistance and aerodynamically generated sound. Medical & biological engineering & computing 52(7): 567-577.
- Xi J, Wang Z, Talaat K, Carri Glide-Hurst, Haibo Dong (2018) Numerical study of dynamic glottis and tidal breathing on respiratory sounds in a human upper airway model. Sleep and Breathing 22(2): 463-479.
- Van der Velden WCP, van Zuijlen AH, de Jong AT, C T Lynch, L J Hoeve, et al (2016) Acoustic simulation of a patient's obstructed airway. Computer Methods in Biomechanics and Biomedical Engineering 19(2): 144-158.
- Saputra GP, Nozaki K, Satoshi II, Shigeo Wada (2015) Aeroacoustic sound alteration in airway bronchoconstriction, represented by a constricted T-branch model. Journal of Biomechanical Science and Engineering 10(1): 14-00246.
- Brown RH, Mitzner W (2003) Functional imaging of airway narrowing. Respiratory physiology & neurobiology 137(2-3): 327-337.
- Weibel ER (1963) Morphometry of the Human Lung. New York: Academic Press Inc.
- Chen X, Zhong W, Jin B (2011) Simulation on movement and deposition of inhalable contaminant particles in lower respiratory tract. JOURNAL OF SOUTHEAST UNIVERSITY (Natural Science Edition) 41: 393-399.
- Longesta PW, Vinchurkara S, Martonen T (2006) Transport and deposition of respiratory aerosols in models of childhood asthma. Aerosol Science 37: 1234-1257.
- Priftis KN, Hadjileontiadis LJ, Everard ML (2018) Breath Sounds. 1st Ed. Cham: Springer.
- Forgacs P (1969) Lung sounds. Br J Dis Chest 63(1) :1-12.
- Soni B, Aliabadi S (2013) Large-scale CFD simulations of airflow and particle deposition in lung. Airway Computers & Fluids 88: 804-812.
- Lieber B, Zhao Y (1998) Oscillatory Flow in a Symmetric Bifurcation Airway Model. Annals of Biomedical Engineering 26(5): 821-830.
- Li SH, Lin BS, Tsai CH, Cheng-Ta Yang, Bor-Shyh Lin (2017) Design of wearable breathing sound monitoring system for real-time wheeze detection. Sensors 17(1): 171-186.


 We use cookies to ensure you get the best experience on our website.