Research Article 
 Creative Commons, CC-BY
Comparison of Three Artificial Intelligence Analysis Methods with Visual Truth Using Computed Tomography for Assessment of Covid-19 Patients
*Corresponding author: Atul Kapoor, Radiology Department, Advanced Diagnostics and Institute of Imaging Amritsar. India.
Received: October 21, 2024; Published: October 25, 2024
DOI: 10.34297/AJBSR.2024.24.003215
Abstract
Objectives: Comparison of three different Artificial Intelligence (AI) methods of assessment for patients undergoing Computed Tomography (CT) for suspected Covid-19 disease. Parameters studied were probability of diagnosis, quantification of disease severity and the time to reach the diagnosis.
Methods: 107 consecutive patients of suspected Covid-19 patients were evaluated using the three AI methods labeled as AI-I,II, III along with visual analysis labeled as VT for predicting probability of Covid-19, determining CT Severity Score (CTSS) and Index (CTSI), Percentage Opacification (PO) and High Opacification (POHO). Sensitivity, specificity along with area under curves were estimated for each method and the CTSS and CTSI correlated using Friedman test.
Results: Out of 107 patients 71 patients were Covid-19 positive and 20 negative by RT-PCR while 16 did not get RT-PCR done. AI-III method showed higher sensitivity and specificity of 93% and 88% respectively to predict probability of Covid 19. It had 2 false positive patients of interstitial lung disease. AI-II method had sensitivity and specificity of 66% and 83% respectively while Visual (VT) analysis showed sensitivity and specificity of 59.7% and 62% respectively. Statistically significant differences were also seen in CTSI and PO estimation between AI-I and III methods (p<0.0001) with AI-III showing fastest time to calculate results.
Conclusions: AI-III method gave better results to make an accurate and quick diagnosis of the Covid-19 with AUC of 0.85 to predict probability of Covid-19 along with quantification of Covid 19 lesions in the form of PO, POHO as compared to other AI methods and by visual analysis.
Keywords: Covid-19, Computed Tomography, Artificial Intelligence (AI)
Introduction
Covid-19 is a highly infectious disease affecting more than 2.8 million people worldwide as on this date. Due to its high rate of infectiousness rapid tools are needed for early and accurate diagnosis and to monitor the progress of disease in diagnosed patients [1]. So far RT-PCR tests using throat and nasal swabs form the backbone of diagnosis and are gold standard but is marred by reduced sensitivity with high false negative rates until 30-35%, more time consuming and has false positives [2]. The epidemic is thus driving researchers to think of more efficient ways to cope with the huge demand for diagnosis. Imaging has been used in China on a large scale to tackle the endemic and there have been numerous reports about the experiences using CT scans and China’s national guidelines have recommended CT scans as a key method in diagnosing Covid-19 [3]. Typical reported features on CT of Covid-19 include multifocal ground glass opacities and consolidations with peripheral and basal predilection [1,4]. Based on this Radiological society of North America has proposed CORADS classification system on a scale of 1-6 [5,6]. However American college of Radiology in June 2020 issued guidelines mitigating its use for diagnosis of COVID-19 mainly due to fear of contaminating radiology facilities and due to its lack of specificity [7]. So, what should be the role of radiology in the current pandemic is a question being debated [8,9]. Many researchers have come up with Artificial Intelligence (AI) based prototype software’s to automate diagnosis of Covid-19 disease to expedite early and accurate diagnosis which should help physicians triage patients into Covid-19 designated words for treatment and help contain further spread of disease [10].
We evaluated the results of three such AI based methods using Computed tomography images of the chest done on patients suspected of having Covid-19 disease with following objectives a) To estimate the ability of AI to diagnose Covid-19 disease b) Compare the results of different AI methods in diagnosing and severity of disease c) Time taken for making diagnosis. d) Comparison of AI with visual analysis results.
Material and Methods
The study was designed to evaluate the usefulness of AI based software’s based on the computed tomographic images of patients suspected of having Covid-19 disease. The study comprised 109 consecutive patients of Covid-19 disease who underwent computed tomographic examination in the month of July2020. After obtaining consent from local ethics review committee and informed consent from the patients plain computed tomographic examination was done on 128 slice Siemens Go top system(Forchheim, Germany AG) using standard operating parameters with medical records of all patients were examined before the study and chief complaints, laboratory data along with presence of any co morbid disease was recorded. Short follow up was also done in all patients for knowing the RT-PCR and clinical status of all patients from their families and treating physicians. All necessary precautions regarding the use of personal protective equipment, disinfection of the scan room and department were also taken before and after each examination and patients referred to respective medical units. The imaging data was then transferred to local PACS and then sent to collaborators for analysis. Collaborations were made with three different AI software companies to process the data a) AI-I programme using COVID-19 AI software from COVID-19 AI software Thirona BV Nijmegen Netherlands. B) AI-II programs from Quibim, Valencia Spain. C) AI-III programs Pneumonia analysis from Siemens Forchheim Germany AG. D) VT-Visual Truth programme consisting of visual analysis by two radiologists on PACS and all conclusions were based on consenus. The AI-I to II were all cloud-based programs with analysis being done on servers of respective vendor companies while AI-III programme was based on on site analysis done on Siemens Syngovia Frontier server.
The following parameters were evaluated for each patient using all four methods.
a. Mean time taken for each evaluation by all four methods.
b. Diagnostic probability of covid
c. Grading the severity of disease in terms of CT Severity Scale (CTSS) and CT Severity Scale Index(CTSSI), Percentage Opacification (PO) and Percentage High Opacification(POHO) and dominant lobe involvement (Figure 1a,b,c).
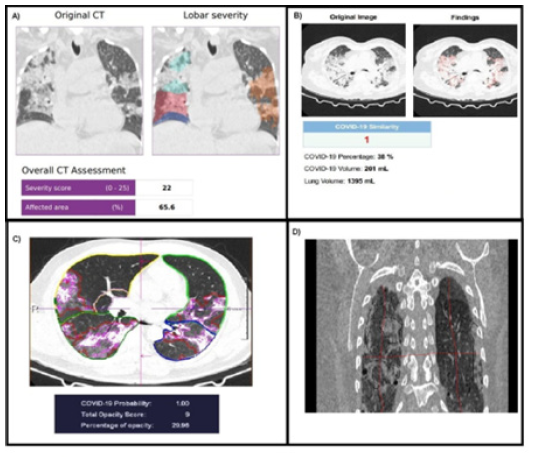
Figure 1: A). Plain CT evaluation by AI-I method showing CTSS of 22 and CTSI 88% with percentage opacification of 65.6%. B). AI-II showing indeterminate CTSS and CTSI with PO of 38% and Covid probability of 1.0. C). AI-III in same patient with CTSS and CTSI 9 and 45% with Covid probability of 1.0 with PO of 38% d). VT analysis image with CTSS and CTSI of 8 and 40%.
Time taken from loading the data to respective servers to completion of analysis was recorded for each patient by AI-I to III methods and by VT method and overall mean calculated per study. The CTSS score was calculated as follows based on method by Bernheim [4] and estimated the degree of lung involvement . AI-I method used a score of 0-25 based on score of 0-5 as follows •0: lobe is not affected. •1: 1-19% of the lobe is affected. •2: 20-39% of the lobe is affected. •3: 40-59% of the lobe is affected. •4: 60-79% of the lobe is affected 5.80-100% while in AI-III based CTSS used a score of 0-20 as follows •0: lobe is not affected. •1: 1-25% of the lobe is affected. •2: 25-50% of the lobe is affected. •3: 50-75% of the lobe is affected. •4: 75-100% of the lobe is affected. In AI-I method no severity scoring was done. VT method used a score of 0-20 based on method of dividing lungs into anteroposterior and mediolateral quadrants on coronal views and assigning a score of 0-5 for each quadrant based on percentage of lung involved from 0-20%,20-40%,40-60%,60-80% and 80-100% respectively. CTSSI was calculated for each score to compare the scores determined by each method as:
a) CTSS/Total Score x100%.
b) Percentage of Opacity (POO) was calculated as follows:
POO=100×Volume of predicted abnormalities of lung/volume of lung mask.
c) Percentage of High Opacity (POHO): 100x volume of predicted high opacity/volume of lung mask.
d) Probability of Covid-19 was depicted based on Area under curve method and a threshold value of more than 0.85 was deemed as having Covid-19 based on AI-II, III methods while VT method probability was based on visual analysis and expertise by both consensus readers.
e) The pattern of distribution of lung lesions was determined as lobar, unilateral or bilateral or whole lung involvement.
All the results were statistically analysed using Analyse-IT software (Leeds, UK) to determine the parameters of mean, standard deviation, correlation was done using Friedman correlation for pair groups between all four methods and Sensitivity, specificity along with Area under curves calculated.
Results
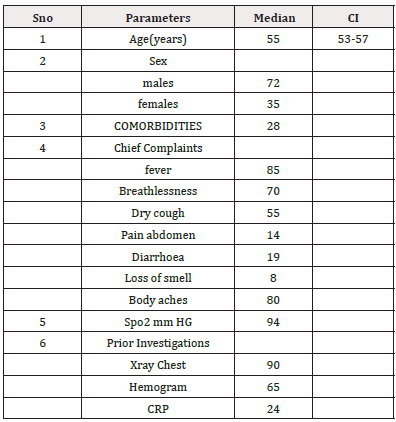
The study comprised of consecutive 109 patients of suspected Covid-19 patients whose computed tomography examinations showed focal or diffuse ground glass opacities and had clinical presentations suggestive of Covid-19 disease. The demographic data of patients is listed in (Table 1). The mean age of patients was 53.6 years (51.1-56.1, 95% CI). Out of these 72 were males 35 females. 23 patients had comorbidities, of which diabetes mellitus was the most common .
Probability of Covid-19 disease (Figure 2):
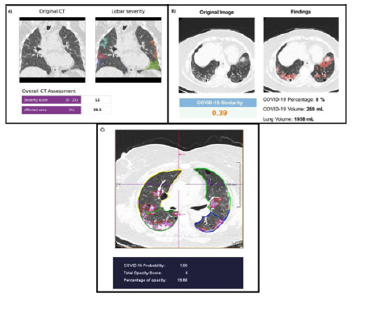
Figure 2: A). Plain CT image of non-covid patient with pulmonary edema evaluated by AI-I showing CTSI of 4, CTSI 16% with PO of 5.2%. B).AI-II showing false positive Covid probability of 0.97 with PO of 4%. C). AI-III showing paracardiac central opacities with Covid probability of 0.08, CTSI of 7, CTSI 35% and PO 17%.
In the AI- I method there was no algorithm to calculate Covid-19 probability.
The AI-II method calculated Covid-19 probability with sensitivity and specificity of 63% and 83% with high false negative of 37% and false positive of 16.7% with a positive predictive value of 93%and negative predictive value of 35.7%. Data of 18 patients in the programme could not be processed and was labeled as a negative probability of 0.
AI-III method: Showed a sensitivity and specificity of 93% and 88% respectively with false positive and negative of 11% and 6% with a high positive predictive value of 97.2% and negative predictive value of 75%. There were only 5 false positive cases, all of whom had prior interstitial lung disease. VT method showed a sensitivity and specificity of 59.7% and 62% to diagnose Covid-19 with false positive and false negative of 37% and 40% respectively with positive predictive value of 83% and negative predictive value of 37% (Table 2).
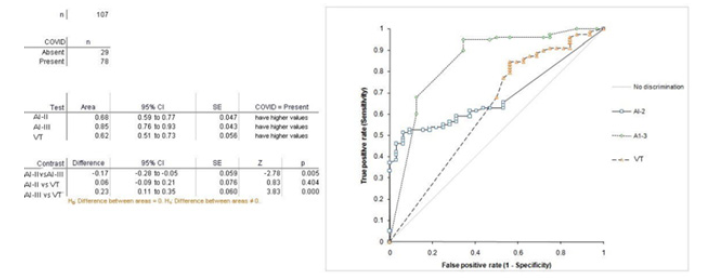
The Area under curve estimation showed for AI-II,III and VT methods as 0.85, 0.68 and 0.62 respectively with differences between AI-III and AI-II and VT method being statistically significant ( p-0.0001)(Figure 3).
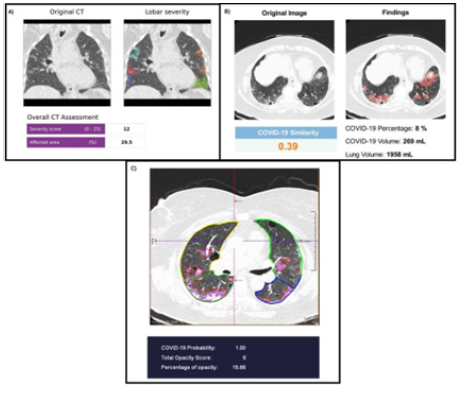
Figure 3: A) RT-PCR positive patient evaluated on AI-I showing CTSS of 12, CTSI 48% with percentage opacification of 29.5% on AI-I B). AI-II method in same patient showing PO 8% with false negative Covid probability. of 0.39,.C). AI-III shows CTSS6, CTSI 30% with Covid probability of 1.0 WITH PO 15.6%.
1. CTSS and CTSI estimation: (Figure 4)
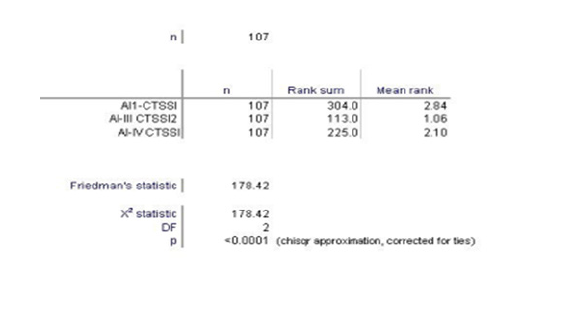
The AI-I method determined the CTSS in all patients with median CTSS of 12 (10-13 96.7%) and CTSI of 48% (median 40-52% 96.7% CI). AI-II method could not estimate the CTSS and CTSI . AI-III method and VT methods also determined the CTSS and CTSI with mean scores of 7 (6-9 96.7% CI), 35% (30-45 97.6% CI) for AI-III method and 6.50(6-9 96.7%CI) 32.5 (30-45 96.7%CI) respectively. Friedman correlation test was done between three methods of analysis and showed statistically significant differences between AI-III method and AI-I and VT methods(pvalue<0.0001).
2. Time Estimation for Results: Since AI-I,II methods were cloud-based methods the average processing time was 10 minutes, 25 minutes respectively with AI-II showing maximum number of incomplete processing results i.e. 18 patients. AI-III method showed the quickest processing time of 2 minutes and had the advantage of being onsite method and did not require transfer and loading of data from local PACS.
3. Percentage opacities (Figure 5):
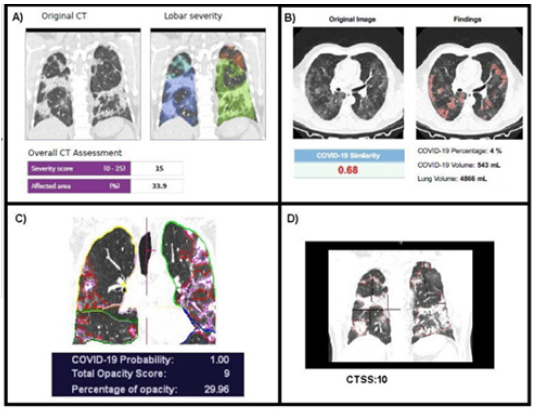
Figure 5: A) AI-I showing a RT PCR positive patient with PO of 33.9% and CTSS 15, CTSI 60%. B). A PO of 4% with Covid similarity of 0.68 seen by AI-II. C). AI-III shows PO of 29% with CTSS and CTSI of 9 and 45% with Covid probability 1.0. D). VT method correlates CTSS 10 and CTSI of 50%.
AI-III method showed median percentage opacification of 21.0 (median 15-30 96-7%CI) while AI-II underestimated percentage opacities with median value of 1.0 while AI-I and VT method did not dlineate percent opacification.
4. The percentage of high opacities: was estimated only by AI-III method with a median of 4.0 (2.5-5.2 96.7%CI).
5. Lobar dominance: was computed by all the methods with common patterns being bilateral lower lobe predominance followed by complete lung involvement.
RT-PCR was done in 91 patients while 16 patients did not get RT-PCR, out of these there were 42 positive results for Covid-19 detection in the first test and 29 in second test while 20 were repeatedly negative. The sensitivity and specificity of AI-methods and VT method were calculated based on the 91 results of RT-PCR.
Discussion
Computed tomographic imaging has an important and undeniable role in the evaluation of patients with lower respiratory tract disease including suspected COVID-19. Evaluation using a Chest CT can be used to answer several questions in a clinical setting such as triage of a patient, diagnosis, assessment of severity and progression, and response to therapy. In a pandemic like this one timely diagnosis using imaging can be the essence of management and triage of such patients who report to clinics and hospitals with immediate results [11]. The study shows that use of AI with computed tomographic examination improves both the sensitivity and specificity for diagnosis compared with visual analysis method which was primary objective of the study . It is critically important to have probability algorithm in the AI methods to be able to answer the question of whether Covid-19 or not. Study shows that at this point of time not all AI methods have this ability as seen in AI-I method. Variations of probability were seen in the results between AI-II,III methods. AI-III showed the highest sensitivity and specificity in the present study of 93% and 88% respectively suggesting it is almost ready for clinical use with results being superior to visual analysis alone.
The probable reason for this being improved machine learning method used in this technique. The developers of this AI method used a supervised deep learning method based on 3D neural network in which a two-channel 3D tensor was used where the first channel contained CT Hounsfield units masked by lung segmentation while the second channel had probability maps of opacity classifiers of metric data [2,12]. This resulted in improved performance with AUC of 0.90(0.85-0.94 95%CI with sensitivity and specificity of 86% and 81% respectively which was similar to the results seen in the present study. Earlier AI methods like one used in AI-II used metric based AI classifiers based on opacity metrics with generation of heat maps and regression algorithms and showed reduced sensitivity specificity of 74% as was the case in this study. Similar results have also been shown by Li, et al., [13] who showed reduced false positive and negatives in making diagnosis with the use of 3D machine learning methods. CTSS has recently been proposed as a reliable measure to demonstrate correlation of the severity of disease with clinical condition and progression by many studies [14,15]. In the present study accurate scoring was possible with both AI-I and AI-III methods . AI-III method correlated well with the VT method I with no significant statistical differences (p-0.24) however significant differences were observed in comparison of AI-I method with AI-III and VT method while AI-II method could not elicit severity score. Study shows that lung and lobar and opacity segmentations is now possible with the use of Deep image to image network machines learning algorithms with high accuracy and speed and comparing with visual methods. AI quickly estimates quantitatively the severity of lung involvement which can triage such patients to covid units or to intensive care. Similar results have been shown by earlier studies [16,17].
Quantitative measures like PO and POHO with the use of AI also add on as additional measures along with CTSS to categorize the condition of the patient and can be compared on follow up evaluations which are not possible with visual assessments alone. However, variations in tested AI methods were seen in severity scores also between compared methods hence more robust methods must be added along with improved training data sets to achieve accurate segmentation algorithms which were probably used in AI-I,II methods If AI based methods are to be applied in routine clinical practice [16]. There should be complete and standardized objective measures of disease evaluation which were missing in some of the methods evaluated in this study. This would mean that some more time is required before AI comes into clinical use. The third objective of the study, i.e., determining time to diagnosis was also achieved in the study with AI-III method showing a mean processing time of 2 minutes which was quick enough to make the diagnosis of Covid-19. To deal with highly infectious disease like Covid-19 early diagnosis is the essence and onsite processing algorithms like used in AI-III should be preferred than cloud based evaluation techniques. To conclude, the addition of AI along with Computed tomography evaluation looks attractive and its use achieves the objectives set for evaluation in the present study especially with the use of AI-III method. It has the potential to improve the accuracy of diagnosis and shorten the time to make the diagnosis. The study shows limitations in various AI methods tested along with inter method variation of results in estimation of CTSS, percentage opacifications .Hence some more time may be required before it comes into clinical use. Out of the AI techniques compared AI-III method appears to be more advantageous and accurate compared with other AI methods including the visual method alone.
Acknowledgements
None.
Conflict of Interest
None.
References
- American Occupation Therapy Association (2014) Occupational Therapy Practice Framework: Domain and Process (3rd Edition). The American Journal of Occupational Therapy 68(1): 1-48.
- Sánchez Sellero MC, Sánchez Sellero P, Cruz González MM, Sánchez Sellero FJ (2014) Organizational Characteristics in the Labour Satisfaction in Spain. Rev Adm Empres.
- Kerner I, Rakovac M, Lazinica B (2017) Leisure-Time Physical Activity and Absenteeism. Arch Ind Hyg Toxicol 68: 159-170.
- National Institute for Occupational Safety and Health (2009) NIOSH Safety and Health Topic: Agriculture Safety. Retrieved July 16.
- WHO (2021) https://www.who.int/activities/promoting-well-being
- Ajani EN, Mgbenka RN, OnahO (2015) Empowerment of Youths in Rural Areas through Agricultural Development Programmes: Implications for Poverty Reduction in Nigeria. International Journal of Research in Agriculture and Forestry 2(2): 34-41.
- Price R (2019) Youth employment needs in Nigeria. Institute of Development Studies. Knowledge, evidence and learning for development (K4D).
- Health and Safety Executive (2018) Workplace Fatalities in Great Britain 2018. Annual Statistics July 4.
- Ekpenyong CE, Inyang UC (2014) Association Between Workers Characteristics, Workplace Factors, And Work-Related Musculoskeletal Disorders: A Cross-Sectional Study of Male Construction Workers in Nigeria. International Journal of occupation safety Ergon 20(3): 447-462.
- Van den Berge M, Hulsegge G, Van den Molen HF, Proper KI, Pasman HRW, et al., (2020) Adapting Citizen Science to Improve Health in an Occupational Setting: Preliminary Results of a Qualitative Study. International Journal of Env Res Public Health 17(19): 4917
- Adeyonu, AG, Ajala AO, Adigun GT, Ajiboye BO and Gbotosho OO (2016) Determinants of Sweet Potato Value Addition Among Smallholder Farming Households In Kwara State, Nigeria. Journal of Tropical Agriculture, Food, Environment and Extension 15(1): 17-22.
- Ogba O, Ahaotu EO, Ihenacho RO, Chukw AO (2020) Challenges of Small Poultry Farms in Layer Production in Ikwuano Local Government Area of Abia State, Nigeria. Sustainability, Agri, Food and Environmental Research 8(3): 194-204.
- International Wellbeing Group (2013) Personal Wellbeing Index-Adult (PWI-A).
- Khor S, Cummins RA, Fuller Tyszkiewicz M, Capic T, Jona C, et al., (2020) Australian Unity Wellbeing: - Report 36: Social connectedness and Wellbeing. Geelong: Australian Centre on Quality of Life, School of Psychology, Deakin University.
- Tomyn A J, Weinberg MK and Cummins RA (2015) Intervention Efficacy Among ‘At Risk’ Adolescents: A Test of Subjective Wellbeing Homeostasis Theory. Social Indicators Research 120(3): 883-895.
- Yinusa MB (1999) North farms alone: A study of rural livelihoods in the middle belt of Nigeria. DARE ASLD working paper 38.




 We use cookies to ensure you get the best experience on our website.