
Mini Review 
 Creative Commons, CC-BY
An Investing Strategy in Star Mutual Funds
*Corresponding author: Wu Dongfeng, Department of Bioinformatics and Biostatistics, School of Public Health and Information Sciences, University of Louisville, USA.
Received: May 19, 2025; Published: May 23, 2025
DOI: 10.34297/AJBSR.2025.27.003530
Mini Review
We need a sound strategy to make money in the stock market. As statisticians, we gradually realize that our strength is not in reading each company’s balance sheet, but in applying statistics to invest in mutual funds or Exchange-Traded Funds (ETFs), because funds and ETFs are composed of many stocks and follow statistical rules. We can apply our statistical knowledge in investing. We have spent some time on when to buy and when to sell mutual funds by classifying all mutual funds (and ETFs) into three categories: good, bad, and ugly, and we have just written an article on investing in ordinary (or bad) mutual funds [1]. However, there is a problem if we use the same principle to invest in good funds: their price will rarely fall below the median historical price, and most rarely fall below the 75th percentile. Using our previous strategy [1], there is a tendency for us to be attracted to ordinary mutual funds or ETFs and to forgo the good ones. So, we have developed a different strategy on when to buy and sell the star (or good) funds in this article. We hope this simple method could help decision-making in buying and selling star funds.
First, let’s give a clear definition of what a good or star fund is. Any fund with a four or five-star rating by Morning Star could be a good fund [2]. They are “good” because they have a good track record, and their prices have moved dramatically upwards over the past 10 years. About 10% of mutual funds or ETFs fall into this category, and most of them are index funds that track the S&P 500 or the Nasdaq index. Some sector funds also satisfy these requirements, such as Fidelity Select Semiconductors Fund (FSELX) or Fi delity Select Software & IT Services Portfolio Fund (FSCSX). Therefore, we call these star funds.
It is usually easy to use the dollar-average method to invest in a star fund, as they move upwards most of the time, until the time comes for a big market shift or bear market. So, we will give some guidelines on how to judge whether a market shift has happened. And even for a star fund, we want to get more juice out of it, which means we want to exit when it almost reaches its peak and enter when it reaches its local minimum or the price is below some mark. We will use the Fidelity 500 Index Fund (FXAIX) as an example to illustrate our strategy. This fund has a five-star rating from Morningstar. It is a large blend index fund that tracks the S&P 500. It has a positive return in eight out of the past ten years, except in 2018 (-4.40%) and 2022 (-18.13%). So, we consider FXAIX a good fund.
We used Yahoo Finance at https://finance.yahoo.com/ to download the price of FXAIX for the most recent ten years. We plotted the price data and found that this fund moved upward from around $65 to around $210. Then we carried out some basic data analysis to obtain the five-number summary of the price data: (minimum, 25th percentile, median, 75th percentile, maximum) and the mean/ average price of the FXAIX, see Table 1. Next, we check the percentile of the most recent price ($203.12 on 5/12/2025) against the historical price, and it is 96.8%. This means 96.8% of the historic price of FXAIX is less than $203.12. Does this mean FXAIX is overvalued, and we should not consider buying it today? Since its price has moved up dramatically in the past 10 years, we cannot only dwell in the past, so we fit a simple linear model to the data, assuming that there is a linear relationship between time (trading days) and the price:

where xi is the price, ti = i is the date, and εi is the random error that follows a normal distribution. There were n=2516 trading days in the past ten years. This is plotted in the left panel of Figure 1 (Table 1).
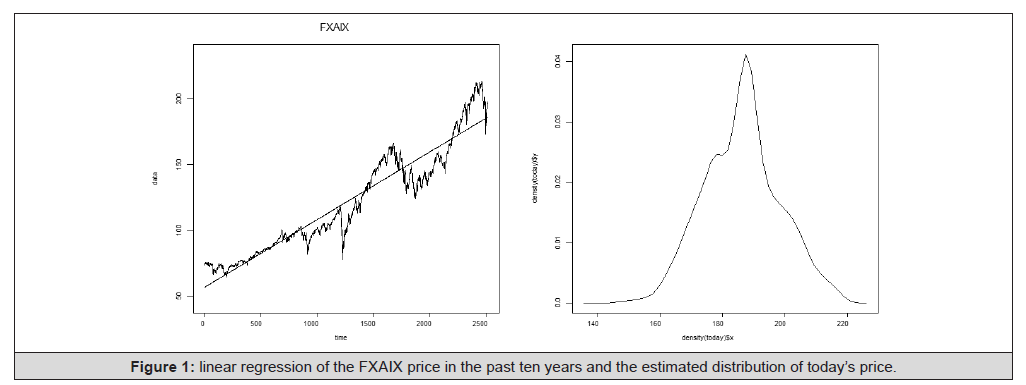
Figure 1: linear regression of the FXAIX price in the past ten years and the estimated distribution of today’s price.

Table 1: The five-number summary of the past ten years’ price of FXAIX.
Note*: The 10-year data was downloaded on 5/5/2025, with a price of $196.32 on 5/5/2025 at closing.
We then estimate today’s price of FXAIX using the linear
model and the distribution of its price based on the residuals.
The predicted price is calculated by  , where
 . The residuals can be obtained
by
. The residuals can be obtained
by  . There are six trading days since we
downloaded the data on 5/5/2025, so the estimated price for today
(5/13/25) would be
. There are six trading days since we
downloaded the data on 5/5/2025, so the estimated price for today
(5/13/25) would be  .The predicted
five-number summary for today’s price was summarized in Table
2. And the estimated density curve was plotted in the right panel of
Figure 1 (Table 2).
.The predicted
five-number summary for today’s price was summarized in Table
2. And the estimated density curve was plotted in the right panel of
Figure 1 (Table 2).

Table 2: The five-number summary of the estimated price of FXAIX for today (5/13/2025).
Given yesterday’s price of $203.12 (5/12/25), we calculated the percentile against the predicted price distribution, and it is 90.4%. Combined with the information that today’s SP500 is increasing, we don’t think it is wise to buy FXAIX today, as it is overvalued, most likely. However, let’s assume another scenario: if yesterday’s price is $185, then if we use the 10-year historic data, the percentile is 91.3%, but if we use the predicted data for today, the percentile is 41.1%, which is below the median and implies that we should consider buying FXAIX today. In general, we would recommend buying a fund if it is under the 85th or 90th percentile using the historic data, as in this situation, the predicted price for today usually falls below the regression line, which is the projected average price. We have collected all R commands to carry out this analysis in the Appendix of this article [3,4].
Here comes the summary: for a star mutual fund, since its price rarely goes down to the median, we can fit a simple linear regression using the past 10 years’ price data, and see whether the price falls below the regression line or not. If it is below the regression line, then we consider buying it, otherwise, we will just wait. And we can further decide to sell if the price is far above the regression line. And the data analysis should be updated every three or six months. We know that the price data is not independent, but depends on the previous day’s, however, this is a rough way to determine when to buy and sell for a star fund. More detailed methods can be developed by using the time series.
Acknowledgement
None.
Conflict of Interest
None.
Appendix:
R code to carry out the data analysis using FXAIX data.
Everything after the ## is the comments
Round (summary (FXAIX), 2) ##gives the five-number summary and rounds up to 2 decimals.
Mean (FXAIX<203.12) ##gives the percentile of the current price
##commands below plot Figure 1.
data=FXAIX;
n=length(data);
time=seq (1, n, 1); ##this is t_i
low=min(data)-20; ##to avoid fitted line out of range
high = max(data)+20; ##to avoid fitted line out of range
par (mfrow=c (1,2));
plot (time, data, type=’l’, main=’FXAIX’, ylim=c (low, high));
result=lm(data~time); ##fit a linear model
lines (time, fitted(result)); ##add the regression line
coef = result$coef; ##get the coefficients a and b
a=coef [1];
b=coef [2];
price=a+b*(n+6); ##predicted price for today
today=price+result$resid; ##distribution for today’s price summary(today)
mean(today<203.12) ##check percentile using yesterday’s price
plot(density(today), type=’l’); ##plot predicted distribution
References
- Dai C, David D, and Wu D (2025) A layman’s strategy of investing in ordinary mutual funds. American Journal of Biomedical Sciences & Research 26(5).
- Morningstar Ratings 101: What You Need to Know. https://www.morningstar.com/company/morningstar-ratings-faq.
- Yahoo Finance. https://finance.yahoo.com/.
- R software. https://www.r-project.org/.




 We use cookies to ensure you get the best experience on our website.