
Review Article 
 Creative Commons, CC-BY
Demographic Ageing Indicators in Patients Attending Primary Health Care: A Cross-Sectional Analysis from a Gerontological Perspective
*Corresponding author: Daniel Lopez-Hernandez, Clínica de Medicina Familiar “Division del Norte”, Instituto de Seguridad y Servicios Sociales de los Trabajadores del Estado, Cuidad de México, México.
Received:April 24, 2025; Published:April 24, 2025
DOI: 10.34297/AJBSR.2025.27.003533
Abstract
Aims: This study aims to describe the characteristics of demographic ageing by analysing ageing indicators within an older population attending a primary care unit. Study design: A descriptive, retrospective, and cross-sectional study with an analytical approach was designed. Place and Duration of Study: Ambulatory Care Medical Unit. The study was conducted from July 1st to October 31st, 2024, with Mexican patients attending the Family Medicine Speciality outpatient consultation at the Family Medicine Clinic “Division del Norte”, in Mexico City, from January 1st, 2022 to December 31st, 2022. Methodology: Data on health and sociodemographic variables were collected using the Medical Financial Information System “SIMEF system”. The study included information on 15 ageing indicators: Sex Ratio, Median Age, Percentage by broad age groups, Ageing Index (Iag), The Old-Age Index (IO-A), The Longevity Index (Ilong), The Senility Index (SI), The Generational Index of the Elderly (IGeld), The Total Dependency Ratio (TDR), The Old-Age Dependency Ratio (OADR), The Labour Force Structure Index (LFSI), The Friz Index, The Sundbarg Index, The Burgdofer Index, and The Sauvy’s Ageing Index (ISauvy). Results: The study included 17,918 patients, mostly females (63%), with an average age of 52.3 years old, with a Masculinity Index of 58.74. A significant portion of the population is aged 60 and over (41.2%) and 65 and over (30.5%), highlighting advanced demographic ageing. Males dominate older age brackets despite females being more numerous overall (Sexagenarians: females 20.2%; CI95% 19.5-20.9 vs. males 21%; CI95% 20.1-21.9, Septuagenarians: females 12.6%; CI95% 12-13.2 vs. males 14.8%; CI95% 14-15.7, p<0.01 and Octogenarians: females 5.6%; CI95% 5.1-6 vs. males 6.4%; CI95% 5.7- 7, p<0.01). Ageing and dependency indices reveal a significant burden of elderly care, particularly among females: IO-A60+ 729.87, IO-A 65+ 533.60, ILon 12.41, SI 39.46, IGeld 182.99, LFSI 259.37, and ISauvy 520.97. Conclusion: These findings emphasise the need for sex-specific and age-sensitive public health and social care planning.
Keywords:Aging, Demographic indicators, Primary care
Introduction
The ageing of the global population is one of the most significant demographic shifts of our time [8,21], with far-reaching implications for health (concerning medical care and budget allocation) and social systems worldwide (in terms of politics, policy, governance, public infrastructure, etc.) [13,19,21]. These challenges to society and health systems, alongside the epidemiological transition observed in the elderly population and the burden of comorbidities in these patients, have made ageing a global public health concern [12], particularly at the primary care level [1]. On the other hand, the older population of the European Union (EU) is projected to begin increasing in the coming years, particularly in relation to the number of people of working age, reflecting a broader global trend [5]. Moreover, by 2050, 80% of older adults will be living in low- and middle-income countries, underscoring the urgent need for these nations to strengthen their capacity to respond to the needs of an ageing society [21]. The pace of this change is unprecedented; in 2020, for the first time, the number of people aged 60 and over surpassed that of children under five [21]. Even in the few EU countries where the working-age population (those aged 20 to 64) is expected to grow, the population increase aged 65 and over will be significantly greater [5], highlighting a stark contrast in demographic trends and the growing weight of older age groups within the population structure. Furthermore, the proportion of the global population aged over 60 is expected to nearly double from 12% to 22% between 2015 and 2050 [21].
According to the United Nations (2023) [19], most of the least developed countries (LDCs-a category established by the UN in 1971) in Africa continue to experience high fertility rates, rapid population growth, and predominantly youthful age structures. In contrast, some LDCs in the Asia-Pacific region have a growing proportion of older persons but still lack robust social protection systems and adequate health-care services [19]. Also, all LDCs are projected to see a significant increase in both the number and proportion of older adults between 2023 and 2050, with an accelerated population ageing expected in the second half of the century [19]. In this context, health services must adapt effectively to population ageing, presenting significant challenges for the design and implementation of new public policies tailored to the specific needs of each country [12]. All countries must address this challenge to ensure that health and social systems are adequately prepared to support older populations and maximise the opportunities this demographic transformation presents [19,21]. Therefore, understanding the characteristics of this population is essential for improving service provision and ensuring that care is both effective and person-centred.
The Aims of the Study
This study aims to describe the characteristics of demographic ageing by analysing ageing indicators within an older population attending a primary care unit.
Material and Methods
Study Design and Settings
A descriptive, retrospective, and cross-sectional study with an analytical approach was conducted involving Mexican patients who attended outpatient consultations at the Medical Services of the “Division del Norte” Family Medicine Clinic (FMC), ISSSTE, in Mexico City, Mexico. The data was collected over a 12-month period, from January to December 2022, using a previously published database as a secondary data source [13].
Study Population, and Data Collection
We included all subjects of a previous publication, a total of 17,918 patients. The patients (from newborns to the elderly population from both sexes) attended the outpatient consultation of at least one of the next services: Family Medicine Speciality, General Medicine, the MIDE module, Nutrition, Dentistry, Family Planning, and/or Gerontology. The demographic data was collected retrospectively from medical records through the “SIMEF” system. This system captures information on all consultations provided by the medical personnel. Initially, the patients were identified using the SIMEF system. Thenceforward, a data collection sheet was employed to gather detailed information such as patient name, medical record number, date of birth, address, date of outpatient consultations and sociodemographic factors (sex and age). The working tools used included Excel files were generated monthly by the “SIMEF” system. The collected data was stored in an Excel workbook, which served as the statistical database for subsequent analysis. This procedure ensured the extracted data’s accuracy, quality, and reliability, supporting the integrity of our study’s findings. Finally, a review of the new combined database was conducted to ensure the consistency of the information.
The study included information on 15 ageing indicators to assess the demographic characteristics of the elderly population [14,18]. These were the following:
1. Sex Ratio or Masculinity Ratio: The percentage relationship between male and female population.
2. Median Age: The value obtained by ordering the population by age and identifying the middle point, representing the age at which half the population is younger and the other half is older.
3. The percentage by broad age groups. These percentages measure the relative importance of the most significant age groups within the population: children (P0–14 yr), the potentially economically active population (PEAP: P15–64 yr), and older adults (P60+ yr or P65+ yr), in relationship to the total population of the study population.
4. Ageing Index (Iag), also known as the ageing rate, this is the most commonly used method to observe the ageing process. It is simply defined as the percentage of the population aged 65 and over (P65+), or in some cases 60 and over (P60+), relative to the total population. The formula is: Iag60+ = (tP60+ / tP) × 100 or Iag65+ = (tP60+ / tP) × 100. Where tP60+ represents the total population aged 60 and over (or 65+, depending on the definition used), and tP is the total population of the study population.
5. The Old-Age Index (IO-A), which compares the population aged 60 or 65 and over to those under 15 (0-14 yr) to measure the degree of ageing. This index compares the most dynamic population groups-those that have the greatest influence on a population’s structure and evolution. The value of this index lies in measuring the number of older adults per 100 children, essentially reflecting the burden one population group places on another. The notations used to calculate the IO-A for the elderly population aged 60+ or 65+ at a given time t are as follows: IOAₜ = (tP60+ / tP0–14) × 100 and IO-Aₜ = (tP65+ / tP0–14) × 100. Where tP60+ or tP65+ represents the elderly total population and tP0–14 represents the total population of children under 15 at time t.
6. The Longevity Index (Ilong), assessing the proportion of people aged 75 or 80 and over among those aged 60 or 65 and over. This indicator aims to measure the number of people aged 85 and over per 100 people aged 65 and over. It is a specific measure of demographic ageing and helps to assess the composition of the oldest segment of the elderly population. The formula is expressed as follows: Ilongₜ = (tP85+ / tP65+) × 100. Where tP85+ represents the total population aged 85 and over, and tP65+ the total population aged 65 and over, at time t.
7. The Senility Index (SI), provides insight about the the proportion of the population aged 75 to 84 in relation to those aged 85 and over. It helps to analyse the internal age structure within the elderly population. The formula is expressed as follows: SIₜ = [(tP75–84 / tP85+) × 100. Where tP75–84 represents the total population aged 75 to 84, and tP85+ represents the total population aged 85 and over, at time t.
8. The Generational Index of the Elderly (IGeld), also known as the Generational Senility Index, the IGEld represents the number of people aged 35 to 64 (P35–64) for every person aged 65 and over (P65+). It is intended to measure the potential number of individuals within the 35–64 age range who could take care of each older person aged 65 and above. Theoretically, it links the generation of older adults with that of their children or natural caregivers, thus providing indirect information about the potential demand for care. The formula is expressed as follows: IGEldₜ = (tP35–64 / tP65+) x 100. Where tP35–64 represents the total population aged 35 to 64, and tP65+ the total population aged 65 and over, at time t.
9. The Total Dependency Ratio (TDR) measures the economic burden of dependents (aged 0–14 and 65+) on working-age population (15–64 years). It serves as an indicator of economic significance, relating the inactive or economically dependent population to the potentially active population. If the ratio exceeds 1, the active population is smaller than the non-active population. Conversely, a dependency ratio of less than 1 indicates a higher proportion of individuals aged 15 to 64 years. The formula is expressed as follows: TDRₜ = (tP0–14 + tP65+ / tP15–64) x 100. Where tP0–14 represents the total population aged 0 to 14; tP65+ is the total population aged 65 and over, and tP15–64 represents the total population aged 15 to 64, at time t. The indicator relates the number of economically dependent people per 100 economically active people.
10. The Old-Age Dependency Ratio (OADR), which focuses specifically on the burden of those aged 65+ on the working- age group; is a variant of the TDR; it represents the number of people aged 65 and over (P65+) per 100 persons with potential economic activity (15–64 yr). The formula is expressed as follows: OADRₜ = (tP65+ / tP15–64) x 100. Where tP65+ is the total population aged 65 and over, and tP15–64 represents the total population aged 15 to 64, at time t.
11. The Labour Force Structure Index (LFSI), analyses the age composition of the labour market. The population aged 15 to 64 (P15-64) is considered the foundational structure of the active workforce. This index serves as an indicator of the degree of aging within the working population. The older workforce population (P40-64) is derived from the young adult population (P15-39). If the index exceeds 1, it indicates that the structure of the working population is larger. Conversely, when the index falls below 1, it means a younger working population structure. An index value of 1 suggests a similar proportion between the oldest workforce and the youngest workforce. However, the utility of the index lies in illustrating the number of the oldest workers for every 100 young individuals in the active population. Therefore, it aims to measure the impact one sector has on the other. The formula is expressed as follows: LFSIₜ = (tP40–64 / tP15–39) x 100. Where tP40–64 is the total population aged 40 to 64, and tP15–39 represents the total population aged 15 to 39, at time t.
12. The Friz Index, a historical composite indicator analysing ageing trends represents the proportion between the population aged 0 to 19 (P0–19) about the population of 30-49 years old (P30–49), which is based on base 100, per 100 people from 30 to 49 years old, how many people from 0 to 19 there are. The formula is expressed as follows: IFrizₜ = (tP0–19 / tP30–49) x 100. Where tP0–19 is the total population aged 0 to 19, and tP30–49 represents the total population aged 30 to 49, at time t. The index suggests three values: >160, the population is considered young, 66 to 160, the population is considered mature and <60, the population is considered old.
13. The Sundbarg Index is a demographic indicator that analyses the age structure of a population by comparing the proportions of two key groups-those aged 0–14 years (P0–14) and those aged 50 and over (P50+)-in relation to the central productive age group, 15–49 years (P15–49). Based on this comparison, the index helps to determine the demographic profile of a population: whether it is progressive (young), stationary (mature), or regressive (ageing)as well. Besides, a progressive (young) population is one in which the proportion of children (0–14) exceeds that of older adults (50+), suggesting a youthful demographic. Moreover, a stationary (mature) population is one in which the proportions of children and older adults are roughly equal. A regressive (ageing) population is one in which the proportion of adults aged 50 and over exceeds that of children, indicating population ageing. The Sundbarg Index is calculated by comparing the following two ratios: Youth Ratio = (tP0–14 / tP15–49) x 100 and Elderly Ratio = (tP50+ / tP15– 49) x 100. Interpretation: If Youth Ratio > Elderly Ratio = Progressive population. If Youth Ratio ≈ Elderly Ratio = Stationary population. If Youth Ratio < Elderly Ratio = Regressive population. This index provides insight into the potential future needs of a society in terms of education, employment, and healthcare services, based on its age distribution.
14. The Burgdöfer Index is a demographic indicator used to assess the age structure of a population by comparing two specific age groups: individuals aged 5 to 14 years (P5–14) and those aged 45 to 64 years (P45–64). This comparison helps to determine whether a population is classified as young, mature, or ageing based on the relative size of these groups. On the other hand, a young population is indicated when the percentage of people aged 5–14 is greater than that of those aged 45–64. A mature population is observed when the proportions are approximately equal. Besides, a regressive or ageing population is identified when the percentage of the older group (45–64) exceeds that of the younger group (5–14). Therefore, this calculation involves determining the percentage that each of these age groups represents within the total population at a given time t: %P(5–14) = (tP5–14 / tP) x 100, and %P(45–64) = (tP45–64 / tP) x 100. Where: tP5–14 represents the total population aged 5 to 14; tP45–64 represents the total population aged 45 to 64, and tP is the total population of the study population, at time t. Interpretation: If %𝑃(5–14) > %𝑃(45–64) = Young population. If %𝑃(5–14) ≈ %𝑃(45–64) = Mature population. If %𝑃(5–14) < %𝑃(45–64) = Ageing population. Thus, this index provides a simplified but effective snapshot of demographic trends and can be a useful tool in planning for future educational and health care needs, labour market changes, and social services.
15. Finally, the Sauvy’s Ageing Index (ISauvy) is a classic ageing indicator that evaluates the demographic weight of elderly population in comparison to the youth. It is calculated by dividing the number of older adults (aged 60 and over, P60+) by the number of young people (aged 0 to 19, P0–19) and multiplying the result by 100: ISauvy𝑡 = (tP60+/ tP0–19) x 100. Where: tP60+ represents the total population aged 60 and over at time t, and tP0–19 represents the total population aged 0 to 19 at time t. Interpretation: If the resulting index exceeds 30%, the population is considered ageing or old. Therefore, this index is particularly useful for identifying shifts in the demographic structure where the number of older individuals is gaining significant weight relative to the younger cohorts, which has planning implications in areas such as education, employment, health services, and pensions.
Statistical Analysis
We included all complete records, ensuring a comprehensive dataset. The categorical variables are described as absolute frequency and percentage, and quantitative variables as mean, standard deviation (SD), and interquartile range (IQR), median, minimum and maximum value. A Confidence Interval 95% (CI95%) was included. Moreover, categorical variables were compared using Yates’ corrected chi-square (X2) test and likelihood ratio, as appropriate. Thus, quantitative variables were compared using the Mann-Whitney U test or Student’s T test as appropriate. A P value < 0.05 (two-tailed test) was considered significant.
Ethical Considerations
The study was conducted in accordance with the Good Clinical Practice Guidelines of our laws and the Declaration of Helsinki for human experiments. The protocol was approved by two committees: The Research Committee and the Ethics Committee in Research of the FMC “Division del Norte” as well. The Data was treated confidentially in order to guarantee confidentiality, where only the principal investigators had access to the complete dataset, including identifiable patient information (e.g., names). Besides, the patient names were replaced with unique identification numbers. The assigned number allows the data to be linked to a specific individual without revealing the individual’s identity. Hence, this approach ensured that all patient data were handled under ethical standards and maintained the highest level of confidentiality throughout the study. This anonymization was conducted before sharing the dataset for statistical analysis with some researchers. After the statistical analysis, only the processed statistical data were made available to the rest of the research team.
Results and Discussion
Characteristics of the Study Population
We included a total of 17.918 persons attending a primary care unit. The majority of the participants are females (n=11,288; 63% [62.3-63.7] versus males=6,630; 37% [36.3-37.7]), with a Masculinity Index of 58.74, indicating that there are approximately 59 males for every 100 females. The average age was 52.30 years old (SD=20.85, range=108, minimum age=0, maximum age=108 years old, median age=55 [IQR=40-67]) years old. The median age was higher in male patients (56.0 years old, IQR=38-68, range=104 years old, minimum age=0 years old, maximum age=104 years old) compared to female patients (55.0 years old, IQR=40-66.75, range=108 years old, minimum age=0 years old, maximum age=108 years old; p=0.005, Median Test between independent groups). However, the average age was similar for both sexes (females=52.67, SD=19.85 years vs. males=51.67, SD=22.44 years).
Table 1 provides a detailed demographic breakdown of patients attending a primary health care unit, focusing on age-based population groups relevant for the study of demographic ageing. From a public health and gerontological perspective, the data emphasize a significant presence of older adults, with 41.2% of the population aged 60 and above, and 30.5% aged 65 and above-age thresholds commonly associated with the onset of old age and increased health service needs. The data also reveal notable sex-based differences: although females make up a larger proportion of the overall sample, males represent a slightly higher proportion in the oldest age brackets (e.g., those aged 60+ and 65+). Conversely, the presence of long-lived individuals (aged 85 and over) is modest (3.5%) but relevant for planning services targeting advanced age and functional decline. On the other hand, the potentially economically active population (PEAP) (15–64 years) constitutes the majority (62.2%); however, there is a clear demographic shift towards older age groups, with 60.8% aged 50 years and older, indicating accelerated ageing within this population. In gerontological terms, we observed an increasing prevalence of sexagenarians, septuagenarians, and octogenarians, as well as an emerging presence of nonagenarians and centenarians. Regarding the main age groups, the data reveals clear trends. In the youngest group (0–9 years old), we observed the lowest percentage of the study population, with males showing a significantly higher percentage than females. A similar pattern appears in the adolescent population (10–19 years), where males again exceed females. However, in the mature adult group (20–59 years), the trend reverses: females represent a greater proportion compared to males. Overall, the number of cases increases with age, and while younger males consistently show higher percentages, mature adult females constitute the largest share, which shifts again in adults aged 60 and over, highlighting changes in gender distribution across age groups (Table 1).
In addition, the age distribution among older adults reveals statistically significant sex-based disparities. Males represent a higher proportion within the age groups of 60 years old and over, and 65 years old and over, when compared to females. This pattern may reflect sex-related differences in healthcare utilisation, life expectancy, or demographic composition within the study population, and highlights the need for sex-specific approaches in planning and delivering age-related health services. Similarly, the proportions of septuagenarians and octogenarians were significantly higher among males than females. This difference further emphasizes the importance of considering sex-specific ageing patterns in gerontological care provision. In contrast, in the PEAP, a sex-based disparity is observed, with females constituting a larger share of this group (65.4%) compared to males (56.8%), possibly indicating higher health service utilisation among working-age women or a larger female presence in the catchment population.
Demographic Ageing Indicators
The ageing rates among older adults aged 60 years old and older indicate that 41 older adult patients are attended to for every 100 individuals seen. This rate is significantly higher among males, with 43 older men attended per 100 males seen, compared to 39 older females per 100 females attended. Similarly, for individuals aged 65 years old and older, the ageing rate was 30 older adults attended per 100 individuals seen. Again, the rate was higher in men (32 older males per 100 males seen) than in females (29 older females per 100 females seen) (Table 1).
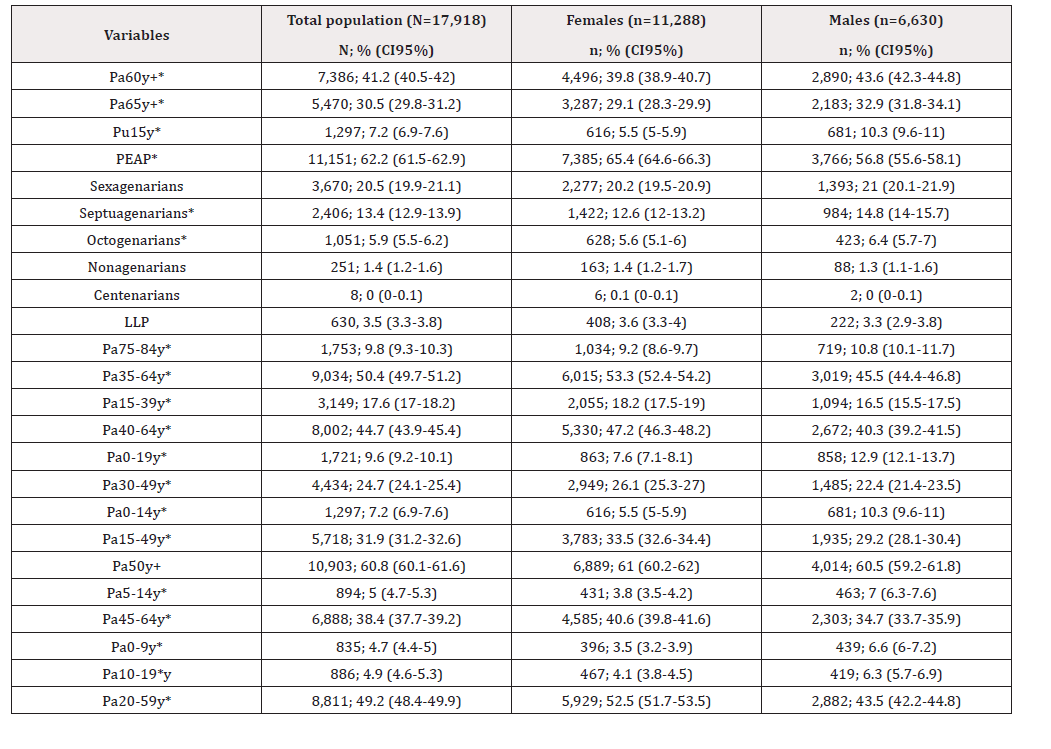
Table 1: Demographic Distribution by Age and Sex Among Primary Care Patients: Prevalence of Key Ageing Indicators.
Source*: Prepared by the authors using data from the data base. *P value <0.01, calculated by Yates correct chi square or Fisher exact test, as appropriate. Pa60y+= Population aged 60 years old and over. Pa65y+= Population aged 65 years old and over. Pu15y= Population under 15 years old. PEAP= Potentially economically active population (Population aged 15–64 years old). Sexagenarians (Population aged 60–69 years old). Septuagenarians (Population aged 70–79 years old). Octogenarians (Population aged 80–89 years). Nonagenarians (Population aged 90–99 years old). Centenarians (100 years old and over). LLP= long-lived population (Population aged 85 years old and over). Pa75-84y= Population aged 75–84 years old. Pa35-64y= Population aged 35–64 years. Pa15-39y= Population aged 15–39 years. Pa40-64y= Population aged 40–64 years old. Pa0-19y= Population aged 0–19 years old. Pa30-49y= Population aged 30–49 years old. Pa0-14y= Population aged 0–14 years old. Pa15-49y= Population aged 15–49 years old. Pa50y+= Population aged 50 years old and over. Pa5-14y= Population aged 5–14 years old. Pa45-64y= Population aged 45–64 years old. Pa0-9y= Population aged 0–9 years old. Pa10-19y= Population aged 10–19 years old. Pa20-59y= Population aged 20–59 years old.
Table 2 presents key demographic indicators related to population ageing, disaggregated by total population, females, and males. The data reveal a population with a high ageing burden and structural dependency. The Old-Age Index for adults aged 60 and older is 569.47, indicating that for every 100 individuals attending under the age of 15, there are approximately 569 individuals aged 60 and over attending. Thus, this reflects a significantly aged population structure. When disaggregated by sex, the index is markedly higher among females compared to males (Table 2). This suggests that females not only live longer but also represent a substantially larger proportion of the elderly population. Similarly, the Old-Age Index for adults aged 65 and older is 421.74 overall, indicating approximately 422 individuals aged 65 and over for every 100 individuals under 15 years old. Once again, this index is higher among females than among males. Therefore, the Longevity Index for the total sample is 11.52, indicating that for every 100 individuals aged 65 and over, there are approximately 11.5 individuals aged 85 and over. Besides, when disaggregated by sex, the index is higher among females compared to males. This pattern aligns with known demographic trends in which females tend to experience greater longevity than males.
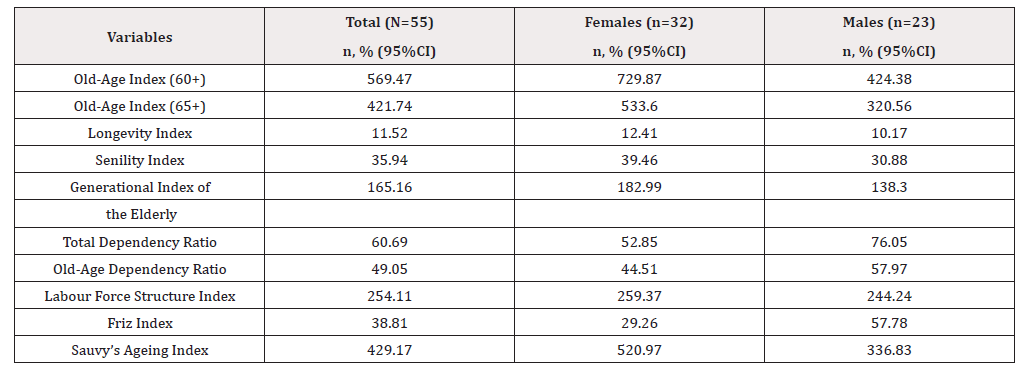
Table 2: Demographic Ageing Indicators.
Source*:Prepared by the authors using data from the data base.
The Senility Index for the total population is 35.94, indicating that there are approximately 36 individuals aged 85 and over for every 100 individuals aged 75 to 84. In contrast, when disaggregated by sex, the index is higher among females than males. This difference reflects a greater proportion of women surviving into more advanced ages, reinforcing previous findings from the Longevity Index. The higher senility index among females may be attributed to longer life expectancy and lower age-specific mortality rates, particularly in the older age brackets. Besides, the Generational Index of the Elderly for the total population is 165.16, indicating that there are approximately 165 individuals aged 35 to 64 for every 100 individuals aged 65 and over. Additionally, when broken down by sex, again, the index is higher among females compared to males. The Total Dependency Ratio is 60.69 for the total population, indicating that there are approximately 61 dependents (children aged 0–14 and adults aged 65 and over) for every 100 individuals of working age (15–64 years old). Thus, this ratio is lower among females and considerably higher among males. The elevated male ratio may suggest a heavier burden on the working-age male population to respect the support dependent persons (young and older). The Old-Age Dependency Ratio stands at 49.05 overall, meaning that there are about 49 individuals aged 65 and over for every 100 working-age adults (age 15 to 64 years). Again, the ratio is lower in females and higher in males. This difference aligns with the demographic structure where males may have a higher proportion of elderly relative to their working-age peers, potentially placing more pressure on social and healthcare systems targeted at elderly male populations. On the other hand, the Labour Force Structure Index was 254.11 for the total population, which indicates a robust presence of working-age older individuals relative to the population working-age younger subjects. The index is slightly higher among females than males, suggesting a slightly more favourable balance between economically active. Moreover, the Friz Index is 38.81 overall, showing notable variation by sex, with a significantly higher value for males. These values indicate that our study population is elderly. Moreover, the elevated male value suggests a more pronounced ageing pattern in this population. The Sauvy’s Ageing Index is notably high at 429.17, meaning there are more than four times as many individuals aged 50 and over compared to those aged 0–14. Hence, this indicates a highly aged population overall. The index is substantially higher among females compared to males, which is consistent with the well-established pattern of greater female longevity and lower fertility rates. Thus, this result highlights the pressing need for policies tailored to an ageing female population, including long-term care, economic support, and healthcare services (Tables 2).
Finally, Table 3 presents two demographic ageing indicators - the Sundbarg Index and the Burgdofer Index - for the total population and by sex (female and male).
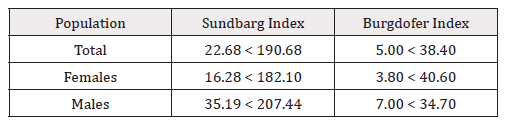
Table 3:Demographic Ageing Indicators
Our findings reveal a clear demographic shift towards population ageing, characterised by notable gender disparities. Males exhibit a more pronounced ageing pattern across both indices, suggesting a more rapid transformation in population structure (Table 3). In contrast, although females demonstrate greater longevity-as reflected in other indicators-they experience comparatively lower ageing pressure. These results underscore the growing concentration of elderly individuals within the population and highlight the urgent need for age-responsive strategies in healthcare, pension systems, and community-based support. Such interventions must be sensitive to the distinct ageing trajectories observed in males and females.
Discussion
The population ageing refers to the growing number and proportion of individuals aged 60 years old and above, accompanied by a simultaneous decline in the number and share of the population aged 15 years and under [9]. While this demographic shift initially emerged in developed countries, it has increasingly become a defining feature in many developing nations as well, marking a global trend with significant social and economic implications [9,12]. Therefore, in our study, the demographic profile reveals an ageing population structure, with a significant proportion aged 50 and above (60.8%), and a relatively low percentage of children and adolescents (7.2% under 15 years old and 9.6% under 20 years old). This age imbalance suggests potential socio-economic challenges, such as increased healthcare demands, pensions, and dependency ratios, alongside a shrinking younger workforce. The working-age population (15–64 years) still forms the majority, but the growing elderly segment, particularly the sexagenarians and septuagenarians, may indicate a transition toward a predominantly ageing society. Thus, these dynamics call for urgent public health policies to support healthy ageing, promote active lifestyles in older adults, and possibly incentivise youth and family development to restore generational balance. On the other hand, the Old-Age Index for adults aged 60 and over, as well as those aged 65 and over, was elevated. Besides, these values highlight a pronounced ageing population, particularly among women, and suggest a demographic inversion in which the number of older adults greatly exceeds the number of children. This scenario has significant implications for public health systems, pension schemes, and long-term care infrastructure, necessitating urgent planning and resource allocation to support an ageing society.
Such demographic shifts highlight the necessity of establishing age- friendly health systems and community- focused interventions to promote healthy ageing, functional independence, and caregiver support [2,6]. On the other hand, the relatively lower proportion of children and adolescents, particularly among females, may indicate declining fertility or selective use of services. This age structure directly impacts resource allocation, long- term care planning, and the formulation of comprehensive strategies that address the complex needs of an ageing population within the primary care framework. Moreover, ageing extends beyond biological changes to encompass significant social, economic, and environmental dimensions [10,21]. Therefore, to tackle these numerous challenges, the World Health Organisation (WHO) developed a programme to foster age- friendly cities and communities (AFCC), specifically designed to support the health, well- being, and inclusion of the elderly population [16]. However, limited evidence exists for addressing health and social needs through the AFCC framework [6]. According to Hong, et al. (2023), a review report indicates that many successful interventions based on this focus employed a partnership model and behavioural change theories to inform program design and implementation. The results also highlighted that social participation and engagement played a key role in the success of these interventions. Nonetheless, the findings revealed that the literature is dominated by person- focused approaches. Besides, a future research should concentrate more on evaluating environment- focused interventions and developing a holistic framework that integrates both person- and environment- based approaches to healthy ageing (age- friendly health services). Crucially, characterizing the indicators of ageing is essential-not only to understand the ageing experience itself but also to inform evidence- based policymaking across various sectors. Additionally, these indicators are vital for analysing the interplay between ageing and the social determinants of health, shaping responsive public policies, adjusting social security systems, and guiding the development of resilient socio- economic infrastructure [3,7,12]. Such insights are fundamental to fostering inclusive environments and building age- friendly cities and health services, enhancing social participation, and ensuring accessible urban design (li & Woolrych 2021) as well. This dual focus is critical for advancing equitable, sustainable, and inclusive strategies that support ageing populations in diverse settings. Nevertheless, the current literature remains heavily weighted towards person- focused approaches [6]. The observed sex-based differences highlight the significance of gender-sensitive approaches in ageing policy, as older women may have distinct and often greater healthcare and social support needs compared to their male counterparts as well. On the other hand, the higher Longevity Index in females suggests a more advanced ageing process within the female elderly population, with a larger proportion surviving into older old age. This has implications for healthcare planning and social support services, as the oldest age groups often require more complex and prolonged care. However, these findings further highlight the importance of tailoring interventions and support systems to address the specific needs of older women, who may be more likely to live alone, have limited income, and suffer from chronic conditions or disability in later life.
In a social services affiliate population, an important dynamic to consider is that a significant proportion of older adults serve as primary caregivers for other elderly individuals, often within their own households [4,11,15,17,20]. This dual role presents a unique public health challenge, as both the caregiver and the care recipient frequently live with existing chronic conditions that require ongoing medical attention and support. This situation underscores the interconnected vulnerabilities within ageing households and the need for integrated care models that consider not only the health of the older patient but also the wellbeing of the older caregiver. Conversely, health and social systems must be equipped to address these overlapping needs, offering both medical care and respite or support services tailored to this demographic reality. On the other hand, the Senility Index highlights the need for differentiated care strategies, especially for older females, who may face a higher prevalence of disability, cognitive decline, and social isolation. Moreover, in the context of the social services affiliate population, where many older adults are also primary caregivers, this further complicates care needs and underscores the importance of age- and gender- sensitive healthcare planning. In addition, the Generational Index of the Elderly suggests that within the female population, there is a larger potential support base in the middle-aged group relative to the elderly, compared to their male counterparts. Thus, this ratio is a key indicator for evaluating intergenerational support capacity, particularly relevant in the context of informal caregiving and dependency dynamics in ageing populations.
Limitations and Applications
This cross-sectional study aims to describe the characteristics of demographic ageing by analysing ageing indicators within an older population attending a primary care unit. While the study provides a valuable snapshot of ageing patterns in this specific setting, certain limitations must be considered. Firstly, as a cross-sectional design, the study captures data at a single point in time, which limits the ability to establish causality or assess changes over time. Additionally, longitudinal studies would be required to better understand the dynamics and progression of ageing indicators. Secondly, the findings are specific to the population served by one primary care unit, which may not be representative of the broader older population in other regions or healthcare settings. This restricts the generalisability of the results.
Despite these constraints, the findings may be transferable to similar contexts in other countries with comparable social security systems. While the specific demographic and institutional characteristics may vary, the ageing indicators analysed-and their implications for primary care and service planning-are relevant to settings where older adults access healthcare through public or social insurance schemes. As such, the results can inform broader discussions on health system responsiveness to demographic ageing in countries with structured social protection frameworks. Moreover, the study has meaningful applications. By characterising key ageing indicators, the study provides essential information for the planning and delivery of age-responsive primary care services. The findings can support decision-making in areas such as resource allocation, early identification of at-risk groups, and the development of integrated care strategies tailored to the needs of older adults as well. Furthermore, the study contributes to the evidence base required to inform public policies, improve social security systems, and guide the creation of age-friendly environments in line with the WHO framework. Thus, iIt reinforces the importance of routinely monitoring ageing indicators within primary care to better address the complex health and social challenges posed by demographic ageing.
Conclusion
Our findings underscore the urgent need to adapt primary healthcare services to an ageing population. The analysis of ageing indicators reveals a significant proportion of older adults attending this first-level care clinic, highlighting the demographic transition underway. Thus, these patterns reflect a growing demand for age-friendly services that are not only medically responsive but also socially and administratively inclusive. In order to effectively address the needs of this population, it is essential to implement a comprehensive care model tailored to older adults. Moreover, the high utilisation of services by older adults calls for a strategic redesign of healthcare delivery, ensuring accessibility, continuity, and quality of care. Hence, strengthening these systems will not only improve health outcomes for older individuals but also promote active and dignified ageing within the community as well. Therefore, this includes reorienting services to meet their specific requirements.
Acknowledgements
The authors would like to thank Professor Susana Ortiz Vela, Master in translation, and also express their gratitude to the Centro de Investigacion y de Educacion Continua S.C. for their support in translation.
Competing Interests
“Authors have declared that no competing interests exist.”.
Author’ S Contributions
All authors contributed to conceptualization (ideas, formulation, or development of research goals and objectives), formal analysis (application of statistical, mathematical, computational, or other formal techniques to analyse or synthesize study data), writing - original draft (preparation, creation, and/or presentation of the published work, specifically writing the initial draft), writing - review and editing (preparation, creation, and/or presentation of the published work by the research group, specifically critical review, commentary, or revisions, including pre- or post-publication stages), and visualization (preparation, creation, and/or presentation of the published work, specifically data visualization/presentation).
Lopez Hernández Daniel, in addition to the above, contributed to project administration (responsibility for managing and coordinating the planning and execution of the research activity), investigation (development of a research process, specifically experiments or data collection/testing), methodology (development or design of methodology, creation of models), supervision (responsibility for supervision and leadership in the planning and execution of the research activity, including external mentoring), and validation (verification, whether as part of the activity or separately, of the overall replicability/reproducibility of the results/experiments and other research outcomes).
Disclaimer
Authors hereby declare that NO generative AI technologies such as Large Language Models (ChatGPT, COPILOT, etc) and textto- image generators have been used during writing or editing of manuscripts.
Consent
A medical professional informed all participants about the study’s objective, its benefits, and potential adverse events. After providing a clear explanation, the collection of the signatures of those who voluntarily decided to participate in the study, ensuring that participants had sufficient time to read and sign the corresponding informed consent form.
Ethical Approval
The protocol was approved by two committees: The Research Committee and the Ethics Committee in Research of the FMC “Division del Norte”, ISSSTE. The Data was treated confidentially.
References
- A Khan HT, Addo K M, Findlay H (2024) Public Health Challenges and Responses to the Growing Ageing Populations. Public Health Challenges 3(3): e213.
- Biasi AD, Wolfe M, Carmody J, Fulmer T, Auerbach J (2020). Creating an Age-Friendly Public Health System. Innovation in Aging 4(1):
- Campos Tapia AP, Meda Lara RM, Corona Figueroa BA (2022) Characterization of the social determinants of health in active aging in studies focused on quality of life: systematic mapping studies focused on quality of life: systematic Ciencia UAT 17(1): 17-34.
- Committee on Family Caregiving for Older Adults; Board on Health Care Services; Health and Medicine Division; National Academies of Sciences, Engineering, and Medicine; Schulz R, Eden J, editors. Families Caring for an Aging America. Washington (DC): National Academies Press (US); 2016 Nov 8. 2, Older Adults Who Need Caregiving and the Family Caregivers Who Help Them.
- European Union (2024) 2024 Ageing Report. Economic and budgetary projections for the EU Member States (2022-2070).
- Hong A, Welch Stockton J, Kim JY, Canham SL, Greer V, et al. (2023) Age-Friendly Community Interventions for Health and Social Outcomes: A Scoping Review. International Journal of Environmental Research and Public Health 20(3): 2554.
- Hua K, Pan Y, Fang J, Wu H, Hua Y (2024) Integrating social, climate and environmental changes to confront accelerating global aging. BMC Public Health 24(1): 2838.
- Institute of Medicine (US) (2012) Committee on the Long-Run Macroeconomic. Effects of the Aging U.S. Population. Aging and the Macroeconomy: Long-Term Implications of an Older Population. Washington (DC): National Academies Press (US), Demographic Trends.
- Ismail Z, Ahmad WIW, Hamjah SH, Astina IK (2021) The Impact of Population Ageing: A Review. Iranian journal of public health 50(12): 2451–2460.
- Gaviano L, Pili R, Petretto AD, Berti R, Carrogu GP, et al. (2024) Definitions of Ageing According to the Perspective of the Psychology of Ageing: A Scoping Review. Geriatrics 9(5): 107.
- Lin Z (2024) Diversity and Dynamics in Care Networks of Older Americans. Socius.
- López Hernández D, Orozco Campos N, Sam ILRPCY, Blanco Cornejo M (2019) Need for public health policies in the elderly population: indicators of aging in a Social Security Institute in Mexico. Gaceta medica de Mexico 155(Suppl 1): S10–S15.
- Lopez Hernandez D, Brito Aranda L, Flores Morales GJ, Ham Olvera MC, Beltran Lagunes L (2024) Health Status and Demographic Characteristics of Patients Attending a Primary Care Unit in Mexico City: A Descriptive Study. Current Journal of Applied Science and Technology 43(12): 12-26.
- Mancera J, Muñoz F, Martín M, Paniagua F, Fernández C (2001) Usefulness of demographic analysis of an urban basic health area for health care. SEMERGEN 27(6): 286-290.
- National Association of Social Workers (2010) NASW Standards for Social Work Practice with Family Caregivers of Older Adults.
- Pan American Health Age-friendly cities and communities.
- Sánchez Bárcenas RA, López Hernández D, Brito Aranda L, García Mantilla BB, Bonilla R T, et al. (2024) Factors associated with caregiver overload in primary caregivers of older adults with type 2 diabetes. Primary Care 56(10): 102948.
- Torres Degró A (2010) Demographic aging: An approach to quantitative methods. CIDE digital 1(2): 79-102.
- United Nations. Department of Economic and Social Affairs, Population Division (2023). World Population Ageing 2023: Challenges and opportunities of population ageing in the least developed countries.
- Pérez Bruno VA, López Hernández D, Sánchez Escobar LE, Munguía Lozano S, Beltrán Lagunes L (2019) Prevalence of "caregiver overload" in primary caregivers of adult patients over 60 years of age with chronic non-communicable diseases. Rev Esp Méd Quir 24(1): 193-202.
- World Health Organization (2024) Ageing and health: key facts.




 We use cookies to ensure you get the best experience on our website.