
Review Article 
 Creative Commons, CC-BY
How to Measure and Evaluate Water Availability in a Region Based on the Natural Water Cycle
*Corresponding author: Jorge Garza Ulloa, Research Consulting Services, University of Texas El Paso, USA.
Received:May 16, 2025; Published:May 23, 2025
DOI: 10.34297/AJBSR.2025.27.003531
Abstract
Today water scarcity is a worldwide problem, in this paper an easy-to-follow mathematical model is introduced to measure the water scarcity in regions, city, states or country. It is based on the calculation of the natural water cycle through year in the same region analyzing the average surface temperature on it. Explaining with an example of water scarcity analyzing the State of Texas, USA and the City of El Paso Texas, USA. The conclusions point to the fact that our economic activities are affecting our availability of water, and this phenomenon has been accelerating in recent years, so we must implement public policies that stop this trend and, if possible, reverse it. The interesting thing about this is that we can measure the results of these policies, which I think could not be done before.
Introduction to Shortening the Natural Altered Water Cycle by Global Warming to Evaluate and Measure Water Availability Status
Imagine a methodology to represent and measure the “Natural Water General Cycle” [1] in your region, city, state, or country (Figure 1).
As we know, the natural water cycle has a circular behavior:
i. From water storage to gas by evapotranspiration
ii. Then the vapor water storage in clouds is back to liquid or solid
on the surface,
iii. And then a liquid water storage to underground storage
iv. This cycle repeats forever
This means the total amount of water in the world is the same, so the big question is, where is the water that we need?
A methodology to represent and measure the “Natural Water General Cycle” could be very useful to compare the time slots of the water cycle. As shown on the left side of Figure 1, we can observe:
i. The normal general water cycle in the range of years 1850- 1900 could be represented and used as a reference, as indicated in the figure by a circle of green colour. ii. The altered nature of the general cycle in the range of years 1950-2000 is represented as a bigger circle in Figure 1 using blue colour. iii. The extreme nature of the alteration in the general range of years 2000-2050 is represented as a bigger circle in Figure 1 in red colour.
We could deduct using “Water Cycle” representation shown in Figure 1 that the “Natural altered water cycles” as a circle to facilitate their behaviors analysis that will indicates an increase effect on the “natural water cycle” size in time by the effect of “global warming” [2] as explain in the right side of Figure 1. This representation could help to understand and explain why actually:
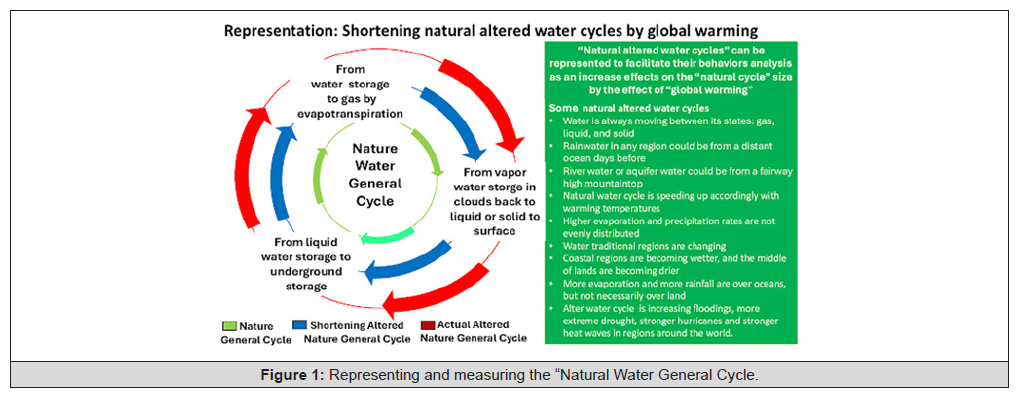
Figure 1:Representing and measuring the “Natural Water General Cycle.
i. Rainwater in any region could be from a distant ocean days
before
ii. River water or aquifer water could be from a fairway high
mountaintop [3]
iii. The natural water cycle is speeding up accordingly with warming
temperatures [4]
iv. Higher evaporation and precipitation rates are not evenly distributed,
v. Traditional water regions are changing
vi. Coastal regions are becoming wetter, and the middle of the
land is becoming drier [5]
vii. More evaporation and more rainfall are over oceans, but not
necessarily over land
viii. Alter water cycle is increasing floodings [6], more extreme
drought, stronger hurricanes and stronger heat waves in regions
around the world [7].
The “natural water cycles” as shown in left side of Figure 1 can be represented using a water parameter that represents many factors involved in it, the value of the radius of a circle represents the alteration, and the larger circle is the altered water cycle has the goal to facilitate the analysis of many behaviors involved.
Remarks: The conclusion for the introduction for representing and measuring the “Natural Water General Cycle” as indicated in Figure 1 are:
i. when the “natural general water cycle” value increases accordingly
by the rise of “global warming effects [8].”
ii. The actual “extreme altered nature general cycle” is shown in
red colour, and when some correction methods are applied,
the radius of the circle decreases “the altered nature general
cycle” shown using blue colour compared with the normal “nature
general water cycle that is in green colour.
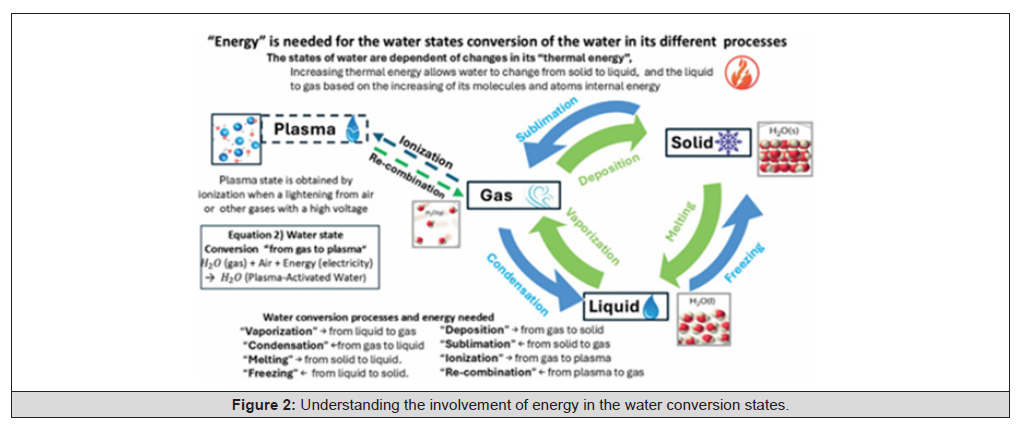
Figure 2:Understanding the involvement of energy in the water conversion states.
All states including the fourth state known as “plasma” can be
summarized with energy direction as follow [13-15]:
i. Vaporization → from liquid to gas.
ii. Condensation ⃪ from gas to liquid.
iii. Melting → from solid to liquid.
iv. Freezing ⃪ from liquid to solid.
v. Deposition → from gas to solid.
vi. Sublimation ⃪ from solid to gas.
vii. Ionization → from gas to plasma.
viii. Re-combination ⃪ from plasma to gas.
Remark: Plasma-activated water showers have a temporary cleansing effect, and the water that remains contains a higher content of bound nitrogen. This is nature’s way of providing nutrition for plants and trees [16].
How to Select the Water Parameter that We Can Use to Evaluate the Altered Natural Water General Cycle
The criteria used to assess the current water situation must be grounded in actual water-related facts and consequences. The purpose is to identify which of them are more significant to be used in the evaluation of the altered natural water general cycle that helps to measure indirectly the water scarcity [17]. The main water facts are:
i. There are 2.5 billion people worldwide depending on groundwater
ii. There are 276 transboundary basins that are shared by 148
countries that account for approximately 60% of the global
freshwater flow, and
iii. There are 300 aquifer systems that are transboundary in nature.
Some of the most useful parameters to evaluate the altered natural water general cycle are water scarcity, precipitation, Earth’s average global surface temperature, and many other indirect parameters to evaluate the natural water cycle with specific purposes.
Water quality measures the suitability of water based on physical, chemical, and biological parameters for a particular use under standard types: potable water, safe to drink; palatable water, the presence of chemicals, not a threat to human health; contaminated water, unfit for drinking or domestic use; and infected water, contaminated with pathogenic organisms [18].
Remark: The most frequent parameters for water quality are physical, chemical, and biological. Physical water characteristics include temperature, turbidity, electrical conductivity, salinity, total dissolved solids, colour, taste, odor, and chemical-biological characteristics. Chemical water characteristics include pH, acidity, alkalinity, hardness, chlorine, and dissolved oxygen chemicals. Biological water characteristics include biological oxygen demand and pollutant presence.
Earth’s global average surface temperature is calculated by the weighted average of the temperature of Earth’s surface over the land and ocean. The temperature values are measured at the surface air and at the sea surface over the ocean. The analysis of recorded data [19] for the Earth’s global surface temperature indicates the following:
i. It has risen by an average of 0.11°Fahrenheit (0.06°Celsius)
per decade since 1850, or about 2°F in total.
ii. The rate of warming since 1982 is more than three times faster:
0.36°F (0.20° C) per decade.
iii. The 10 warmest years in the historical record have all occurred
in the past decade (2014–2023).
iv. The warmest year until now has been the year 2024
Remark: The actual way of measuring global warming by fractions of a degree seems to be small but compared with the massive heat energy for raising the temperature of the ocean and land, it is very significant for nature [20]. It causes temperature extremes, reduced snow cover and sea ice, and intensifying heavy rainfall and results in the alteration of all habitats on Earth, affecting human life, vegetation, and animals.
Water scarcity is measured by two different types: physical water scarcity, when there is not enough water for the demand needed, and social water scarcity, when water infrastructure usually fails to meet the demand when the demand increases due to global warming. The measurement of water scarcity and water quality is frequently made by remote sensors, drones sensing temperature, and satellite imagery. These are described as follows:
i. Remote sensors are used to measure water quality with parameters
such as pollution, turbidity, and chlorophyll levels.
ii. Sensors used in drones take high-resolution images of water
sources to assess the impact on water resources [21]
iii. Satellite imagery allows real-time data by monitoring water
resources per region and applying spatial analysis to the geospatial
data to detect regions with severe water scarcity.
Remark: Water scarcity increases the need to focus on the sustainability of groundwater resources, which include the water beneath the surface trapped in sediments and rock.
Precipitation is the main way for atmospheric water to return to Earth from clouds in different forms, such as rain, freezing rain, sleet, snow, or hail. It is usually measured in inches or millimeters over a specific time period [22,23]. The precipitation measurement methods that are more common are traditional physical measurement devices, ground-based weather radar, and satellite-based radiometers. Where:
i. Traditional physical measurement devices are used in situ, including nonrecording cylinder container gauges, recording weighing, float gauge, and others. Gauges perform direct measurements of precipitation, constituting the only device providing independent quantitative data, but gauges only provide point measurements; thus, the representativeness regarding the capture of extreme rainfall is limited.
ii. Ground-based weather radar scans for echoes by electromagnetic waves for specific atmospheric volumes for precipitation particles in continuous real-time monitoring. Radar-based precipitation retrievals use the interaction of airborne hydrometeors with the emitted electromagnetic wave of the measurement device.
iii. Satellite-based radiometers are from two categories: geostationary Earth-orbiting satellites that monitor the same limited region of the Earth at a high frequency and low Earth-orbiting satellites that provide global information, in the case of polar-orbiting satellites, or at least up to a maximum latitude, although they give only temporal snapshots at each location.
Remark: Weather radars, in combination with gauge data, provide high-quality precipitation data with blanket coverage. Satellite- based measurements help provide a global view of precipitation and precipitation monitoring, especially in areas without ground-based radar coverage, such as oceans.
How to Evaluate the Natural Altered Water Cycle by Global Warming
As explained in the last section, the most recommendable initial parameter to evaluate the “natural altered water cycle by global warming is the Global Average Surface Temperature (GAST)”, which includes land and marine environments. Unfortunately, the planet’s average temperature is on a continuous rise due to global warming, but all the values throughout the years are well documented on the website climate.gov as Climate Change: Global Temperature | NOAA Climate.gov [24,25]. Where they plotted the difference of GAST per year from the reference value before industrial years as shown in Figure 3B, which was approximately 59°F (15°C).
To evaluate the Altered Natural Water General Cycle for any Decade represented as ANWGC(D), we are using the absolute value (ABS) ratio between the difference between the Global Average Surface Temperature for Decade represented as GASTD(REF) minus the decade used as reference divided by GASTD(REF), where REF is the decade of reference as shown at equation 1) (Figure 3).
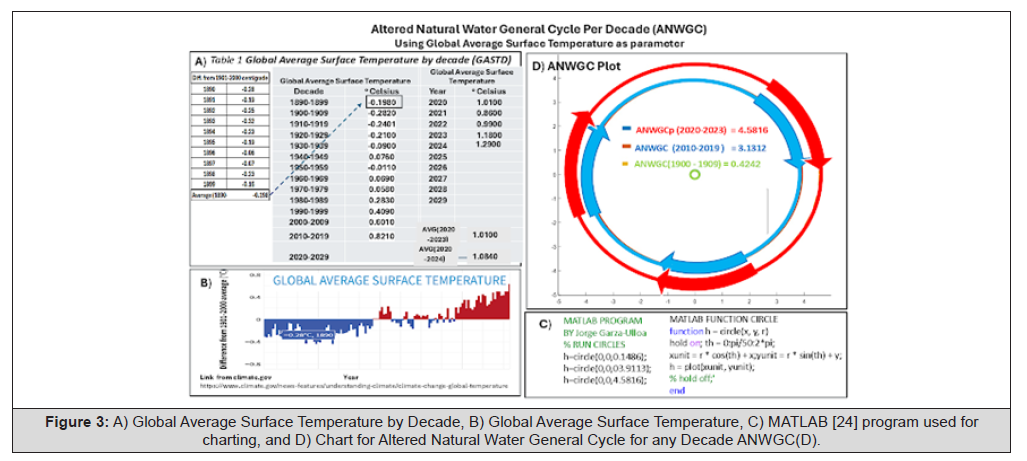
Figure 3:A) Global Average Surface Temperature by Decade, B) Global Average Surface Temperature, C) MATLAB [24] program used for charting, and D) Chart for Altered Natural Water General Cycle for any Decade ANWGC(D).
Eq 1) ANWGC(D)=ABS ((GASTD(ToEvaluate) - GASTD(REF)) / GASTD(REF))
*Remark: ABS is the value without regard to its sign.
The tabulation for the Global Average Surface Temperature (GAST) is tabulated at Figure 3A obtaining the decade average as the first table on the right side.
i. GASTD from decades beginning at 1890-1899 to 2020-2029,
ii. REF is the decade used as reference, calculated as the average
from 1890 -1 899= -0.1980.
iii. ANWGC (1900 - 1909) = 0.4242, shown in green colour at Figure
3D
iv. ANWGC (2000 - 2009) = 3.1312, shown in blue colour at Figure
3D
v. ANWGC (2010 - 2019) = 3.9113, not shown at Figure 3D
vi. ANWGC (2020 - 2023) = 4.5816, shown in red colour at Figure
3D
vii. ANWGC (2020 - 2024) = 4.8439, not shown in at Figure 3D
The ratio of increase in global temperature in the 20th century, can be obtained dividing the values for the:
decade (2000-2009)/ decade (1900 - 1909) =3.1312/0.4242=7.38.
This result indicates 7.38: “Altered natural water general cycle” increased more than 7 times in 100 years! Meaning the ratio of increase on global temperature from the first decade of the 21thcentury (2000 - 2009) with respect to the first decade of 20thcentury (1900 - 1909) is 7.38 times in 100 years. In similar way; the ratio of increase in global temperature in the 20thcentury + 20 years, can be obtained dividing the values for the decade (2010-2019)/ decade (1900 - 1909) =3.9113/0.4242=9.22.
This result 9.22 indicates the “Altered natural water general cycle” increased more than 9 times in 100 years! Meaning the ratio of increase on global temperature from the second decade of the XX century (2010 - 2019) with respect to the first decade of 20thcentury (1900 - 1909) is 9.22 times in 110 years. This indicated an increase of 9.22-7.38=1.84. To calculate the present decade, the ratio of increase in global temperature in the 20thcentury + (2000- 2024) years, can be obtained dividing the values for the decade (2020-2024)/ decade (1900 - 1909) =4.8439/0.4242=11.42. This result 11.42 indicates the “Altered natural water general cycle” increased is more almost 11 times in 123 years!. Meaning the ratio of increase on global temperature from the actual partial decade (2020 - 2024) with respect to the first decade of 20thcentury (1900 - 1909) is 11.42 times in 125 years. This indicated an increase of 11.42-9.22=2.2.
Remarks:
“Ratio global warming increase per decade” values show a very clear trendline of increase for accelerated global warming
The difference in increment in ratio increased of 10 years was 1.84, and the difference in the last 5 years was 2.2 these mean global warming has now grown in exponential ratio of increase!
The Natural Altered Water Cycle by Global Warming Is Represented by a Circle Applying a Mathematical Process to the Global Average Surface Temperature or ANWGC.
(Figure 4) As shown in Figure 4A) the natural altered water cycle by global warming is represented by circles representing different ANWG, they are evaluated by decades or partially evaluated ANWGC (1900 - 1909) = 0.4242 in light blue colour, ANWGC (2010- 2019) = 3.1312 in red colour, ANWGCp (2020-2023) = 4.5816 in green colour, and ANWGCp (2020-2024) = 4.8439 purpled colour.
As shown in Figure 4B) the ANWGC values obtained agreed with the Celeste Saulo from World Meteorological Organization: “climate history is playing out before our eyes. We’ve had not just one or two record-breaking years, but a full ten-years series”.
As shown in Figure 4C) the ANWGC values also show that 2024 was the warmest year on record and first above 1.5 degrees centigrade.
As shown in Figure 4D) The Altered natural water cycle by global warming calculated by rate of increase of global average surface temperature are: 7.38 in100 years at decade (1900-1909), 9.22 in 120 years at decade (2010-2019), 9.22 in 120 years at decade (2010-2019) and 11.42 in125 years decade (2020-2024). These results mean global warming has now grown in an exponential ratio of increase!.
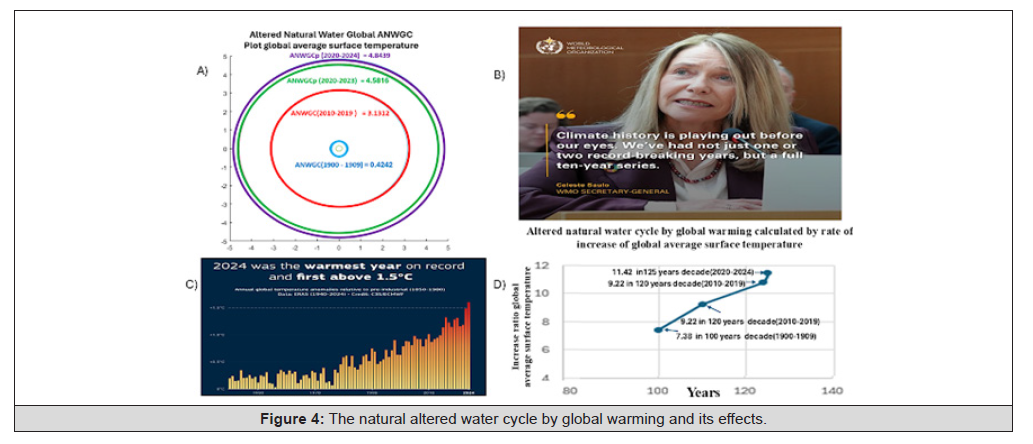
Figure 4:The natural altered water cycle by global warming and its effects.
How to Integrate the Altered Natural Water General Cycle of into Circular Economy
As explained in the previous sections, methods to measure the natural altered water cycle by global warming are based on Global Average Surface Temperature (GAST) as a parameter. In this section, it is explained how to apply the method GAST for specific regions that allow keeping track of specific parts of the country, states under the scope of landscape regions. Where the evaluation for the “altered natural water general cycle” is made for a specific region’s water cycle, allowing easy measurement to detect changes through time, and the goal is to optimize an ecosystem with real measuring values as feedback, to apply solutions with precise control over its evolution to “shorten the natural altered water cycle by global warming.”
The evaluation of the concept “water cycle by region” must be based on a well-defined landscape type and be represented by its specific regional natural water cycle to detect the variations in the altered natural water cycle on pre-determined time ranges, i.e. by years, decades and others.
The analysis for using the natural altered water cycle by global warming by region must follow the next 5 rules:
i. Rule#1: Its representation must be in a natural, logical way, allowing us to do continuous evaluations based on historic readings of stable values for that specific region to be compared to actual reading values in the same region.
ii. Rule#2: Its evaluation must allow pondering each method and technique applied for shortening the natural altered water cycle and detecting the values for water scarcity available in that region for an adequate time period.
iii. Rule#3: It must be evaluated using appropriate methods and techniques to help restore nature’s general cycle. Restoration must be based on preference, “replicating nature’s general water cycle by region, but in some special cases, artificially based on human design, to help resolve the water scarcity problem faster.
iv. Rule#4: It is necessary to apply specific landscape types and each technique as shown at the bottom of Figure 5.
v. Rule#5: It must be integrated into the circular economy concept to be evaluated by “shortening natural altered water cycles” in their different steps as shown at the top of Figure 5.
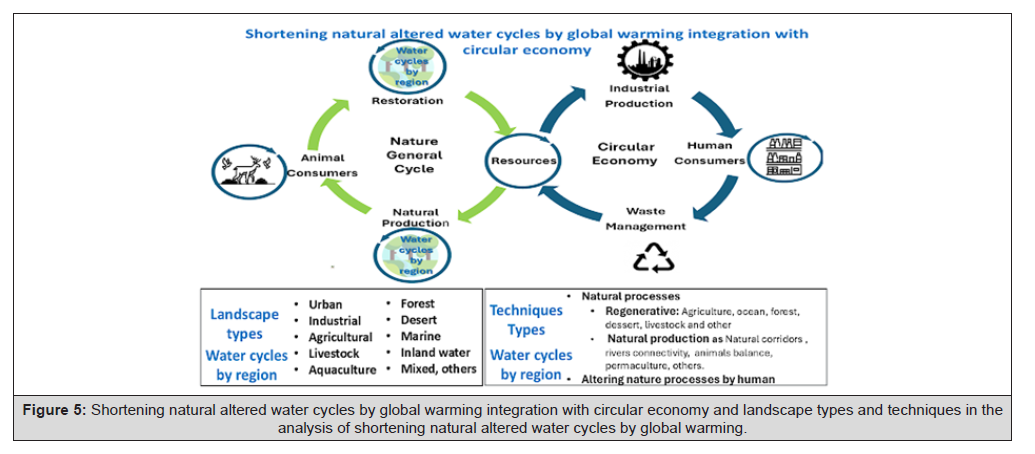
Figure 5:Shortening natural altered water cycles by global warming integration with circular economy and landscape types and techniques in the analysis of shortening natural altered water cycles by global warming.
The landscape types for the analysis of shortening natural altered water cycles by global warming HEAT are
i. Urban as an outdoor environment influenced by urban features,
including natural & man-made
ii. Industrial external as an environment of industrial plants or
industrial parks
iii. Agricultural land as land for farming purposes.
iv. Livestock is defined as interfaces between human activities
and landscape ecology.
v. Aquaculture as designs of interactions as symbiotic relationships
based on fish cultivation, recreation, conservation, and
waste recycling.
vi. Forest is an ecosystem that is a region of a dense community of
trees, an ensemble of plants, and animals.
vii. Desert region where vegetation is sparse, precipitation is
scarce, and soil is dry [26]
viii. Marines as a marine natural landscape.
ix. Inland water, including lakes, rivers, and streams.
x. Mixed, i.e., agricultural and livestock
xi. Other types
The technique types as shown at the bottom of fig. 5 for the analysis of shortening natural altered water cycles by global warming are natural processes, natural production and altering nature processes by humans.
Natural processes
i. By regeneration processes such as regenerative agriculture,
regenerative ocean, forest regeneration, desert regeneration,
livestock regeneration, and others
Natural production
ii. Natural corridors, river’s connectivity, animal balance, permaculture,
and others
Altering nature processes by humans
iii. Sea water desalinization, water from air, avoiding water evaporation,
floating gardens, and others
Remarks: “Shortening natural altered water cycles by global warming integration with circular economy”. One important response to human overactivity and global warming has been directed to the implementation of the concept of “circular economy”, and it is recommendable to connect to the “natural circular cycle by region”. To help the circular economy with evaluation and measuring of water parameters, applied for changed “natural production”, and “restoration” that are connected to the “circular economy” by resources for “production”, “consumption”, “waste management” to be re-connected back to the “nature general cycle,” as shown in fig. of section 5 (Figure 5).
How to Evaluate Natural Altered Water Cycle for the State of Texas, USA
The methodology explained in the previous section to represent and measure the “Natural Water General Cycle “ can be used to obtain behavioural changes for years in a country, state, city or a specific region. We obtain the average temperature in Texas, U.S.A. by year at different web sites. We will use the following link Average Temperature in Texas by Year, here we can find from 1895 to the actual year as shown in Figure 6A (Figure 6).
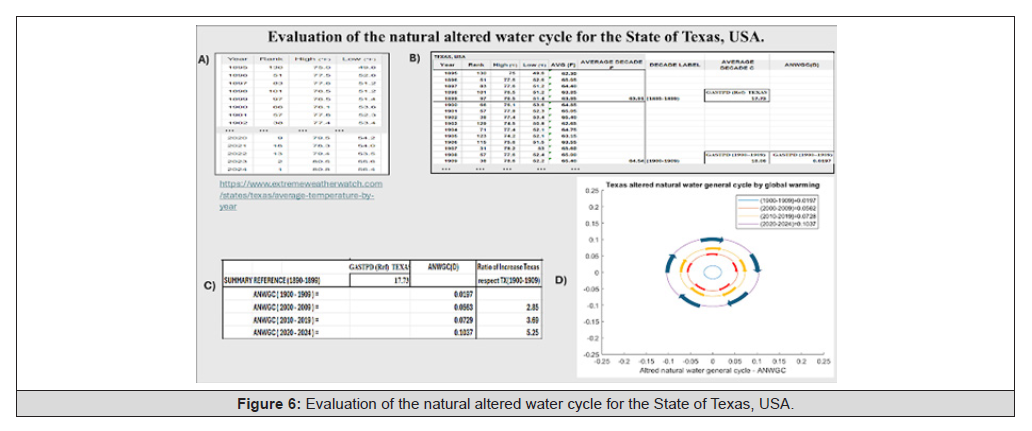
Figure 6:Evaluation of the natural altered water cycle for the State of Texas, USA.
As shown in Figure 6B, the first 2 decades and the addition of 5 columns are defined as follows to calculate the values required for the evaluation of the natural altered water cycle for the State of Texas USA
Average Temperature F in a year on Fahrenheit degree:
i. AVG (F) = average (High(F)+Low(F))
Decade Label = (year of initial and last of decade)
ii. i.e. average (1900:1909)
Average decade C conversion from Fahrenheit to centigrade degree
iii. Using Excel function CONVERT (average value,”F”,”C”)
Global Average Surface Temperature for Decade GASTD(D)
iv. GASTPD (decade initial year, decade Last year)
Altered Natural Water General Cycle for Decade ANWGC(D),
v. ANWGC(D)= ABS ((GASTD (To Evaluate) - GASTD(REF)) /
GASTD(REF))
The results obtained for the evaluation of the natural altered water cycle for the State of Texas USA are summarized with values as shown in Figure 6C and with a typical chart to observe the values of the alteration int the water cycle
Explaining the results obtained in Figure 6C:
i. The initial reference for the calculation is obtained from the
decade (1890-1899) =17.73 C
ii. The following ANWGC are (1900-1909) =0.0197 this is the
reference GASTD(REF) to obtain (2000-2009) =0.0563, (2010-
2019) = 0.0729 and the actual partial decade (2020-2024)
=0.1037. These values are shown in Figure 6D indicating how
the values of the natural water cycle are altered as growing
values.
Finally, the calculated altered natural water general cycle ratio
of increase of Texas related to the decade (1900-1909) are:
i. 2.85 times the growing rate for decade (2000-2009)
ii. 3.69 times growing rate for decade (2010-2019)
iii. 5.25 times the growing rate for the actual partial decade
(2010-2019)
This is an indication that the ratio of increase in the natural altered water cycle by global warming for Texas is growing now in an exponential way!
Remarks: Our result agreed with Celeste Saulo from World Meteorological Organization: Climate history is playing out before our eyes. We’ve had not just one or two record-breaking years, but a full ten-year series, and show that 2024 was the warmest year on record and the first above 1.5 degree centigrade
How to Evaluate the Natural Altered Water Cycle for The City of El Paso, Texas, USA
In The previous section the State of Texas was evaluated; here, the City of El Paso Texas is also evaluated, and then a comparison between them is made, and propose some solutions that can be built to make a follow-up to improve shortening the natural altered water cycle by global warming will be proposed.
Following the same methodology explained for representing and measuring the “Natural Water General Cycle “ Figure 7 shows the results obtained now for the City of El Paso, Texas (Figure 7).
Figure 7A shows a summary of the “Average Temperature in El Paso by Year” as seen in the extremeweatherwatch.com link.
Figure 7B shows the first 2 decades plus the addition of 5 columns to calculate the values required for the evaluation of the natural altered water cycle for El Paso Texas, USA.
Figure 7C shows a summary of the results, where:
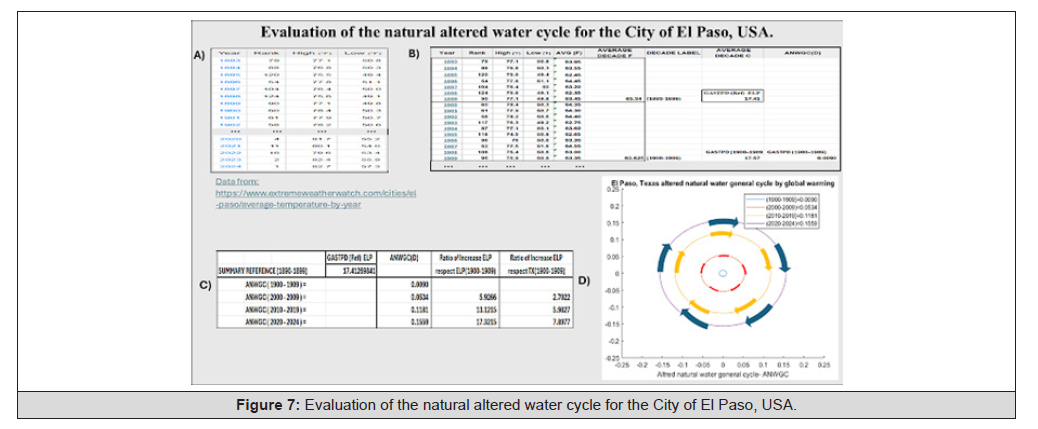
Figure 7:Evaluation of the natural altered water cycle for the City of El Paso, USA.
i. The initial reference for the calculation is obtained from the
decade (1890-1899) =17.41
ii. The following ANWGC are (1900-1909) =0.0090 this is the
reference GASTD(REF) to obtain the following as (2000-2009)
=0.0534, (2010-2019) = 0.1181 and the actual partial decade
(2020-2024) =0.1559. These values are shown in Figure 8D indicating
how the values of the natural water cycle are altered
as growing values.
iii. Finally, the calculated altered natural water general cycle ratio
of increase of El Paso, Texas with respect to the State of Texas
related to the decade (1900-1909) are:
iv. 2.7022 times the growing rate for decade (2000-2009)
v. 5.9827 times growing rate for decade (2010-2019)
vi. 7.8977 times the growing rate for the actual partial decade
(2010-2019)
This is an indication that the ratio of increase in the natural altered water cycle by global warming for El Paso, Texas, is growing even faster than the values obtained for all the state of Texas, showing a sharper exponential growth rate of the natural altered water cycle by global warming. This is because El Paso City is in a desertic region with higher temperatures.
General information about El Paso, Texas, USA and neighboring cities
El Paso, Texas, has a metro area population in 2025 of 1,006,000, a 1% increase from 2024. El Paso is an important entry point to the U.S. from Mexico through its twin city, Ciudad Juarez, Chihuahua, with 1,500,000 habitants separated by the Rio Grande River (Rio Bravo), that divide both countries USA and Mexico. These cities with Las Cruces, New Mexico with a population that has 115,000 habitants are refereed as El Paso–Juárez–Las Cruces or El Paso– Juárez–Southern New Mexico. The chief manufacturing industries of the three cities include food production, clothing, construction materials, electronic and medical equipment, and plastics. The area also produces cotton, fruit, vegetables, livestock, and pecans. More than 70 Fortune 500 companies call El Paso their home, including Hoover, Eureka, Boeing, and Delphi. El Paso’s economy is impacted significantly by the Mexican government’s Maquiladora Program. El Paso, Texas, has a combination of geographic regions of desert and mountain, with focus areas as industrial, agricultural, and livestock.
El Paso, Texas, Las Cruces New Mexico and Ciudad Juarez Chihuahua Mexico are three states in two countries, share one vital resource: drinking water, mainly from aquifers, the Mesilla and Hueco Bolsons Straddling the Franklin Mountains, the Hueco Bolson (to the east) and the Mesilla Bolson (to the west) together are to be a major aquifer by the Texas Water Development Board. The aquifers stretch north into New Mexico and south into Mexico. The Hueco Bolson is the principal aquifer for both El Paso and Ciudad Juarez in Chihuahua, Mexico. About 90 percent of water drawn from the aquifer is for public municipal use, serving homes and businesses. In a normal year, El Paso relies on the aquifer for about half of its water supply.
Proposed solution for El Paso El Paso–Juárez–Southern New Mexico to shortening the natural altered water cycle by global warming (Figure 8)
All the main recommendations are related to healing the water cycle implementing:
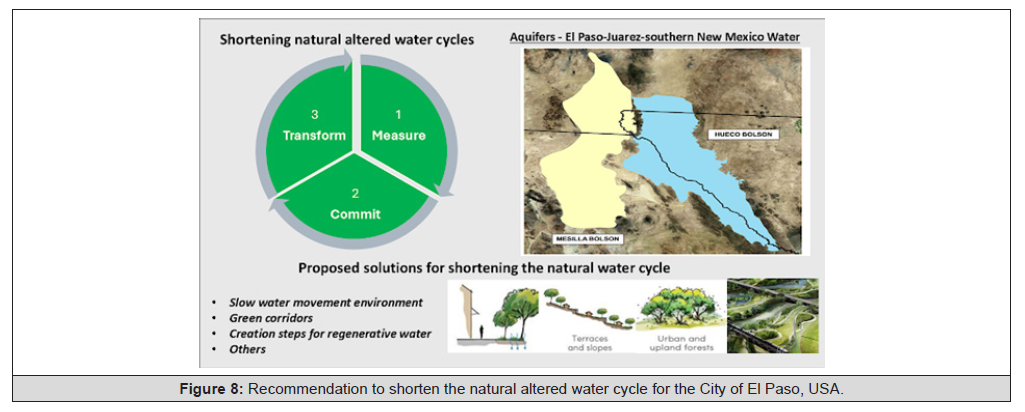
Figure 8:Recommendation to shorten the natural altered water cycle for the City of El Paso, USA.
i. Slow water movement environment advocates for the slowing of the flow of water through our landscapes. This way we can hydrate our landscapes better, rivers will run year-round more, groundwater can replenish: smaller water cycles will be healthier, and water from the wet season can still be in the ecosystem into the dry season [27].
ii. Green corridors, also known as biodiversity corridors, are large portions of land that receive coordinated actions to protect biological diversity. In cities, green corridors are linear natural infrastructure, such as trees and plants, that link up other green and open spaces to form a green urban network. They are designed to act as extensions of natural areas and connect green spaces in a city, allowing multiple ecological, social, cultural, and other uses compatible with sustainable land use [28]
iii. Creation steps for regenerative water are the concept of restoring the water cycles to the way they have been flowing naturally. This includes “replenishing groundwater so streams can flow, restoring rivers so that they’re more natural and the water can overflow the banks”[29].
Remark: An aspect that a lot of people don’t know about yet is that restoring the land can restore the rain!
Conclusions: Comparation of All Texas Water State vs the City of El Paso, Texas
The calculated altered natural water general cycle ratios of increase
of El Paso (ELP) Texas, with respect to the State of Texas related
to the decade (1900-1909) are:
i. 2.7022 times the growing rate for the decade at ELP (2000-
2009) versus 2.85 for the State of Texas
ii. 5.9827 times the growing rate for the decade at ELP (2010-
2019) versus 3.89 for the State of Texas
iii. 7.8977 times the growing rate for the actual partial decade at
ELP (2010-2019) versus 5.25 for the State of Texas (Figure 9)
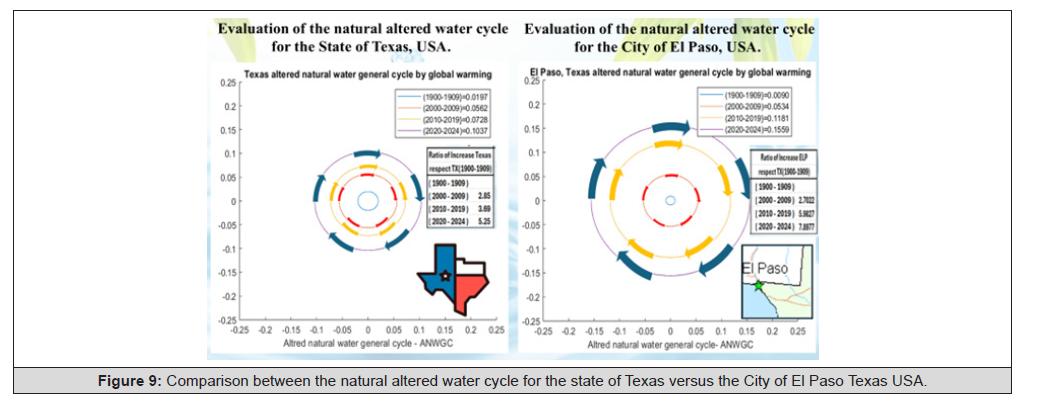
Figure 9:Comparison between the natural altered water cycle for the state of Texas versus the City of El Paso Texas USA.
As shown at Figure 9 the ratio of increase in the natural altered water cycle by global warming for El Paso Texas is growing even faster than the values obtain for all the state of Texas showing a sharper exponential growing rate of the natural altered water cycle by global warming, this is because El Paso City is in desertic region with higher temperatures then we can deduct the City Of El Paso Texas will be faster in problems with water scarcity, and it is time to act know with solutions that can be integrated into El Paso circular economy as explained in the last section.
Remark: this mathematical methodology will facilitate to measurement of the change of water scarcity by our economic activities that are affecting our availability of water, applying public policies and infrastructure investment and allowing measure again to compare if we can stop this trend and is possible reverse it.
This research is inspired on my previous publication “Perspective Chapter: Shortening the Natural Altered Water Cycle by Global Warming”
Video Presentation Available
(Figure 10) Link: How to measure & evaluate water availability in a region based on the natural water cycle (https://www.youtube. com/watch?v=059jzUfGg6A)
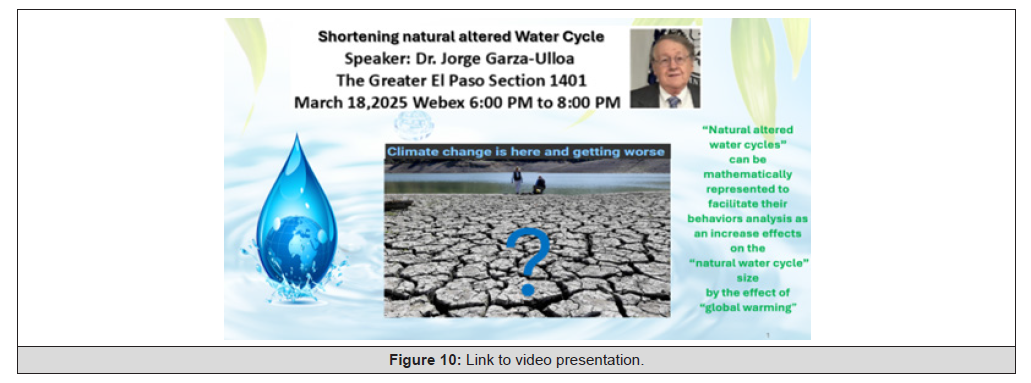
Figure 10:Link to video presentation.
Notices
Knowledge and best practices in this field are constantly changing as new research and experience broaden our understanding. Changes in research methods, professional practices, or medical treatment may be necessary. To the fullest extent of the law, neither the publisher nor the authors, contributors, or publishers assume any liability for any injury and/or damage to persons or property as a matter of product liability, negligence, or otherwise, or for any use or operation of any method, product, instruction, or idea contained herein.
Acknowledgement
None.
Conflict of Interest
None.
References
- (2019) Water Cycle – Definition & Steps Explained with Simple Diagram. Water Cycle. National Oceanic and Atmospheric Administration. Available from: https://www.noaa.gov/education/resource-collections/freshwater/water-cycle.
- Herring D (2020) Are Humans Causing or Contributing to Global Warming?. National Oceanic and Atmospheric Administration Available from: https://www.climate.gov/news-features/climate-qa/are-humans-causing-or-contributing-global-warming.
- (2018) Rivers Contain Groundwater. U.S. Geological Survey. Available from: https://www.usgs.gov/special-topics/water-science-school/science/rivers-contain-groundwater.
- Pörtner H O, Roberts DC, Tignor M, Poloczanska ES, Mintenbeck K, et al. (2022) IPCC: Climate Change: Impacts, Adaptation, and Vulnerability. In: editors. Contribution of Working Group II to the Sixth Assessment Report of the Intergovernmental Panel on Climate Change. Cambridge, UK and New York, NY, USA: Cambridge University Press: 3056.
- (2024) Droughts and Climate Change. U.S. Geological Survey. Available from: https://www.usgs.gov/science/science-explorer/climate/droughts-and-climate-change.
- Shao E (2023) How Is Climate Change Affecting Floods?. The New York Times. Available from: https://www.nytimes.com/article/flooding-climate-change.html.
- Colbert A (2022) A Force of Nature: Hurricanes in a Changing Climate. NASA Science. Available from: https://science.nasa.gov/earth/climate-change/a-force-of-nature-hurricanes-in-a-changing-climate/.
- Mann ME. Global Warming: Definition, Causes, Effects, Solutions, & Facts. In: Encyclopedia Britannica. Available from: https://www.britannica.com/science/global-warming.
- Roble RG (2003) Thermosphere. In: Holton JR, editor. Encyclopedia of Atmospheric Sciences. Academic Press pp. 2282-2290.
- National Geographic: Hydrosphere. Available from: https://education.nationalgeographic.org/resource/resource-library-hydrosphere/.
- States of Matter. Available from: https://www.chem.purdue.edu/gchelp/atoms/states.html.
- The UTCI Story Hub. What is UTCI? Available from: https://utci.lobelia.earth/what-is-utci.
- Pidwirny M (2006) Condensation, freezing, and deposition. In: Fundamentals of Physical Geography. 2nd ed. Okanagan: University of British Columbia. Available from: http://www.physicalgeography.net/fundamentals/8d.Html.
- Bourke P, Ziuzina D, Boehm D, Cullen PJ, Keener K (2018) The potential of cold plasma for safe and sustainable food production. Trends in Biotechnology 36(6): 615-626.
- Qian J, Yan W, Zhang W, Zhang J, Wang J, et al. (2024) Plasma-activated water: Perspective of the theoretical model, safety assessment and application in animal-derived products. Trends in Food Science & Technology 143: 104282.
- Plasma activated water. Available from: https://vitalfluid.com/plasma-activated-water.
- Assessing Water Scarcity: A Step-by-Step Tool Guide - WWF7 Water Resources. Available from: https://worldwaterforum.org.
- Omer N H (2019) Water Quality Parameters. London, UK: IntechOpen.
- John A (2024) July ends 13-month streak of global heat records as El Nino ebbs, but experts warn against relief. The Associated Press News. Available from: https://apnews.com/article/climate-change-heat-july-temperatures-global-warming-8dde2.
- Nick Steiner: The joy of restoring water cycles.
- World Bank. Water Resources Management. Available from: https://www.worldbank.org/en/topic/waterresourcesmanagement#3.
- Precipitation Measurements. National Oceanic and Atmospheric Administration, National Weather Service. Available from: https://www.weather.gov/.
- Franziska K, Fischer TW (2021) Chapter 7 - precipitation measurement techniques, typical data sets, and their application in erosion research and extreme value statistics. In: Rodrigo-Comino J, editor. Precipitation. Elsevier pp. 147-172.
- Lindsey R, Dahlman L (2024) Climate Change: Global Temperature. NOAA. Available from: https://www.climate.gov/news-features/understanding-climate/climate-change-global-temperature.
- Pare S (2023) The ‘safe’ threshold for global warming will be passed in just 6 years, scientists say. Live Science. Available from: https://www.livescience.com/planet-earth/climate-change/the-safe-threshold-for-global-warming-will-be-passed-in-just-6-years-scientists-say.
- American Society of Agronomy. Soil Management. Available from: https://www.agronomy.org/about-agronomy/soil-management/.
- How eco-tourism can help the regenerative water movement: Anna Pollock interview, link: How eco-tourism can help the regenerative water movement: Anna Pollock interview.
- Perspective Chapter: Shortening the Natural Altered Water Cycle by Global Warming, written by Jorge Garza-Ulloa, submitted: 11 August 2024 Reviewed: 26 August 2024 Published: 23 January 2025.
- Available from: https://www.mathworks.com/.




 We use cookies to ensure you get the best experience on our website.