
Research Article 
 Creative Commons, CC-BY
Risk Assessment of Heavy Metals Concentrations in Improved Varieties of Millet, Maize, Rice, Beans, And Sorghum Harvested Around Challawa Industrial Area, Kano State
*Corresponding author:Abubakar Zubairu Yusha’u, Department of Chemistry, Federal University of Education, Kano.
Received:June 09, 2025; Published:June 18, 2025
DOI: 10.34297/AJBSR.2025.27.003563
Abstract
Human health risks are linked to exposure to hazardous metals. The study, aimed to evaluate the levels of heavy metals like Cadmium (Cd), Arsenic (As), Lead (Pb), Zinc (Zn) and Copper (Cu) in improved crops harvested around Challawa industrial area. The selected samples were digested, and analyzed using an atomic absorption spectrophotometer. The samples included millet, maize, rice, beans and sorghum. The results shows that the levels or concentration of As, Pb, Cd, Cu and Zn for millet, maize, rice, beans and sorghum are in the ranged of 0.005-0.020 mg/kg (0.015-0.040mg/kg), 0.002-0.050mg/kg (4.5-7.0 mg/kg), and 22.0-36.0mg/ kg), respectively Table 2. Arsenic concentrations were lowest in beans (0.005mg/kg) and highest in rice (0.020mg/kg). All crops had cadmium concentrations below established maximum levels (FAO/WHO guideline limit), indicating acceptable safety margins. According to the study, there is no risks associated with consuming any of the improved harvested crops. The hazard index via ingestion values were found to be less than 1, indicating no need for potential non-carcinogenic concern. Generally, there is no cancer risk with consumption of the crops in terms of all the metals investigated.
Keywords:Risk Assessment, Heavy metals, Improved varieties, Challawa
Introduction
Smallholder farmers received intervention from Kano State Government to strengthen Food and Nutrition Security (FNS) which is in line with UNDP’s vision of revitalizing the socio-economic activities of the smallholder farmers. During the intervention, farming tools, fertilizers, improved seeds, and training on how to utilize smart agriculture techniques were given to the farmers to boost FNS. Some of these farmers are located in an industrial area where heavy metals are discharged into the surrounding environ ment. The harvested improved crops are marketed without quality control measures, and door-to-door delivery is commonly practiced with virtually no quality control at all levels. A feasibility study showed that much attention is given to food security neglecting the nutrition security unattended.
Heavy metals are metallic elements with a density of more than 5g/cm3 and include, among others, Chromium (Cr), Cadmium (Cd), Copper (Cu), Arsenic (As), and Lead (Pb). When human beings are exposed to heavy metals such as lead, cadmium, chromium, and arsenic, they have an impact on their health [9]. Human’s ability to absorb heavy metals through diet has been shown to have serious health implications. They build up in human organs such as the liver, kidney, and bones and cause serious health problems [10]. Through a variety of processes, heavy metals bioaccumulate in living things and have negative impacts [9].
Due to its significant negative impacts on the environment and human health, heavy metal contamination is one of the main issues for the safety and security of food [6,7]. Heavy metals can bioaccumulate through biological chains, which make them persistent and non-biodegradable, hence resulting in a lengthy biological half-life [6]. Although heavy metals are important as trace elements, their biological toxicity on human biochemistry is a major concern [5]. The residents of Challawa consume these harvested crops, which suggests that there may be a chance for these metals to bioaccumulate over time and endanger their health. However, no extensive work has been done on the health impact of the consumption of the harvested improved crops on the inhabitants. Therefore, the purpose of this study was to evaluate the levels of Lead (Pb), Zinc (Zn), Copper (Cu), Arsenic (As), and Cadmium (Cd) in a variety of harvested improved crops provided to the smallholder farmers and to assess their health risks on human.
Materials and Methods Study Area
The research was carried out in the industrial area of Kumbotso Local Government area of Kano State in the North-Western part of Nigeria and lies between latitude 120 37’ North, 90 33’ South and longitude 90 29’ East and 70 43’ West. There is also a lot of industrial activity, urbanization, and population growth, all of which might generate high metal levels. The evaluation of the amount of heavy metal concentrations will give a fair depiction of the toxicity of these metals.
Samples and Sample Collections
Harvested improved crop samples of millet, maize, rice, beans, and sorghum were collected from smallholder farmers under the project. The crops were weighed, dried in the oven (Gallenkamp Oven Model SA 9059 B) at 50°C, ground into powder, and then sieved with No 72 mesh size (Griffin and George Ltd., London). The samples were stored in plastic containers with screw caps and kept in the freezer until use.
Digestion of the Harvested Improved Crop Samples
The samples were digested before analysis using an Atomic Absorption Spectrophotometer (AAS) (Shimadzu model AA 6300). 50ml of the sample was measured into a round bottom flask, and 5g of the dried sample with constant weight was added to a 100ml reflux flask. 5ml of concentrated nitric acid (HNO3) was added to each sample and the mixture was heated on a hot plate for 20min at 105°C. Using Whatman 0.45μm membrane filter paper, the sample was filtered after cooling in a water bath at 36°C for two hours.
Analysis of Heavy Metals
With the use of an AAS (Shimadzu model AA 6300), the digests were examined for Zn, Cd, Cu, Pb, and As concentrations.
Quality Assurance/Quality Control
To establish accuracy, all analysis were repeated three times with the metal blanks being used as a control group each time. All of the glassware underwent a pre-soaking process in a 5%HNO3 solution, rinsed with deionized water, and oven-dried. The appropriate modifications were done after running the blanks. After the equipment had been standardized, the wavelength of the sample was determined (As-189.0, Cd-228.8, Zn-206.2, Pb-283.3, and Cu- 324.5). High percent recovery was observed for all metals calibrated between 0.01 and 3.5mg/l (92–100%). The measurements were made in triplicate, and the means were recorded.
Health Risk Assessment of the Harvested Improved Crops
Based on the metal concentration, a risk evaluation for carcinogenic and non-carcinogenic effects was performed. Humans are exposed to heavy metals primarily through three routes: inhalation through the nose, ingestion through the mouth, and dermal absorption through skin contacts; dermal absorption and ingestion are frequently associated with water exposure. The United States Environmental Protection Association’s Risk Assessment Guidance for Superfund (RAGS) approach was used to derive the words for the human health risk assessment Guengerich, et al., (2009) [5].
Eqs. (1) and (2) provide the relationship needed for the calculation

Where HQing/derm is the hazard quotient via ingestion or dermal contact and Rfing/derm is oral/dermal reference dose (g/kg/day). The Rfing and RfDderm values were obtained from the literature (USEPA, EPA, 1989) [12,13]. The Hazard Quotient (HQ) is a numerical assessment of the potential for systemic toxicity posed by a single metal and a single exposure method (Eq. 3). By integrating the calculated HQs for each metal, the combined non-carcinogenic potential effects of many metals are assessed and expressed as a Hazard Index (HI), as shown in equation (Eq. 4)

Where HIing/derm is the hazard index via ingestion or dermal contact.
Chronic Daily Intake (CDI) was calculated using Eq. (5).

Where Cfood, DI, and BW stand for the body weight, the average daily calorie intake, and the amount of heavy metals present in food in mg/kg, respectively. Cancer Risk (CR) was also evaluated using Eq. (6).

Where SFing is the cancer slope factor. The SFing for As is 1.5 x 10³, Pb is 8.5μg/g/day and Cd is 6.1 x 10³ [12].
Results and Discussion
Heavy metals levels in the varieties of millet, maize, rice, beans and sorghum harvested around Challawa industrial area are shown in Table 1. The results shows that the levels or concentration of As, Pb, Cd, Cu and Zn for millet, maize, rice, beans and sorghum are in the ranged of 0.005-0.020mg/kg (0.015-0.040mg/kg), 0.002- 0.050mg/kg (4.5-7.0mg/kg), and 22.0-36.0mg/kg), respectively (Table 2). Arsenic concentrations were lowest in beans (0.005mg/ kg) and highest in rice (0.020mg/kg). Previous studies have shown that urbanized areas significantly impact lead concentrations in crops [2]. All crops had cadmium concentrations below established maximum levels, indicating acceptable safety margins. Copper levels were highest in beans (7.0mg/kg), while zinc was notably higher in millet (36.0mg/kg). Zinc is essential for plant growth, while elevated copper levels can indicate soil contamination. The study revealed that as content of maize, rice, millet and sorghum are risk-free after consumption. This result is similar to that of Zazoli, et al., (2010) [18] that reported Pb concentration in a range of 0.04-0.23mg/kg in cereal samples eaten in Finland. However, these results are lower than those reported by Jahed Khaniki & Zazoli, et al., (2005) [11] where Pb levels in corn, bean ranged from 0.70 to 1.95mg/kg, 1.45-2.44mg/kg, 0.54-4.89mg/kg, 0.74-1.36mg/kg, 1.26-2.96mg/kg and 0.90-3.23mg/kg, respectively. Similar studies reported Cu was detected in cereal samples ranging from 0.55 to 6.77mg/kg, 1.59-10.56mg/kg, 1.20-3.10mg/kg Khaniki & Zazoli, et al., [11], 2.00-14.00 mg/kg Khaniki & Zazoli, et al., [18] (Tables 1,2).

Table 1:Heavy metals concentrations in improved crop sampled from Challawa industrial area (mg/kg).

Table 2:Dermal permeability coefficient (KP) (cm/h).
Source*: USEPA, EPA & WHO 2021.
The measured dermal permeability coefficients indicate that copper (0.010-0.018mg/kg) and zinc (0.010- 0.014mg/kg) show a relatively higher potential for dermal absorption in all the crops, while, as (0.00001- 0.00005) has the least dermal permeability coefficients. Adebayo, et al., (2018) [1] conducted assessments of copper uptake and reported dermal permeability coefficient in millet at approximately 0.029cm/h, which is higher than the present studies, indicating significant uptake potential which is a reflection of potential health risks associated with consuming contaminated crops. Yuan, et al., (2021) [16,17] investigated arsenic accumulation in rice and its health implications and dermal permeability coefficient ranged from 0.011 to 0.024 cm/h for rice. In the same vein, Divrikli, et al., (2006) [3] measured lead accumulation in beans and maize and ranged from 0.004 to 0.010cm/h, particularly higher in maize. Erdem, et al., (2013) [4] analyzed zinc transfer in grain crops. The dermal permeability coefficient for zinc was around 0.15cm/h across crops like millet and maize. Zinc is an essential trace element, but elevated levels can lead to toxicity. Hossain, et al., (2017) [8] examined cadmium levels in rice 0.013cm/h and sorghum 0.008cm/h. The dermal permeability coefficient for all the heavy metals is below the Reference standard which is an indication for safe consumption (Table 3).
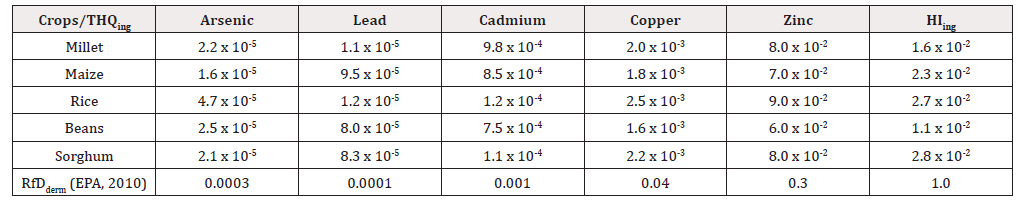
Table 3:Non-carcinogenic health risk assessment for the heavy metals in the food for adults and children through ingestion.
The non-carcinogenic health risks concerning the consumption in terms of the heavy metals are presented in Table 3. The THQing for as varied from 1.60x10⁻⁵ to 4.70x10⁻⁵. Only consumption of rice has a high dose of 4.70x10⁻⁵. Pb, Cd and Cu THQing values were not high for all the crops (Table 3). Zn doses consumption of millet, maize, rice beans and sorghum were not significant and was <9.0 x 10⁻². The HIing containing As, Pb, Cd, Cu and Zn were not high, as shown in Table 3. The rate of ingestion of as in this study were within the RfDing of 3.0 x 10⁻⁴. The consumption of the crops in the study poses no Cd and Pb related health risks as the RfDing is not exceeded. The consumption of the crops containing Zn and Cu will pose no health risk as the RfDing for Zn and Cu were within the thresholds limit. Hling values were established to be less than unity. Hence, there is no need for great concerns as there are no potential non-carcinogenic effects. The exposure dose via dermal contact of as in crops are within the RfDderm. This places no health threat for consuming the crops containing as (Table 4).

Table 4:Chronic Daily Intake (CDI) for the heavy metals (mg/kg-d).
Chronic Daily Intake values for Cu range from 0.4-0.8mg/day across all the crops, with rice exhibiting the highest intake. The consumption levels through these crops indicate they are a valuable dietary source of copper, essential for various biological functions. Arsenic intake from these crops’ ranges from 0.001-0.005 mg/day, with rice contributing the most due to its higher uptake capabilities. WHO guidelines for arsenic consumption state that long-term exposure should not exceed 0.1mg/day [14,15]. Lead chronic daily Intake values are low, typically ranging from 0.004-0.01mg/day. The values for zinc are highest in millet (1.8mg/day) and beans (1.5mg/ day). Zinc is essential for numerous physiological functions, making these crops significant sources of dietary zinc. The cadmium intake is low across all crops, ranging from 0.001- 0.03mg/day. Cadmium has both acute and chronic toxic effects, and the WHO advises that dietary exposure should be minimized [14]. The levels observed in this study are below concern thresholds; however, cadmium bioaccumulation in soils should be monitored to mitigate future risks.
Conclusions
Concentration levels of As, Pb, Cd, Cu and Zn measured in the crops were low compared to the standard limit. The human health risk related to dose through dermal and consumption containing As, Pb, Cd, Cu and Zn were not high, Hence, this cannot cause any carcinogenic effect to them. HIderm for all the metals studied were less than one indicating that dermal adsorption of these metals could have little or no health risk. All the metals assessed were within the acceptable limit of cancer risk value. While chronic daily intake values for heavy metals in millet, maize, rice, beans, and sorghum are generally within acceptable limits, ongoing monitoring is crucial, particularly concerning arsenic, lead, and cadmium. These crops serve as important dietary sources of essential elements like copper and zinc.
Acknowledgements
We want to acknowledge the Tertiary Educational Trust Fund for sponsoring this project through Federal University of Education, Kano, Nigeria.
Conflict of Interest
None.
References
- Adebayo AH (2018) Assessment of Heavy Metal Levels in Soil and Selected Vegetables. Journal of Environmental Management 227: 256-263.
- Baker JM (2018) Heavy Metal Contamination in Urban Agriculture: Impacts on Crop Quality and Food Safety. Environmental Science and Technology 52(8): 4677-4685.
- Divrikli U (2006) Lead Content of Vegetable Samples and Potential Health Risks. Environmental Monitoring and Assessment 115(1-3): 209-214.
- Erdem R (2013) Effects of Heavy Metals in Agricultural Soils on Plant Growth. Water Air and Soil Pollution 224(5): 1517.
- Guengerich FP (2009) Thematic mini review series: metals in biology, J Biol Chem 284(28): 18557.
- Haware DJ, Pramod HP (2011) Determination of specific heavy metals in fruit juices using Atomic Absorption Spectrophotometer (AAS). Int J Res Chem Environ 4 (3): 163-168.
- Hussain I (2019) Dermal Absorption of Heavy Metals from Contaminated Agricultural Products: Risk Assessment and Management. Environmental Research 174: 88-97.
- Hossain MS (2017) Cadmium Uptake by Rice Varieties and Health Implications. Ecotoxicology and Environmental Safety 139: 190-196.
- Islam MR, Jahiruddin M, Alim V, Akhtaruzzaman (2013) A Consumption of Unsafe Foods: Evidence from Heavy Metal. mineral and Trace Element Contamination 1-27.
- Iweala EEJ, Olugbuyiro JAO, Durodola BM, Fubara Manuel DR, Okoli AO (2014) Metal contamination of foods and drinks consumed in Ota Nigeria. Res J Environ Toxicol 8: 92-97.
- Jahed Khaniki, G Zazoli V (2005) Cadmium and lead contents in rice (Oryza sativa) in the north of Iran. Int J Agric Biol 7: 1026-1029.
- USEPA (1989) Risk Assessment Guidance for Superfund, in: Human Health Evaluation Manual (Part A), report EPA/540/1-89/002, vol. 1, United States Environmental Protection Agency, Washington, DC, USA.
- (2021) USEPA Dermal Exposure and Risk Assessment Guidelines. U.S. Environmental Protection Agency.
- (2010) World Health Organization (WHO) Arsenic in drinking-water: Background document for development of WHO Guidelines for Drinking-water Quality.
- (2018) WHO Guidelines for the Assessment of Risks to Human Health from Chemicals in Food. World Health Organization.
- Yuan X (2021) Arsenic uptake and Translocation in Rice: Assessing Health Risks. Environmental Pollution 267: 115610.
- Zhang Y (2019) Lead contamination in urban agriculture: A global perspective on sources and solutions. Environmental Pollution 245: 387-395.
- Zazoli M, Mohseni Bandpei A, Ebrahimi M, Izanloo H (2010) Investigation of cadmium and lead contents in Iranian rice cultivated in Babol region. Asian J Chem 22: 1369-1376.




 We use cookies to ensure you get the best experience on our website.