
Research Article 
 Creative Commons, CC-BY
Understanding the Impact of Medical Research to Improve Patient Outcomes
*Corresponding author:Chrystyne Olivieri, Sacred Heart University, College of Nursing Fairfield, Connecticut.
Received:July 22, 2025; Published:August 04, 2025
DOI: 10.34297/AJBSR.2025.27.003627
Abstract
Aim: The ultimate goal of clinical research is to increase medical knowledge and improve patient outcomes. As Health Care Providers,
we all rely on the research results of new drugs and treatment options to guide our practice and improve patient lives. Although
all researches must adhere to a code of ethics when conducting research, there is an emerging problem of fraud in Academia that
seems to be getting worse.
Design: Evidence based practice is the foundation of healthcare in America, however can we rely totally on the evidence published?
It is important to understand the way data is presented to Health Care Providers who may not totally understand these research
results. This may cause drugs or interventions that are not very efficacious to be used in the care of patients.
Conclusion: How data is presented to Health Care Providers matters. The two main ways that medical research is presented is as
Relative Risk Reduction, which is a way of presenting data that seems more robust and impressive and Absolute Risk Reduction.
Both metrics are from the same data set which may make them misleading. If Health Care Providers understood the difference, they
may make different clinical decisions.
Implications for Patient Care: There is evidence that most Health Care Providers do not fully understand research results as it
is presented in study articles. The Pharmaceutical Industry has notoriously presented their own data as Relative Risk which is a
known manipulation of the data to make a drug appear to be more beneficial. This has changed the way drugs are used by Health
Care Providers, but has not improved health outcomes for patients.
Goals of Clinical Research
The ultimate goal of clinical research is to increase medical knowledge and improve patient outcomes. We rely on clinical research to help us take better care of our patients based on this knowledge. Clinical research allows us to believe that the treatments and education we provide to our patients have been prov en safe and effective, without too many side effects or interactions, which are generally identified by the research. When the level of evidence is high, we have reliable and valid knowledge. The quality of the evidence comes in different levels with the highest quality at the top of the evidence pyramid (Figure 1).
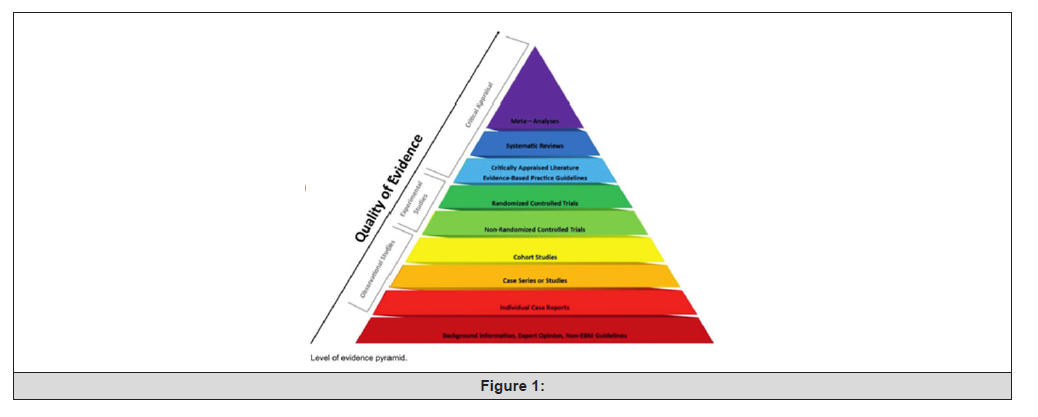
Figure 1:
The research studies we encounter in most medical journals are generally cohort studies, experimental design, systematic reviews and meta-analysis. We have come to rely on these published articles and studies to increase our clinical knowledge. Most medical research in the high impact journals are Randomly Controlled Trials (RTC), Evidence-Based Practice guidelines (EBP), systematic reviews and meta-analyses. Prior to conducting a research study, all researchers must complete and maintain a “Code of Ethical Conduct” certification (usually Collaborative Institutional Training Initiative - CITI Training). However, that doesn’t mean all published research results adhere to ethical principles. This article is going to examine how conclusions from research may be misleading and how the display of findings may lead to poor patient outcomes. When interpreting research results based directly on what the author states as a conclusion may lead a healthcare practitioner to think the drug or intervention that was studied is better than it actually is. Healthcare providers need to read beyond just the conclusions to truly understand if the research results can be applied to their patients and that the patients will actually benefit. Because this is such an important part of understanding research results, this article will begin with a brief discussion of some of the problems leading to the broad misunderstanding of research results today.
Fraud in Academia
When reading medical research, one should examine the conclusions through a careful scrutiny of the techniques employed doing the research. Look for sponsorships for the research and if the sponsor may have influenced the collecting and reporting of data. Often, sponsors provide much or all of the funding and can bias the results. The reason for fraud in academia include misconduct in collecting, representing and reporting data [1]. There is a lot of pressure put on university faculty to constantly and consistently publish to maintain faculty positions – the “Publish or Perish” [2] mantra. Subsequently, this has led to the proliferation of “Predatory Journals”. These are journals created mainly for profit, not for academic quality and integrity. They often have a poor peer review process (or none at all), charge exorbitant fees of the author and/or less than rigorous submission guidelines [3].
Fraud is not exclusive to university faculty. One famous case of outright fraud in academia was published in The Lancet in 1998 by (then) Dr. Andrew Wakefield. His paper, which stated a link between Autism and the Measles, Mumps and Rubella (MMR) vaccination was published and retracted 12 years later. He carefully pre-selected the 12 children in his study. As this made the news cycle, many parents and other medical professionals believed this connection. Lawsuits followed, suing vaccine manufacturers on behalf of parents. Although Dr. Wakefield lost his license to practice medicine over this, the lack of trust in vaccinations persists to this day [1].
Academic fraud is not a new thing. Defrauding in academia by researchers for personal gain is something that undermines the integrity of the research community. It is believed to be a huge threat and can cause undo damage to our healthcare system, ultimately affecting patient care. It undermines the trust and credibility of scientific research and in turn undermines the public trust in medicine and academia.
If a published paper is found to be fraudulent, the journal may decide to “retract” it, or remove it from publication. If a scientific paper undergoes retraction, it is almost always due to errors, which is much more common than outright fraud [4]. Bias in research is also a problem which compromises the integrity of research based on implicit and/or explicit bias. The difference here is implicit bias is a person’s unconscious prejudice and explicit bias is a conscious preconception about a group.
Steen, back in 2011 stated that “the incidence of research fraud is increasing”, so to think it is not a problem today is a mistake. There are many methods for academic fraud from data fabrication, adding uncredited authors, manipulating authentic data to “prove” a hypothesis, to plagiarism and other mistakes that may invalidate research results. The process to detect fraud include rigorous peer-review, whistle-blowing, external review bodies and performing replication studies. Increasing awareness is only one way to prevent out-right fraud. Punishment and deterrence are also used to discourage unethical researchers; however, the industry may need to revise its practices to truly overcome this major threat to society as a whole [5].
Evidence Based Practice (EBP)
Despite awareness of academic fraud practices, all healthcare practitioners will continue to rely on evidence obtained through research to provide the tools to help improve the lives of patients. When one reads a research study, we need to understand how to interpret the results and determine if this is something we can use or not. We also rely on the journals to vet the articles for accuracy, reliability and relevance. It is then that healthcare providers have the tools to make a proper diagnosis, choose the best therapeutic intervention and provide specific, usable patient education to keep patients healthy. Evidence based practice is making patient care decisions based on the most current research available, in conjunction with the providers experience, patient preferences with the ultimate goal of providing high-quality, safe and effective care.
It is not just healthcare providers that rely on the accuracy and validity of published research results. These research results also influence major medical organizations like the American Heart Association (AHA), The American Diabetes Association (ADA), The American Cancer Society (ACS), among others. These organizations rely on research to set the standards for patient care within their specialty. Healthcare providers rely on these standards to help guide clinical practice. Research also influences U.S. Governmental Organizations that have a lot of power over our current medical system such as the Food and Drug Administration (FDA), United States Department of Agriculture (USDA) and the Centers for Disease Control and Prevention (CDC), among others [6].
When we hear reports, protocols and recommendations from the U.S. Government, people listen because it influences public policy which affects millions of people. And lastly, research influences screening organizations like the US Preventative Services Task Force (USPSTF) which makes recommendations for screening guidelines for just about everything in our medical system [7]. Another example is the American College of Obstetrics and Gynecology (ACOG), which makes screening recommendations for Mammograms and Pap smears for primary prevention. They also obtain their basic data from published scientific research [8].
We know that research needs to be reliable and evidence-based. But every healthcare provider also needs to understand the research they are reading. Even among healthcare providers practicing for many years, several research studies have found a poor understanding of basic research principles among many medical providers in multiple specialties. Healthcare providers that struggle to understand basic statistical concepts may misinterpret results when discussing options with a patient [9]. This will eventually impact a patient’s future health, perhaps by including ineffective drugs/interventions, or even harm patients. In fact, numerous published studies contain errors in application, analysis or interpretation of statistics, often enough to cast doubt on the overall results [8]. Many large-scale studies publish their research results in vague or misleading terms. The average healthcare provider may be ill equipped to identify and discern errors from reliable results. It is for this reason that understanding basic research results with a critical eye is needed.
For decades, our healthcare system has been subject to a type of misrepresentation, specifically from the pharmaceutical research industry. This will be discussed here as it may be contributing to why our medical system is deeply burdened with increasing chronic disease in America [9], despite our very expensive and expansive healthcare system.
Understanding Research Results
Most medical studies published in high-impact journals as well as most ALL pharmaceutical funded studies have used Relative Risk Reduction (RRR) to report their findings. This is a way of presenting the data findings in a percent format. If a study says “use our drug as it will lower cardiovascular risk by 36%”, that would seem like the drug is highly effective at lowering cardiovascular risk. However, if the same study using the same data says “use our drug as it will lower cardiovascular risk by 1.1%, hardly anyone would think this drug does much good. But that is exactly what has been happening in many pharmaceutical research studies for decades.
What is being described is the difference between Relative Risk Reduction (RRR) and Absolute Risk Reduction (ARR). Both are measures of the same data. Most healthcare providers don’t have time to read all the research studies published and they rely on the bottom line: “Will this drug/intervention improve my patient’s health/reduce risk factors/help them to live longer, better lives?” This is what every healthcare provider cares about. Therefore, how the data is presented matters and this can influence how the results are interpreted and if they are incorporated into the care of patients.
Looking back at all the years of published research, the main
thing that any healthcare provider and patients care about is:
If I take the drug/intervention, what are my chances of developing
the problem -or-
If I DONT take the drug/intervention, what are my chances of
developing the problem.
That is not Relative Risk Reduction, but it is Absolute Risk Reduction.
National Guideline recommendations and advice from top medical organizations are often based on the RRR. However, to express the data this way can be interpreted as a manipulation of the data, leading readers to think the findings as more robust than they actually are. Historically, most medical research has avoided publishing the ARR as this is almost consistently less impressive than the RRR, even though it is the result of the exact same data. The difference between these two metrics is examined below.
Relative Risk Reduction vs Absolute Risk Reduction
Relative Risk and Absolute Risk are both measures used to help understand research results. In clinical trials they are measures of whether an effect size is clinically important. The effect size is a statistical measure that indicates the strength of a relationship between variables between groups. Both measures use the same data, expressed differently. Number Needed to Treat (NNT) is another way of looking to see if the data have significant results. This metric will be discussed later (Figure 2).
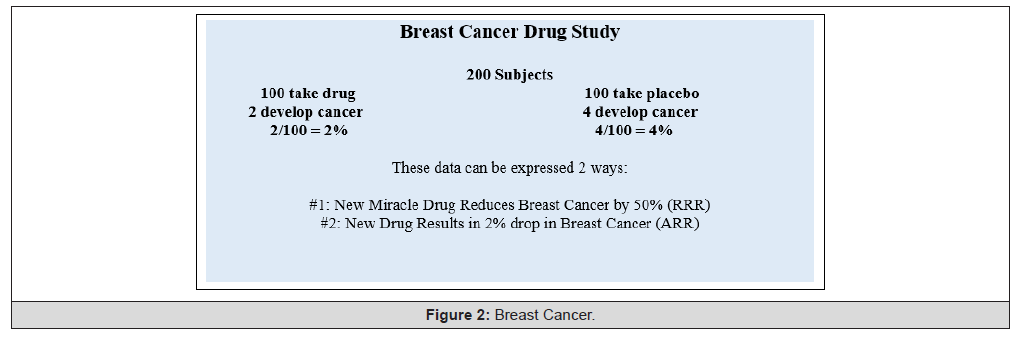
Figure 2:
For example, Figure 2 represents a hypothetical study on a breast cancer drug. Exactly 200 women were recruited, all at high risk for breast cancer with 100 women in the drug arm and 100 in the placebo arm. After 5 years, 2 women in the drug arm develop breast cancer compared to 4 women in the placebo arm. One can interpret these data two ways, RRR or ARR. As displayed in Figure 2, headline #1 is using relative risk to present the findings and headline #2 is using absolute risk to present the findings. Which one is more impressive and will sell more of the drug?
One problem with the RRR measure is that without knowing the level of risk in the control group, one cannot assess the effect size in the treatment group. Treatments with very large relative risk reductions may have a small effect size in conditions where the control group has a very low bad outcome rate. On the other hand, modest relative risk reductions can assume major clinical importance if the baseline (control) rate of bad outcomes is large. Absolute risk reduction is just the absolute difference in outcome rates between the control (placebo) and treatment groups (Control – Treatment). The absolute risk reduction does not involve an explicit comparison to the control group as in the relative risk reduction and thus, does not confound the effect size with the baseline risk.
Although RRR is most commonly used in medical research to describe outcomes in relative terms, it does not consider the actual risk of the intervention being studied. This is because most research is done on a population that already has risk factors for the intervention. These subjects are included in a study to see if the drug/intervention works. This data usually cannot be definitively extrapolated to the larger population as many people may not have those risk factors at all. However, many drugs are being prescribed for “primary prevention”. That means the person doesn’t have the disease (yet) and may never get it. We cannot necessarily extrapolate the research results to a healthy population, so the population in the study needs to be considered.
All risk measures indicate the reduction in disease for those undergoing an intervention compared to those NOT undergoing the intervention; experimental group vs placebo group [9]. The RRR reflects relative risk data as a percentage by comparing the risk in the drug/intervention group relative to the risk in the placebo group. The study subjects are often chosen to participate as they generally have the health problem for which the drug/intervention is hoped to be effective. One problem with using RRR is that without knowing the level of risk in the control group, one cannot assess the effect size in the treatment group. The formula for calculating the RRR is - Control minus Treatment divided by Control. In order to make sense of the RRR, you must know the ARR.
ARR is the exact results of the difference between the intervention arm and the placebo arm of any research study, hence the name “absolute”. There is no manipulation of data designed to get a more impressive number. This calculation does not involve an explicit comparison to the control group as in the RRR. Therefore, it does not confound the effect size with the baseline risk. The formula for calculating the ARR is - Control minus Treatment.
The ARR is similar to another research term – Number Needed to Treat (NNT). This is the actual number of people that would need to use/take the drug/intervention in order for 1 person to benefit. The lower the NNT, the more robust the data and more effective the drug/intervention being studied. NNT’s 10-15 are usually very good outcomes, however when the NNT is close to or beyond 100, this is NOT good outcomes and should not be extrapolated to the general public as good, robust results. NNT tells us how much the drug/intervention has prevented disease and along with ARR, is a much better assessment of the clinical significance of the drug/ intervention. More and more recent research results are being published using the NNT. The formula for calculating the NNT is 1 divided by ARR (Figure 3).
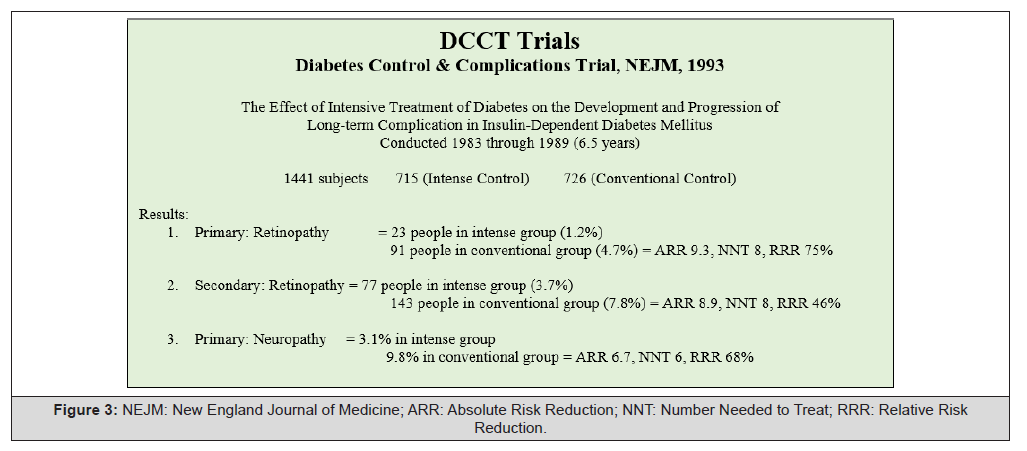
Figure 3:NEJM: New England Journal of Medicine; ARR: Absolute Risk Reduction; NNT: Number Needed to Treat; RRR: Relative Risk Reduction.
Let’s look at a very robust study that changed the face of glycemic control in patients with Diabetes. (Figure 3) The Diabetes Control & Complications Trial (DCCT) [10] published in the New England Journal of Medicine in 1993 was the result of over 6 years of study. It looked to see if intensive insulin therapy (tighter glycemic control) in people using insulin, specifically those with Type 1 Diabetes, would lead to less complications of diabetes over time compared to conventional insulin therapy. In this example, data for development of retinopathy and neuropathy are in the figure. The ARR and NNT were quite impressive for all treatment groups and complications. Rarely do research studies of pharmaceuticals have this kind of robust data. When the NNT is <10-15, you know you have study results that will truly help a lot of people.
Why Does All this Matter?
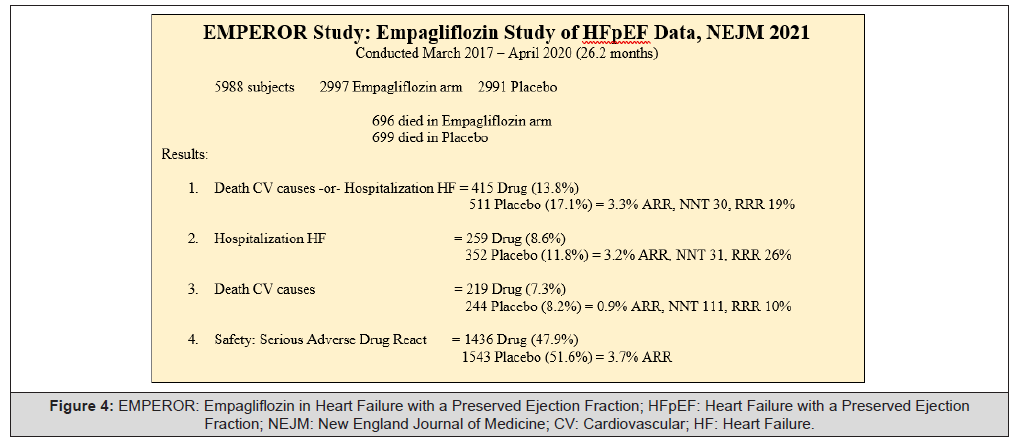
Figure 4:EMPEROR: Empagliflozin in Heart Failure with a Preserved Ejection Fraction; HFpEF: Heart Failure with a Preserved Ejection Fraction; NEJM: New England Journal of Medicine; CV: Cardiovascular; HF: Heart Failure.
Understanding the little details of pharmaceutical studies is important because healthcare providers prescribe drugs – a lot of drugs. And our population in the United States doesn’t seem to be getting healthier because of it. In Figure 4, the EMPEROR [11] Study results were not as impressive as the DCCT Trial. The ARR of death from cardiovascular causes -or- hospitalization for Heart Failure was 3.3%. That means that 96.7% of the people did not experience the anticipated outcome. The NNT was 30 and the RRR was 19% - not robust data that it reduces death and hospitalization for a drug with a cardiovascular indication. Also, note the serious adverse drug reaction data. More subjects had an adverse reaction to the placebo than to the drug. This is a curious finding that may make you ask, “What’s in the placebo?” for this randomized, double-blind, parallel-group, placebo-controlled, event-driven trial (Figure 4).
Researchers have identified that some drug studies that simply report the RRR may not have robust ARR data, which is why it is considered misleading. A meta-analysis done by Byrne in 2022 [12], published in the Journal of the American Medical Association (JAMA) evaluated 21 statin trials on primary and secondary prevention of cardiovascular disease. They identified the ARR of multiple studies and found modest results compared to RRR and that the results published were basically inconclusive. It is because of research like this that we need to doubt when a study only publishes the RRR. Since the RRR is the more impressive number, it may help to understand this concept to look at several large research trials published to support the most prescribed drug in America.
There were 4 main research trials that put Lipitor into the medicine cabinets of millions of Americans. They are ASCOT (Anglo- Scandinavian Cardiac Outcomes Trial) [13], Lancet 2003; CARDS (Collaborative Atorvastatin Diabetes Study) [14], Lancet 2004; TNT (Treating to New Targets) [16], NEJM 2005 and IDEAL (Incremental Decrease in Endpoints Through Aggressive Lipid Lowering) [17], JAMA 2005. All these studies were funded by Pfizer, the maker of Lipitor (atorvastatin) (Table 1).
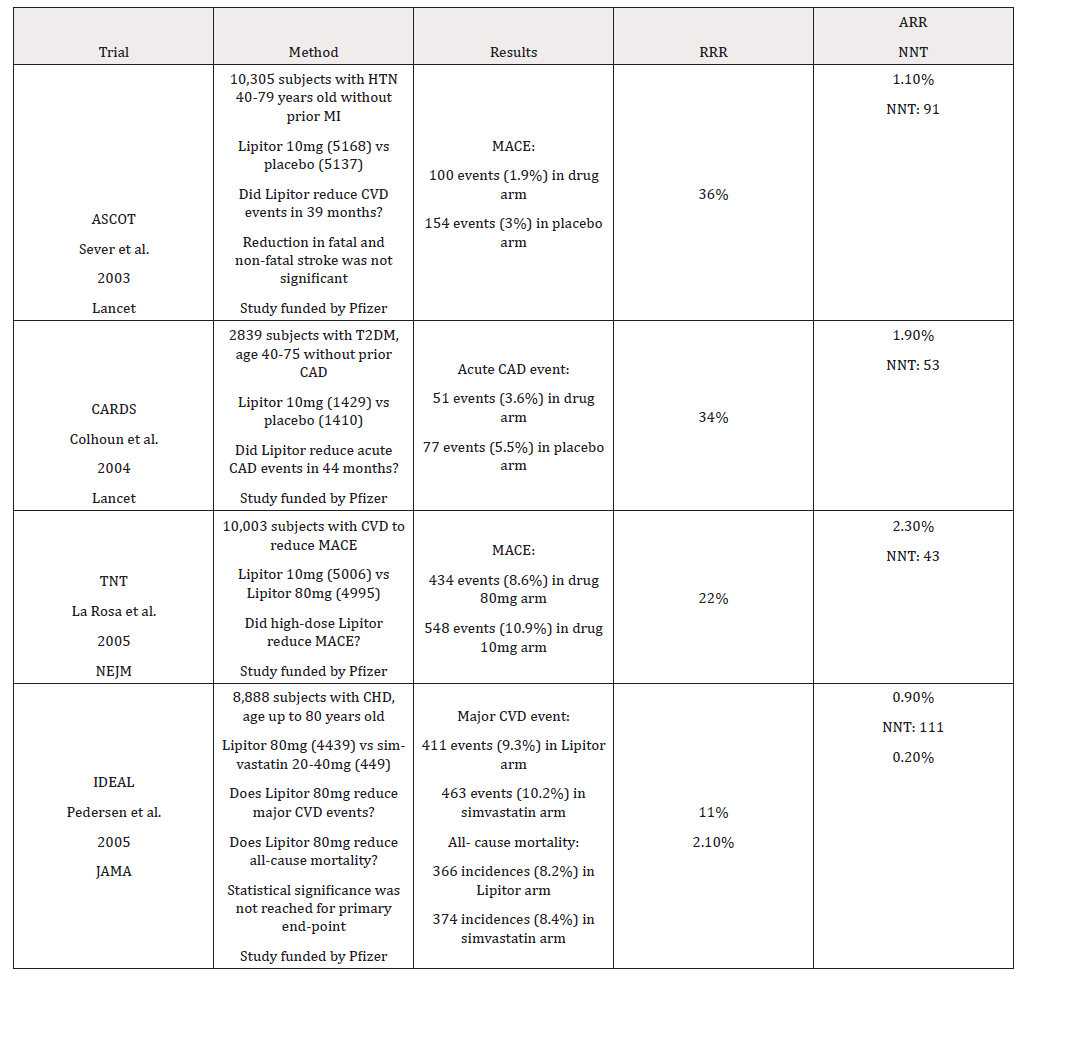
Table 1:Comparison of original atorvastatin (Lipitor) trials.
Note*: RRR: Relative Risk Reduction; ARR: Absolute Risk Reduction; ASCOT: Anglo-Scandinavian Cardiac Outcomes Trial; CARDS: Collaborative Atorvastatin Diabetes Study; TNT: Treating to New Targets; IDEAL: Incremental Decrease in Endpoints Through Aggressive Lipid Lowering; HTN: Hypertension; CVD: Cardiovascular Disease; T2DM: Type 2 Diabetes; MACE: Major Cardiovascular Event (MI – Myocardial Infarction, acute CHD death, unstable angina, coronary revascularization or stroke); CHD: Coronary Heart Disease; NNT: Number Needed to Treat.
Lipitor entered the American medical world in 1997. Since then, several studies were released touting its prowess as a drug to prevent ischemic Coronary Artery Disease (CAD). The RRR from the ASCOT trial was “36% lower incidence of CAD in study participants”, however the ARR was only 1.1% [13]. As you can see, the other studies had similar dismal results. The studies reported in their conclusions “Reductions in MACE are large”, and “Provides significant benefit”. You look at the data and determine if you agree. Only one study, IDEAL, reported, “Intense LDL lowering did not result in significant reduction in primary outcome of MACE” [17].
Atorvastatin, first on the market in 1992, is still the most prescribed medication globally as of 2024. Do not misunderstand: the study results are not to say that there is no place for atorvastatin. Since most studies are done with subjects that have some level of cardiovascular disease, it may be interpreted to be more beneficial for people with established CAD. However, using Lipitor for primary prevention of cardiovascular disease never seemed to reach a high level of clinical significance [15]. Chou et al looked at 26 studies of using statins for the primary prevention of cardiovascular disease to inform the USPSTF (and their guidelines) and published NNTs like 78, 118, 169, 286, 256 and 769 [18].
Is it important to question whether the results of statin studies are not as robust as most healthcare providers have been led to believe. Please note the high NNT for all the atorvastatin trials and the dismal ARR, however most practitioners were proudly told of the RRR of 36% to lower cardiovascular events [16]. However, without really understanding the data or knowing what questions to ask, we are all misled that the drug is highly effective at prevention coronary artery disease. And if you think there may be some bias, all four of these studies were funded by Pfizer, the makers of Lipitor.
In recent years, there have been more similar pharmaceutical industry funded studies conducted. In Table 2, you will see a comparison chart of 5 major studies that have similar questionable findings. These studies looked at commonly prescribed drugs to modify cardiovascular risk in the U.S. today. In these large-scale studies, one can see that the RRRs have been underwhelming at best. For the REDUCE-IT trial [19], looking at Icosapent 2gms BID vs placebo did have a decent ARR of 4.8% with a NNT of 21. Remember that the most robust results will have a NNT of 10-15. The results of REDUCE-IT were not bad compared to the others. Looking at the rest of these large studies trying to identify medications that modify the risk of cardiovascular disease fell flat with dismal ARR and NNT values. Please note that the PROMINENT [20] study had the same number of cardiovascular deaths in both the drug and placebo arm. There was so little difference in Major Cardiovascular Events (MACE) that the RRR was insignificant (Table 2).
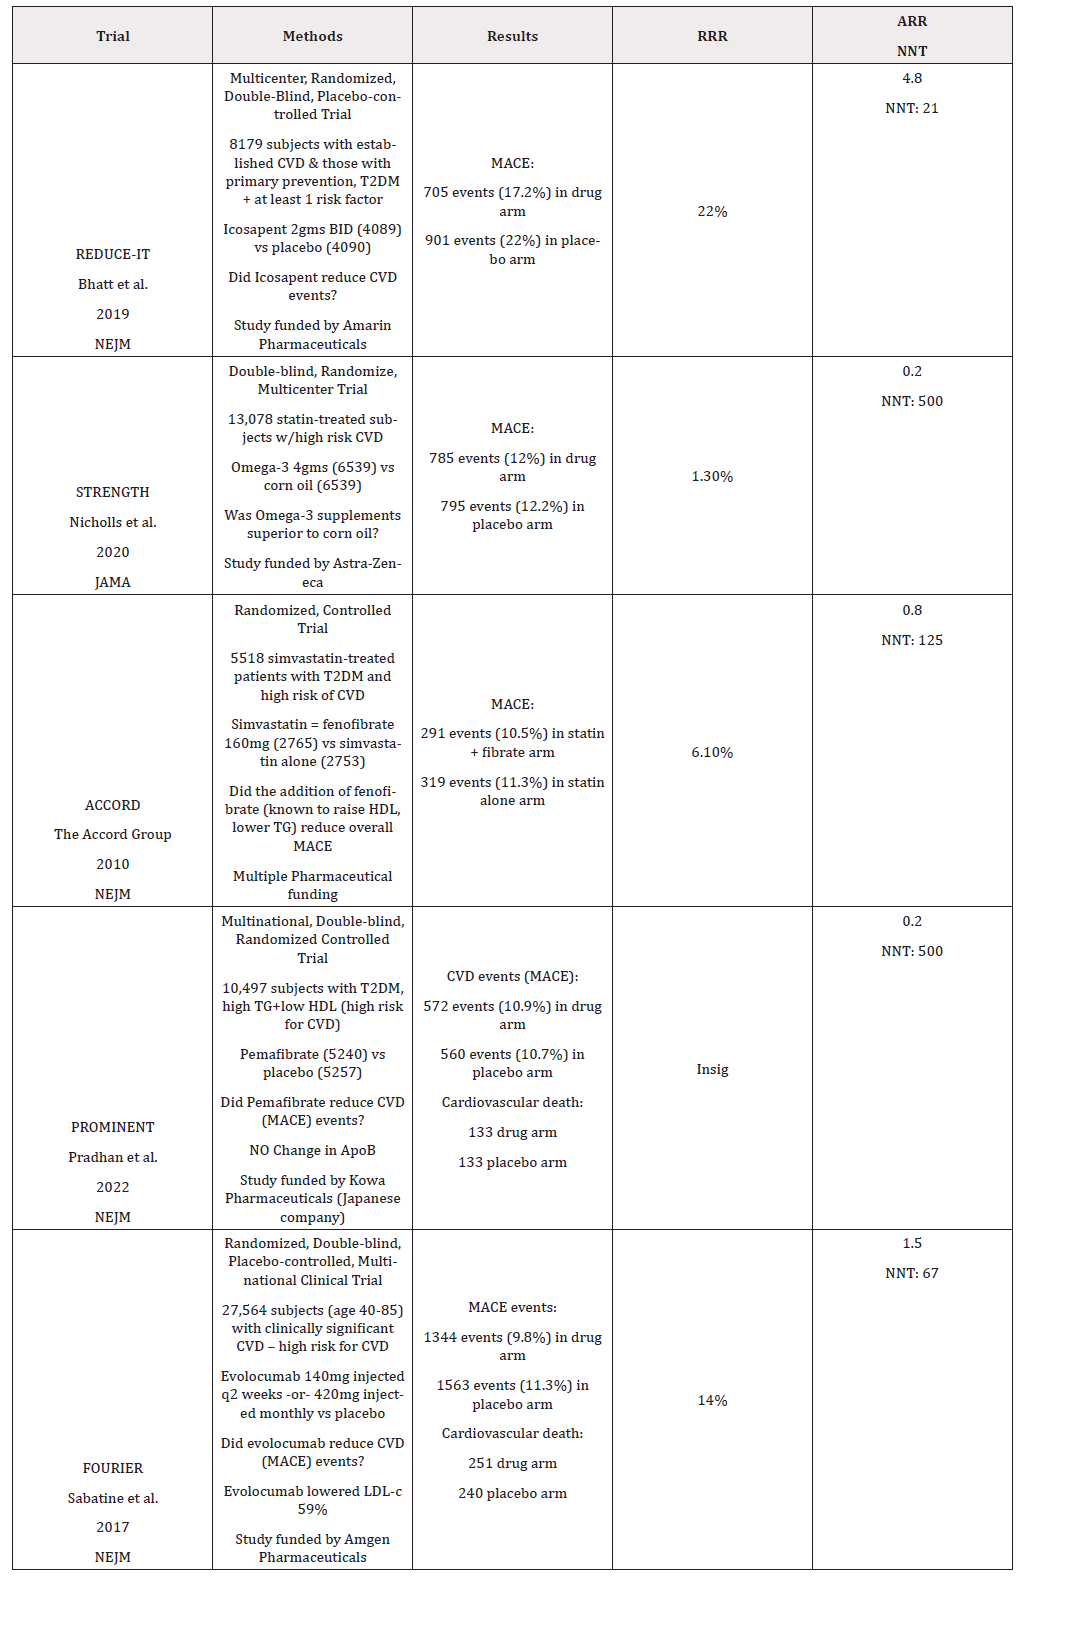
Table 2:Comparison Chart: Studies of Drugs that Modify CVD Risk.
Note*: RRR: Relative Risk Reduction; ARR: Absolute Risk Reduction; MACE: Major Adverse Cardiovascular Events; T2DM: Type 2 Diabetes Mellitus; TG: Triglycerides; HDL: High Density Lipoprotein; CVD: Cardiovascular Disease; REDUCE-IT: Cardiovascular Risk Reduction with Icosapent Ethyl for Hypertriglyceridemia; STRENGTH: Effect of High-Dose Omega-3 Fatty Acids vs Corn Oil on Major Adverse Cardiovascular Events in Patients at High Cardiovascular risk; ACCORD: Effects of Combination Lipid Therapy in Type 2 Diabetes Mellitus; PROMINENT: Triglyceride Lowering with Pemafibrate to Reduce Cardiovascular Risk; FOURIER: Evolocumab and Clinical Outcomes in Patients with Cardiovascular Disease; Insig: Results were insignificant.
The FOURIER study [21], looking at evolocumab (an aggressive LDL-c lowering injectable medication), compared to placebo has RRR of only 14%, ARR of 1.5 and NNT of 67 [22]. This means this drug fails 98.5% of people who use it regularly. An interesting fact is that more people died from the drug arm than the placebo arm in that study. To know that this drug lowered LDL 59%, you may say - to what end? And there was exactly the same amount of adverse drug events (77.4%) reported in both the drug arm and the placebo arm. Another case to question “What is in that placebo?” All the studies in Table 2 was looking to see if the drug vs placebo or 2 drugs vs 1 drug reduce MACE. Other than REDUCE-IT and based on what you have extracted from the data, do you agree that the answer is no?
In Conclusion
In this article, you can see the data from several very celebrated studies, many published in the New England Journal of Medicine (a high-impact journal) so the reader can better understand the studies from which our professional organizations have based their guidelines and recommendations. Do not think that the information in this article is designed to stop drugs from being prescribed. Certainly not. But every single healthcare provider needs to understand not only how and when to use drugs, but what outcomes they hope they will provide to their patients.
Acknowledgement
None.
Conflict of Interest
None.
References
- Balon R, Louie AK, Morreale MK, Andreea L Seritan, Anthony P S Guerrero, et al. (2024) Fraud: A Growing Threat to Academia’s Credibility. Acad Psychiatry 48(6): 563-567.
- Mertkan S, Onurkan Aliusta G, Suphi N (2021) Profile of authors publishing in ‘predatory’ journals and causal factors behind their decision: A systematic review. Res Eval rvab032.
- Steen RG (2011) Retractions in the scientific literature: is the incidence of research fraud increasing? J Med Ethics 37(4): 249-253.
- Wilson P (2020) Academic Fraud: Solving the Crisis in Modern Academia. Exch Interdiscip Res J 7(3): 14-44.
- Sanders LM, Allen JC, Blankenship J, Eric A Decker, Mary Christ Erwin, et al. (2021) Implementing the 2020–2025 Dietary Guidelines for Americans: Recommendations for a path forward. J Food Sci 86(12): 5087-5099.
- Klabunde CN, Ellis EM, Villani J, Elizabeth Neilson, Kat Schwartz,et al. (2022) Characteristics of Scientific Evidence Informing Changed U.S. Preventive Services Task Force Insufficient Evidence Statements. Am J Prev Med 62(2): e77-e86.
- Foggin H, Hutcheon JA, Liauw J (2022) Making sense of harms and benefits: Assessing the numeric presentation of risk information in ACOG obstetrical clinical practice guidelines. Patient Educ Couns 105(5): 1216-1223.
- De Moel Mandel C (2023) Understanding and communicating epidemiological measures of risk and benefit. Fam Pract. 40(2): 423-425.
- Monaghan TF, Rahman SN, Agudelo CW, Alan J Wein, Jason M Lazar, et al. (2021) Foundational Statistical Principles in Medical Research: A Tutorial on Odds Ratios, Relative Risk, Absolute Risk, and Number Needed to Treat. Int J Environ Res Public Health 18(11): 5669.
- P Cleary, O Crofford, M Davis, L Rand, C Siebert, et al. (1993) The Effect of Intensive Treatment of Diabetes on the Development and Progression of Long-Term Complications in Insulin-Dependent Diabetes Mellitus. N Engl J Med 329(14): 977-986.
- Anker SD, Butler J, Filippatos G, João P Ferreira, Edimar Bocchi, et al. (2021) Empagliflozin in Heart Failure with a Preserved Ejection Fraction. N Engl J Med 385(16): 1451-1461.
- Byrne P, Demasi M, Jones M, Smith SM, O Brien KK, et al. (2022) Evaluating the Association Between Low-Density Lipoprotein Cholesterol Reduction and Relative and Absolute Effects of Statin Treatment: A Systematic Review and Meta-analysis. JAMA Intern Med 182(5): 474.
- Sever PS, Dahlöf B, Poulter NR, Hans Wedel, Gareth Beevers, et al. (2003) Prevention of coronary and stroke events with atorvastatin in hypertensive patients who have average or lower-than-average cholesterol concentrations, in the Anglo-Scandinavian Cardiac Outcomes Trial—Lipid Lowering Arm (ASCOT-LLA): a multicentre randomised controlled trial. The Lancet. 361(9364): 1149-1158.
- Colhoun HM, Betteridge DJ, Durrington PN, Graham A Hitman, H Andrew W Neil, et al. (2004) Primary prevention of cardiovascular disease with atorvastatin in type 2 diabetes in the Collaborative Atorvastatin Diabetes Study (CARDS): multicentre randomised placebo-controlled trial. The Lancet 364(9435): 685-696.
- Waters DD, Guyton JR, Herrington DM, McGowan MP, Wenger NK, et al. (2004) TNT Steering Committee Members and Investigators. Treating to New Targets (TNT) Study: does lowering low-density lipoprotein cholesterol levels below currently recommended guidelines yield incremental clinical benefit? Am J Cardiol 93(2): 154-158.
- LaRosa JC, Grundy SM, Waters DD, Charles Shear, Philip Barter, et al. (2005) Intensive Lipid Lowering with Atorvastatin in Patients with Stable Coronary Disease. N Engl J Med 352(14):1425-1435.
- Pedersen TR, Faergeman O, Kastelein JJP, Anders G Olsson, Matti J Tikkanen, et al. (2005) High-Dose Atorvastatin vs Usual-Dose Simvastatin for Secondary Prevention After Myocardial InfarctionThe IDEAL Study: A Randomized Controlled Trial. JAMA 294(19): 2437-2445.
- Chou R, Cantor A, Dana T, Jesse Wagner, Azrah Y Ahmed, et al. (2022) Statin Use for the Primary Prevention of Cardiovascular Disease in Adults: Updated Evidence Report and Systematic Review for the US Preventive Services Task Force. JAMA 328(8): 754-771.
- Bhatt DL, Steg PG, Miller M, Eliot A Brinton, Terry A Jacobson, et al. (2019) Cardiovascular Risk Reduction with Icosapent Ethyl for Hypertriglyceridemia. N Engl J Med 380(1): 11-22.
- Das Pradhan A, Glynn RJ, Fruchart JC, Jean G MacFadyen, Elaine S Zaharris, et al. (2022) Triglyceride Lowering with Pemafibrate to Reduce Cardiovascular Risk. N Engl J Med 387(21): 1923-1934.
- Sabatine MS, Giugliano RP, Keech AC, Narimon Honarpour, Stephen D Wiviott, et al. (2017) Evolocumab and Clinical Outcomes in Patients with Cardiovascular Disease. N Engl J Med 376(18): 1713-1722.




 We use cookies to ensure you get the best experience on our website.