
Research Article 
 Creative Commons, CC-BY
Temporal and Spatial Estimation of Food Security Status of Households in Nigeria
*Corresponding author:Ashagidigbi Waheed M, Department of Agricultural and Resource Economics, Federal University of Technology, Akure, Nigeria.
Received:August 01, 2025; Published:August 08, 2025
DOI: 10.34297/AJBSR.2025.28.003636
Abstract
Food insecurity has been a global challenge, especially among households in Sub-Saharan Africa. However, empirical evidence of spatial and temporal analysis of the pandemic is scarce. The study examines food security status among households across two periods, two sectors, and six geopolitical zones in Nigeria. The data used were obtained from the Nigerian General Household Survey (GHS), which consists of two waves: 2012/2013 (Wave 2) and 2015-2016 (Wave 3), respectively. Descriptive statistics, Dietary Diversity Score, and Ordered Probit Model were the analytical techniques adopted. Food consumption patterns of households reveal consistent reliance on staples such as cereals, vegetables, and fats/oils, while consumption of fruits (47.84%) and animal proteins like eggs (9.97%) and fish (58.52%) was less prevalent. There is a relative improvement in households’ dietary diversity in Wave 3(8.32) relative to Wave 2(7.09), with urban households exhibiting a higher diversity score in comparison with rural households. Additionally, the temporal analysis of food security transition revealed that 24.01% of households were persistently food insecure in both waves. Spatial analysis revealed that residents in the northwest zone and rural sector experience greater persistence of food insecurity. The study highlights critical disparities in food security transitions across sectors and zones, emphasizing the need for targeted food policies to improve nutritional outcomes of vulnerable populations (SDG2).
Keywords:Food insecurity transitions, Dietary diversity, Nutrition, Food consumption, Staples, Animal proteins
Introduction
Food security should be treated as national security, and any nation that’s not capable of feeding her people can be regarded as an irresponsible nation. Besides, in recent findings, over 4million people go hungry and suffer from malnutrition in Nigeria (FAO, 2021). Previously, Nigeria was a major agricultural exporter not until Nigeria embarks on offshore oil drilling in 1960s, however, as Nigeria developed into the world’s thirteenth largest oil producing country (World fact book, 2016), its plantation and farms were neglected and presently, about 90% of Nigeria’s agricultural output comes from inefficient small scale subsistence farms, who have little or no access to modern inputs. Given the current and future needs of the human population and the finite resources our planet can provide, we will need to transition from the current unsustainable food system to a healthy, circular, and resource-efficient paradigm. These transitions will be hugely complex, since the multiple aspects of food production and consumption are closely interconnected, and changing one aspect can easily have major unintended consequences. Yet the transitions are urgent and must be driven by science as well as values [1].
According to the latest FAO report, nearly one-third of people (2.37 billion) did not have access to adequate food in 2020. While the global prevalence of food insecurity has been steadily rising since 2014, the estimated increase in 2020 was equal to that of the previous five years combined. Between 2018 and 2020, on average, 21.4 percent of the population in Nigeria experienced hunger. People in severe food insecurity would go for entire days without food, due lack of financial and productive resources. In the past years, the prevalence of severe food insecurity among the Nigerian population has been increasing, as the demand for food is rising together with a very fast-growing population. Global food security is likely to remain a problem worldwide for many years if the world cannot formulate methods to control the situation [2]. Food security remains one of the most important concerns among households in Nigeria. Despite significant food security development in Nigeria, food insecurity and extremely rural poverty has continued to pose major socio-economic problems to many households in Nigeria to date. The transition rate of food-poor households to self-reliance of food supplies has largely remained low [3]. Transitory food insecurity can lead to chronic food insecurity when a population has a long-term inability to acquire sufficient food. However, understanding the spatial and temporal spread of food insecurity is crucial in offering a sustainable and inclusive measure in tackling the scourge. This study examines the socioeconomic characteristics, dietary patterns, food security transitions, and on this note, the core determinants of food security among households in Nigeria across two waves of data collection.
Methodology
The Study area is Nigeria. Officially, the Federal Republic of Nigeria is a country in West Africa. It is the most populous country in Africa. It is geographically situated between the Sahel to the north and the Gulf of Guinea to the south in the Atlantic Ocean. It covers an area of 923,769 square kilometers (356,669sq mi), with a population of over 211 million. Nigeria borders Niger in the north, Chad in the northeast, Cameroon in the east, and Benin in the west. Nigeria is a federal republic comprising 36 states and the Federal Capital Territory, where the capital, Abuja, is located. The data used were obtained from (secondary source, the Nigerian General Household Survey (GHS), which was implemented in collaboration with the World Bank Living Standards Measurement Study (LSMS) team as part of the Integrated Surveys on Agriculture (ISA) program and was revised to include a panel component (GHS-Panel). Since 2010, the GHS has been a nationally representative survey of 5,000 households, which are also representative of the six geopolitical zones at both rural and urban levels. The households included in the GHS-Panel are a sub-sample of the overall GHS sample households. The data sets used are from the second and third waves of the GHS-Panel, which was implemented in 2012/2013 (Wave 2) and 2015-2016 (Wave 3), respectively.
Descriptive statistics such as frequency, percentages, and mean were used to describe the selected socio-economic characteristics of the respondents and the various food groups consumed by households within a seven-day period in both waves. These food groups are cereal, roots and tubers, legume/nuts, meat, fish, and egg. Others include fruits, vegetables, fats and oils; milk, confectioneries, and spice/condiments/beverages [4]. Dietary Diversity Score (DDS) was adopted to determine the food (in) security status and food security transitions among the households in Nigeria [5,6].DDS was estimated by summing the number of different food items/ groups consumed by each household for a period of seven days [7]. Any household that consumes less than eight (66.67%) of the twelve selected food items/groups is considered to be food insecure [2,8,6] in one or both waves. Consequently, four food security outcomes were generated from the two, and these are;
1) SEC2SEC3: households that are food secure in both waves
2) INSEC2SEC3: households that are food insecure in wave 2 and
food secure in wave 3
3) SEC2INSEC3: households that are food secure in wave 2 and
food insecure in wave 3
4) INSEC2INSEC3: households that are food insecure in both
waves
Ordered Probit Model
An ordered probit model will be adopted to examine the determinants of food security transitions in Nigeria following the study conducted by [9,10]. The ordering of the probabilities of the four food security outcomes from the least desirable to the most desirable outcomes is as stated:
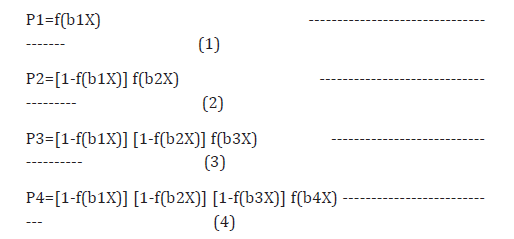
Where,
P1=Probability of households being food insecure in both
waves (INSEC2INSEC3)
P2=Probability of households being food secure in wave 2 and
food insecure in wave 3 (SEC2INSEC3)
P3=Probability of households being food insecure in wave 2
and food secure in wave 3 (INSEC2SEC3)
P4=Probability of households being food secure in both waves
(SEC2SEC3):
The explanatory variables (Xi) are:
X1=Respondents’ age (years)
X2=Household head’s gender (male=1; female=0)
X3=Household size
X4=household income (₦)
Sector
X5= (Rural=1, urban=0)
Zones<
X6=North central
X7=Northeast
X8=Northwest
X9=South east
X10=South-south
X11=South west
Results and Discussion
In Table 1, the data from Wave 2 and Wave 3 of the survey revealed the households’ socioeconomic status. The discussion of the socioeconomic characteristics of the households in Nigeria in Wave 2 and Wave 3 aligns with existing research on demographic and economic changes among Nigerian households [11,12]. The mean age of the respondents is approximately 43 years in Wave 2. This increases to 46 years in Wave 3, affirming that the majority of households in Nigeria are in their industrious age. The majority of household members fall within the 18-49 age group, accounting for 73.7% in Wave 2 and reducing slightly to 68.14% in Wave 3. The increase in the proportion of individuals aged 50-65 years (19.24% to 24.01%) suggests ageing trends within households. This trend is consistent with previous studies that highlight the gradual ageing of Nigerian households, driven by improved life expectancy and declining birth rates [13].
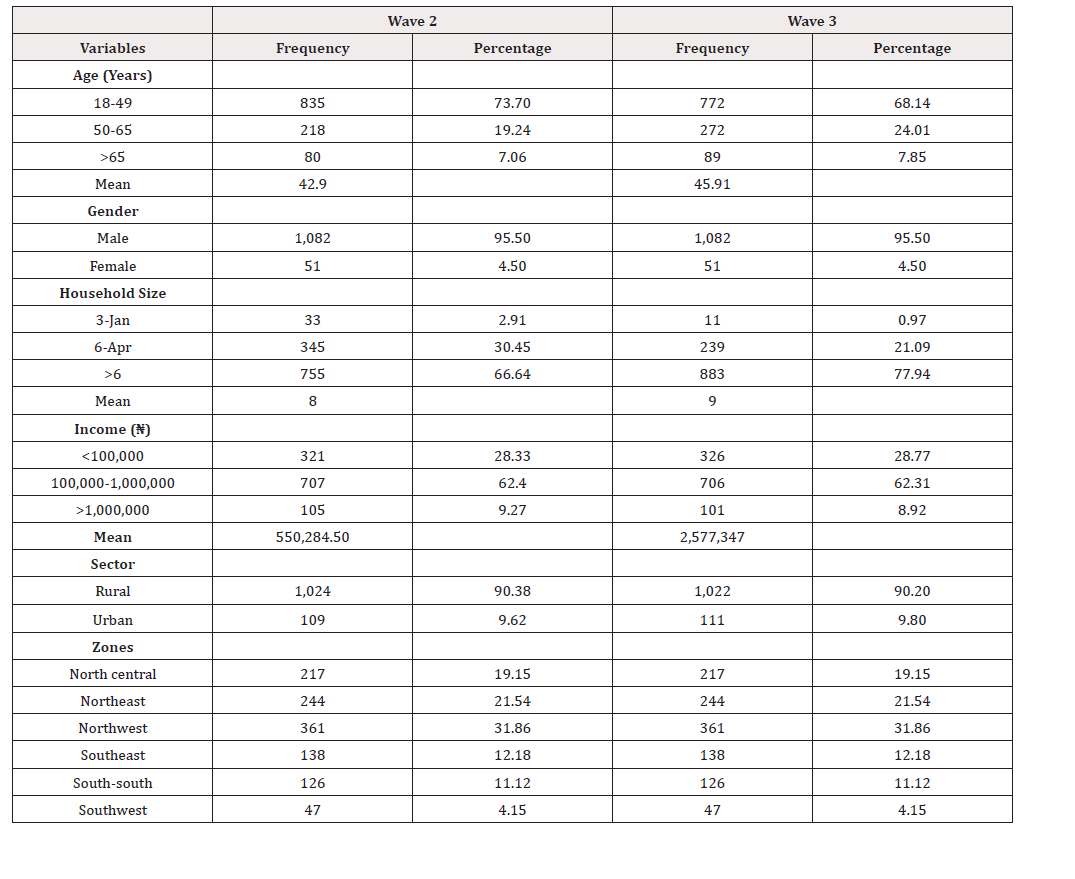
Table 1:Socioeconomic Characteristics of Households in Nigeria.
The gender of households remains predominantly male-headed (95.5%) across both waves, highlighting potential gender disparities in household leadership. Studies indicate that male household dominance is linked to socio-cultural norms, financial resource control, and decision-making authority within Nigerian families [14]. The household size indicates that households with more than six (6) members increased from 66.64% in Wave 2 to 77.94% in Wave 3. The mean household size rose from 8 to 9, emphasizing the growing size of Nigerian households. This is reflective of traditional extended family structures and the economic need for labor sharing within households, as found in prior research [12]. The households within the income range of ₦100,000–₦1,000,000 constitute over 62% in both waves. Mean income rose sharply from ₦550,284.5 in Wave 2 to ₦2,577,347 in Wave 3, which suggests economic shifts or inflationary effects. The sharp increase in income levels may be influenced by inflation, government policy changes, and the adoption of new economic strategies within households, as noted by previous studies [11]. Most households reside in rural areas (90.38% in Wave 2 and 90.2% in Wave 3). Regionally, the Northwest (over 31%) has the highest household representation, while the Southwest has the lowest (4.15%). These findings are consistent with prior research, which indicates that the Northwest remains the most populated rural region due to agricultural dominance and historical settlement patterns [15]. The socioeconomic characteristics outlined above align with broader trends in Nigerian households, confirming demographic shifts, income growth, and regional disparities over time. These findings support existing literature on the evolving socioeconomic landscape of Nigerian families.
In Table 2, the food consumption patterns highlight variations in dietary habits and food availability. Cereals are the most consumed food group, with a slight increase in consumption from 97.26% (Wave 2) to 99.38% (Wave 3). This aligns with findings indicating cereals remain the primary staple in Nigerian diets due to affordability and availability [16,17]. Roots and tubers also show a steady increase in consumption (71.58% to 74.76%). This trend reflects increased reliance on cassava and yam as staple foods, consistent with previous studies on shifting consumption habits in Nigeria [18]. Vegetable consumption remains high, increasing slightly to 97.79% in Wave 3. The increase in vegetable intake aligns with research emphasizing greater awareness of nutritional benefits and improved access to fresh produce [19]. Fruit consumption almost doubled between the waves, from 26.48% to 47.84%, reflecting improved access or awareness. This significant increase is supported by studies indicating a rising trend in fruit intake due to health consciousness and government agricultural policies promoting fruit production [17].
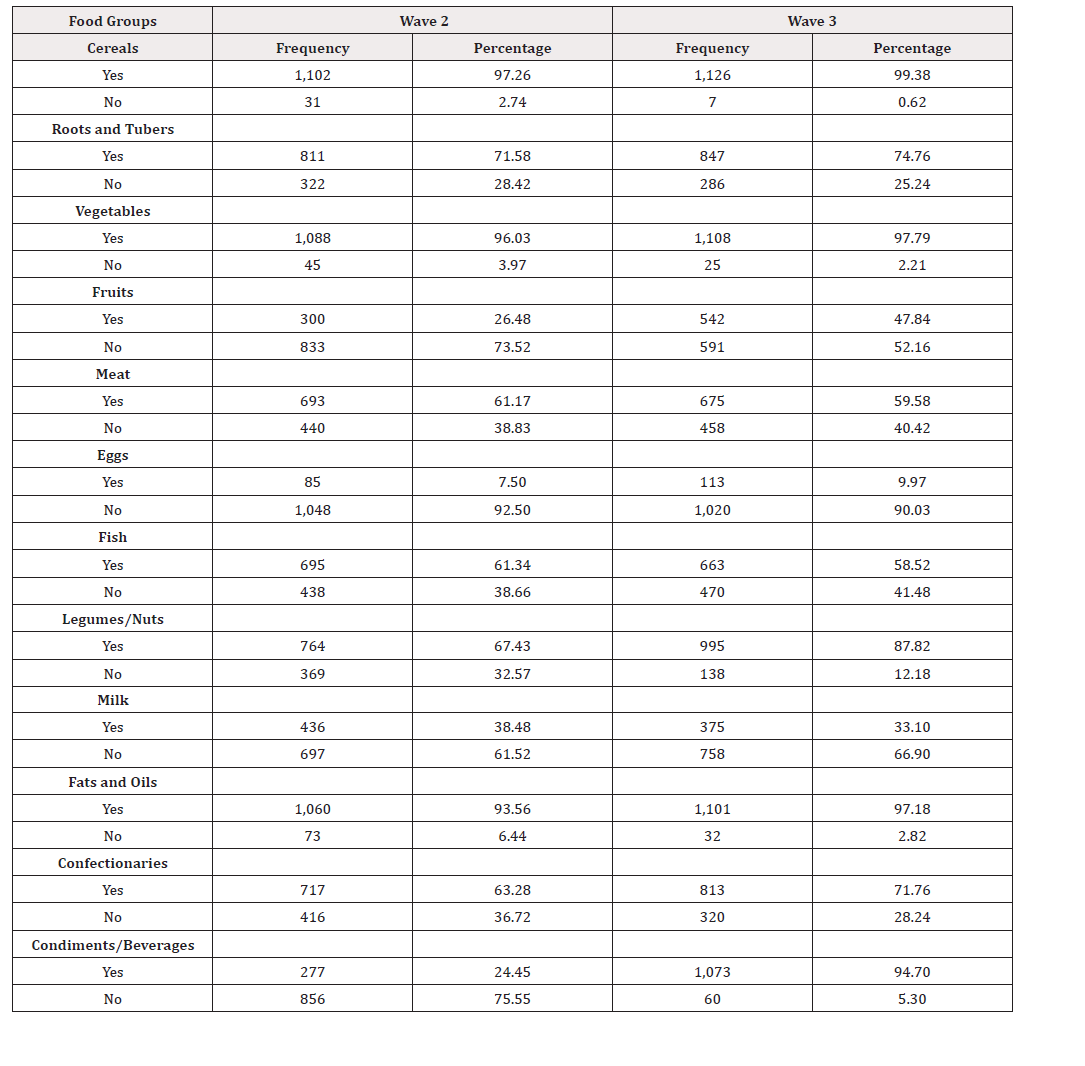
Table 2:Food Consumption of Households in Nigeria.
Meat and fish consumption decreased slightly, with Wave 3 values reducing to 59.58% and 58.52%, respectively. The decline may be linked to price fluctuations and supply constraints, as prior studies suggest economic challenges impact protein consumption [20]. Egg consumption, though low, rose from 7.5% to 9.97%. This increase aligns with broader dietary shifts, where households incorporate more animal protein when financial conditions improve [18]. A remarkable increase in the consumption of condiments and beverages is observed, rising from 24.45% to 94.7%. This dramatic rise is consistent with findings that highlight changing consumer preferences toward processed and convenience foods [19]. The food consumption patterns presented in Table 2 reflect evolving dietary habits in Nigeria, influenced by economic, cultural, and policy-driven factors. These findings align with research indicating changes in food availability, affordability, and nutritional awareness.
Table 3 indicates that dietary diversity reflects the variety of food groups consumed, which is an essential indicator of households’ nourishment. The mean dietary diversity score increased from 7.09 in Wave 2 to 8.32 in Wave 3, showing improved dietary variety. This trend aligns with studies that emphasize the increasing diversification of diets in Nigeria due to urbanization and economic changes [21]. Urban households consistently demonstrate higher scores (9.06 in Wave 3) compared to rural households (8.24), reflecting urban advantages in food access. Previous research supports this finding, indicating that urban households have better access to diverse foods due to infrastructure, supermarkets, and higher disposable incomes [22,6]. The Southeast and South-South zones exhibit the highest scores (9.78 and 9.59, respectively, in Wave 3), indicating better food access and consumption diversity. This is consistent with studies that identify these regions as having more developed food markets and higher agricultural productivity [15]. Conversely, the Northeast and Northwest lag, with scores of 7.79 and 7.68 in Wave 3. These lower scores reflect persistent food insecurity and economic challenges in these regions, as documented in prior research on food access disparities in Nigeria [19]. The increase in dietary diversity scores suggests gradual improvements in food security and nutrition across Nigeria, though regional and urban-rural disparities persist. These findings align with research that highlights the role of socioeconomic factors in shaping food consumption patterns in Nigeria.
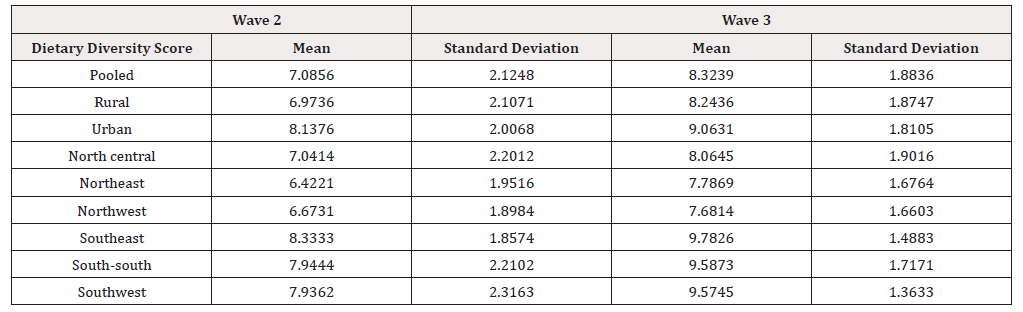
Table 3:Households’ Dietary Diversity Score across the Two Waves.
In Table 4, food security transitions assess households’ movement between food security and insecurity situations within the two periods considered. In Nigeria, about 33.45% of households persistently maintained their food security status (SEC2SEC3), while rural households (31.7%) trailed urban households (49.55%). Urban households show better resilience, with fewer transitions to food insecurity (SEC2INSEC3: 4.5%) compared to rural households (8.61%). Studies indicate that urban households generally have more stable access to food due to better infrastructure and economic opportunities [17].

Table 4:Food Security Transitions of Households across Sectors in Nigeria.
Note*: SEC2SEC3-Food secure in both waves; INSEC2SEC3-Food insecure in wave 2 but food secure in wave 3; SEC2INSEC3-Food secure in wave 2, but food insecure in wave 3; INSEC2INSEC3-Food insecure in both waves.
However, the regional transitions in Table 5 indicate that the Southeast demonstrates the highest food security retention (63.04% SEC2SEC3) and the lowest food insecurity persistence (4.35% INSEC2INSEC3). Conversely, the Northwest has the highest proportion of persistently food insecure households (35.73% INSEC2INSEC3). This aligns with research highlighting that food security challenges in Northern Nigeria stem from climate shocks, economic instability, and conflict [23].

Table 5:Food Security Transitions of Households across Zones in Nigeria.
In Table 6, key factors influencing food security transitions include gender, household size, zonal effects, and the rural-urban divide.
The likelihood of male-headed households to retain their food security status reduced by 0.1234, while it increased by 0.0999 for the household to be perpetually food insecure. This indicates that female-headed households are more likely to be food secure in both waves than their male counterpart is. This pattern suggests that female-headed households are likely to adopt more adaptive food security strategies, as found in prior research [24]. An additional member to a household increased households’ probability of maintaining food security status in both waves by 0.0202, while it reduced their food insecurity persistence by 0.0164, respectively. This affirms that households with more members tend to be more food secure in both waves. Households, most especially in rural areas, tend to engage their wards in productive enterprises at zero cost, thereby boosting their income level and ultimately their food security status [6]. The likelihood of households in the northcentral, southeast, south-south and southwest zones to retain their food security status increased by 0.0809, 0.4892, 0.3534 and 0.4301 respectively, relative to the northeast residents, while it reduced their probability of being food insecure in both waves by 0.0601, 0.2347, 0.1893 and 0.1954 respectively, relative to the base category. Households in the southern divide and northcentral zone tend to be more persistently food secure than those resident in the northeast zone of the country. This observation aligns with studies indicating that these regions benefit from stronger agricultural systems and economic stability [17]. Conversely, northeast residents tend to be perpetually in food insecurity situations relative to other zones, thereby necessitating a zone-focused food policy measure directed at households in the deprived zone [25].
The likelihood of rural residents to retain their food security status (SEC2SEC3) reduced by 0.1411, while their probability of perpetually maintaining food insecurity states increased by 0.0946, respectively. The finding illustrates that rural residents tend to be persistently food insecure in comparison to urban residents. Rural households’ likelihood to transition to food insecurity (SEC2INSEC3) increased by 0.0235, while their likelihood to remain persistently food insecure (INSEC2INSEC3) increased by 0.0946, compared to urban households. This is consistent with research showing that rural areas face greater vulnerability due to limited access to markets, poor infrastructure, and lower incomes [23,6]. These findings highlight the complex interplay between socio-economic factors and food security transition in Nigeria, emphasizing the need for targeted policy interventions to improve food access and stability across rural divide of the country (Table 6).
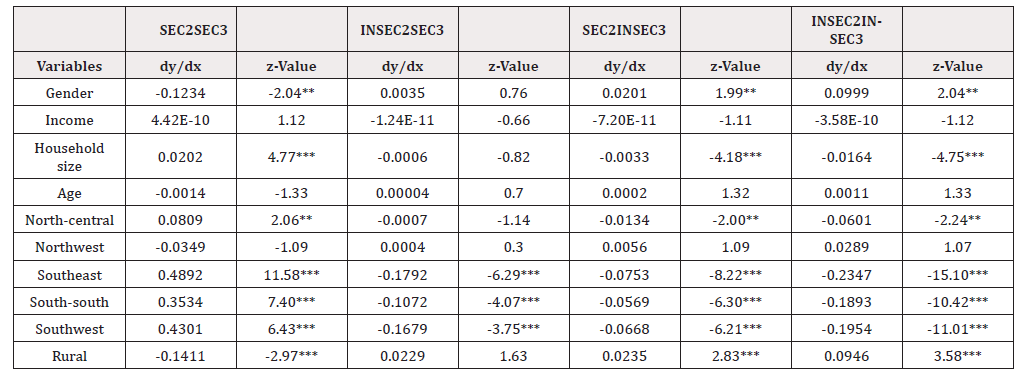
Table 6:Determinants of Food Security Transition among Households in Nigeria.
Note:< *, **, *** represent level of significance at 10%, 5% and 10% respectively Prob>chi2=0.0000 Log likelihood= -1345.8675
Conclusively, there is clear evidence that food insecurity status and retention are rural issues in Nigeria. Additionally, Residents in the northern divide of the country suffer more food deprivation and food insecurity persistence than those in the south. The analysis underscores the critical role of socioeconomic factors, geographic disparities, and household characteristics in shaping dietary diversity and food security transitions in Nigeria. The issue of household food security transition in Nigeria is complex and requires a thorough understanding of the factors that contribute to food insecurity. Effective food security policy measures (such as food banks) that can cushion the temporal effect of food shortage should prioritize rural areas and the northern divide, where high prevalence of food insecurity and food insecurity transition persists, while promoting balanced dietary diversity nationwide to achieve Sustainable Development Goal (SDG)2 [26,27].
Acknowledgements
None.
Conflict of Interest
None.
References
- Kampers FWH, Fresco LO (2017) Food transitions 2030: How to achieve the transitions to a sustainable, affordable, trustworthy and high-quality food system in the next decade or two that will fulfill the needs of a diverse and growing world population. Wageningen University & Research.
- Asige ML, Gladys CR (2021) Influence of land use patterns on food security in Narok East sub-county, Narok County, Kenya. International Journal of Multidisciplinary Research and Development 8(4): 129-143.
- Gwada RO, Ouko KO, Mayaka ZO, Dembele B (2020) Determinants of food security among small-scale soybean households in Butere Sub-County, Kenya. Journal of Contemporary Agriculture 69(3-4): 90-101.
- Kennedy ET, Ohls F, Carlson S, Fleming K (1995) The healthy eating index: design and applications. J Am Diet Assoc 95: 1103-1108.
- Kennedy G, Ballard T, Dop MC (2011) Guidelines for measuring household and individual dietary diversity. FAO, Rome, Italy.
- Ashagidigbi Waheed Mobolaji, Orilua Olajumoke Oluwatoyosi, Olagunju Kehinde Oluseyi, Omotayo Abiodun Olusola (2022) Gender, Empowerment and Food Security Status of Households in Nigeria. Agriculture 12(7): 1-13.
- (2007) FAO/Nutrition and Consumer Protection Division. FAO. Italy Rome.
- Yayuk FB, Dodik B, Vitria M (2015) Validation of Household Dietary Diversity Score (HDDS) to identify food insecure households in an industrial area. Pak J Nutr 14(4): 234-238.
- Lawson D, McKay A, Okidi J (2006) Poverty persistence and transitions in Uganda: A combined qualitative and quantitative analysis. J Dev Stud 42: 1225-1251.
- Ashagidigbi Waheed Mobolaji, Tinuola Mariam Ishola, Abiodun Olusola Omotayo (2022b) Gender and occupation of household head as major determinants of malnutrition among children in Nigeria. Scientific African 16: e01159.
- Dan, EA, Oladejo BF, Ekong VE (2023) A model for predicting food insecurity in Nigeria using a deep learning technique. Egyptian Computer Science Journal 47(1): 1-11.
- Adepoju A, Yusuf S (2011) Vulnerability profile of rural households in South West Nigeria. Journal of Agricultural Science 3(1): 128-139.
- Uzodigwe AA, Obi KO, Ezenekwe UR (2024) Poverty dynamics and durations in Nigeria: Evidence from the general household survey. Nigeria Journal of Energy and Environmental Economics 15(1): 41-64.
- Ibrahim SS, Aliero HM (2020) Testing the impact of financial inclusion on income convergence: Empirical evidence from Nigeria. African Development Review 32(1): 42-54.
- Ogunniyi A, Mavrotas G, Olagunju K, Rufai M, Oyeyemi M (2021) Urbanization, livestock ownership, food security, and child nutritional outcomes in Nigeria: Linkages and pathways. Taylor & Francis.
- Ashagidigbi WM Yusuf SA, Okoruwa VO (2012) Determinants of households’ food demand in Nigeria. World Rural Obs 4(4): 17-28.
- Kolawole CO (2023) Consumption expenditure patterns and food security dynamics in Nigeria. International Journal of Advanced Multidisciplinary Research and Studies 4(3): 1358-1366.
- Chiaka JC, Zhen L, Xiao Y (2022) Changing food consumption patterns and land requirements for food in the six geopolitical zones in Nigeria. Foods 11(2): 150.
- Mekonnen DA, Trijsburg L, Achterbosch T (2021) Food consumption patterns, nutrient adequacy, and the food systems in Nigeria. Agricultural and Food Economics 9(16): 1-21.
- Amare M, Abay KA, Tiberti L, Chamberlin J (2021) COVID-19 and food security: Panel data evidence from Nigeria. Food Policy 101: 102099.
- Talsma EF, Trijsbur LE, Pastori G, Mekonnen DA, Trinh HT, et al. (2021) Healthy Diet Targets for Food System Transformation: A Dietary Gap Analysis, using Public Available Datasets in Ethiopia, Nigeria, Bangladesh, and Vietnam. Wageningen University and Research.
- Obayelu OA, Osho FR (2020) How diverse are the diets of low-income urban households in Nigeria? Journal of Agriculture and Food Research, 2, 100018.
- Baliki G, Brück T, Stojetz W (2018) Drivers of resilience and food security in North-East Nigeria. ISDC-International Security and Development Center.
- Omotayo AO, Omotoso AB, Daud SA (2022) Rising food prices and farming households' food insecurity during the COVID-19 pandemic. Agriculture 12(3): 363.
- Ashagidigbi WM, Yusuf S, Omonona B (2013) Households’ Food Demand and Food Security Status in Nigeria; LAP LAMBERT Academic Publishing: Sunnyvale CA USA.
- (2021) Food and Agriculture Organization of the United Nations. World Food Day.
- (2016) World Factbook. Nigeria. CIA.




 We use cookies to ensure you get the best experience on our website.