
Research Article 
 Creative Commons, CC-BY
Trends in Mortality Due to Coagulation Defects in the United States: A CDC WONDER Database Analysis (1999-2020)
*Corresponding author:Akash Kumar MBBS, Medical Research Center, Liaquat University of Medical and Health Sciences, Jamshoro, Pakistan.
Received:October 10, 2025; Published:October 15, 2025
DOI: 10.34297/AJBSR.2025.28.003728
Abstract
Background: Bleeding and clotting disorders result from abnormalities in coagulation factors, leading to excessive bleeding or thrombosis. Haemophilia
and von Willebrand disease (VWD) are the most common inherited bleeding disorders, while thrombophilia increases the risk of abnormal
clot formation.
Objective: The purpose of this study was to assess the trends and regional differences in coagulation defects-related mortality among adults in the
United States.
Methods: Death certificates from the CDC WONDER (Centers for Disease Control and Prevention Wide-Ranging OnLine Data for Epidemiologic Research)
database were examined from 1999 to 2020 for coagulation defects-related mortality in adults. Age-adjusted mortality rates (AAMRs) per
1,000,000 persons and annual percent change (APC) were calculated and stratified by year, sex, race/ethnicity, and geographic region.
Results: From 1999–2020, 283,824 adult deaths were recorded. AAMR was stable until 2018, then rose sharply to 47.5 in 2020 (APC: 9.54; 95% CI:
5.23–14.0). Males had higher AAMRs than females (46.6 vs 33). AAMRs rose in both sexes after 2018, reaching 57 (men) and 39.9 (women) in 2020.
By race, NH American Indians had the highest AAMR (60.8), followed by NH Black (50.4), Hispanic (39.9), NH White (36.9), and NH Asian/Pacific
Islander (29.6). NH American Indian AAMR rose steadily (APC: 2.26), while NH Black AAMR dropped until 2018, then surged (APC: 14.28). Rural
areas had higher AAMRs than urban (41.2 vs 38.4), with nonmetropolitan rates increasing more steeply post-2018. Regionally, the Northeast had
the lowest AAMR peak, while the South and West saw sharp increases after 2018 (APCs: 8.92 and 8.55, respectively). Disparities in mortality trends
persisted across sex, race, geography, and urbanization.
Conclusion: Coagulation defect-related mortality is rising in the U.S., especially among males, American Indians/Alaska Natives, and those in
non-metropolitan areas. These trends highlight the need for improved access to care and targeted interventions to reduce disparities.
Introduction
Bleeding and clotting disorders arise from abnormalities in coagulation factors, leading to either excessive bleeding or an increased risk of thrombosis. Among these, haemophilia and von Willebrand disease (VWD) are the most well-characterized bleeding disorders, while thrombophilia represents a group of conditions predisposing individuals to abnormal blood clot formation and ITP, is a disease with lower amount of platelets than normal which can result in easy bruising, bleeding gums, and internal bleeding.
Immune thrombocytopenic purpura (ITP) is an autoantibody- mediated thrombocytopenic disorder in which accelerated destruction of platelets occurs; platelet production may also be impaired by these antibodies [1]. Haemophilia, an X-linked recessive disorder, results from inadequate levels of factor VIII (haemophilia A) or factor IX (haemophilia B), leading to impaired blood clotting. In contrast, VWD, the most prevalent inherited bleeding disorder, arises from quantitative or qualitative defects in von Willebrand factor (VWF), a key protein in platelet adhesion and coagulation [2]. Hemophilia A (HA) is more common than hemophilia B (HB), with a prevalence of one in 5,000 male live births compared to one in 30,000, respectively. Patients with severe hemophilia frequently develop hemorrhages into joints, muscles or soft tissues without any apparent cause. They can also suffer from life-threatening bleeding episodes such as intracranial hemorrhages [3]. Interestingly, it has been reported that approximately 10 to 15% of patients diagnosed with severe hemophilia according to their factor level rarely bleed spontaneously. Emerging evidence suggests that haemophilia may also impact primary hemostasis, as some studies have reported prolonged bleeding times in affected individuals. These findings highlight the complex interplay between coagulation pathways and platelet function in haemophilia, warranting further investigation into its underlying mechanisms and clinical implications [4].
VWD presents with a broad spectrum of bleeding manifestations, including heavy menstrual bleeding, excessive bruising, and prolonged bleeding following dental procedures, surgeries, or oropharyngeal injuries [5]. Thrombophilia encompasses a group of disorders characterized by an increased predisposition to abnormal blood clot formation, resulting from either inherited or acquired conditions. Among inherited thrombophilia’s, Factor V Leiden mutation is the most prevalent, followed by prothrombin-related thrombophilia, which affects approximately 1.7-3% of the European and U.S. populations [6].
Methods
Study setting and population
This descriptive study analyzed death certificate data from the CDC WONDER (Centers for Disease Control and Prevention Wide-Ranging Online Data for Epidemiologic Research) database, covering the years 1999 to 2020, to investigate mortality related to coagulation defects in older adults. Relevant deaths were identified using ICD-10 codes D66, D67, D68, and D69. The analysis focused on records from the Multiple Cause-of-Death Public Use data, including cases where coagulation defects were listed as either an un derlying or contributing cause of death. Institutional review board approval was not required, as the study utilized a publicly available, de-identified dataset, and the reporting adhered to STROBE (Strengthening the Reporting of Observational Studies in Epidemiology) guidelines.
Data abstraction
Data for population size, year, urban-rural classification, region, and demographics were abstracted. Demographics included sex and race/ethnicity. Race/ethnicity was classified as non-Hispanic (NH) White, NH Black or African American, Hispanic or Latino, NH American Indian or Alaskan Native, and NH Asian or Pacific Islander. This information relies on reported data on death certificates and has been used in previous analyses of the WONDER database [7].
The National Center for Health Statistics Urban-Rural Classification Scheme was used to assess the population by urban (large metropolitan area] population $1 million], medium/small metropolitan area [population 50,000-999,999]) and rural (population <50,000) counties per the 2013 U.S. census classification [8]. Regions were classified into Northeast, Midwest, South, and West according to the U.S. Census Bureau definitions [9].
Statistical analysis
To examine national trends in coagulation defects-related mortality, we calculated crude and age-adjusted mortality rates (AAMRs) per 1,000,000 population from 1999 to 2020 by year, sex, race/ethnicity, region, and urban-rural status with 95% CIs. Crude mortality rates were determined by dividing the number of coagulation defects-related deaths by the corresponding U.S. population of that year. AAMRs were calculated by standardizing coagulation defects-related deaths to the year 2000 U.S. population [9]. To quantify national annual trends in mortality, the Join point Regression Program (Join point V 4.9.0.0, National Cancer Institute) was used to determine the annual percent change (APC) with 95% CI in AAMR [10,11]. This method identifies significant changes in AAMR over time by fitting log-linear regression models where temporal variation occurred. APCs were considered increasing or decreasing if the slope describing the change in mortality was significantly different from zero using 2-tailed t-testing. A value of P < 0.05 was considered statistically significant.
Results
Overall Mortality Trends
A total of 283,824 deaths occurred among adults between 1999 and 2020 with the highest AAMR reported in 2020 (47.5) and the lowest being reported in 2007 (37.2) (Supplementary Table 1). The AAMR was constant from 1999-2018, followed by a sharp increase till 2020. (APC: 9.54; 95% CI 5.23 to 14.0) (Figure 1, Supplementary Table 6, Table 1). Highest number of deaths were recorded in Medical Facilities (75%), followed by Decedents home (11.80%), Nursing home (8.10%), Hospice facility (3.00%) and others (1.90%). [Supplementary Table 5].
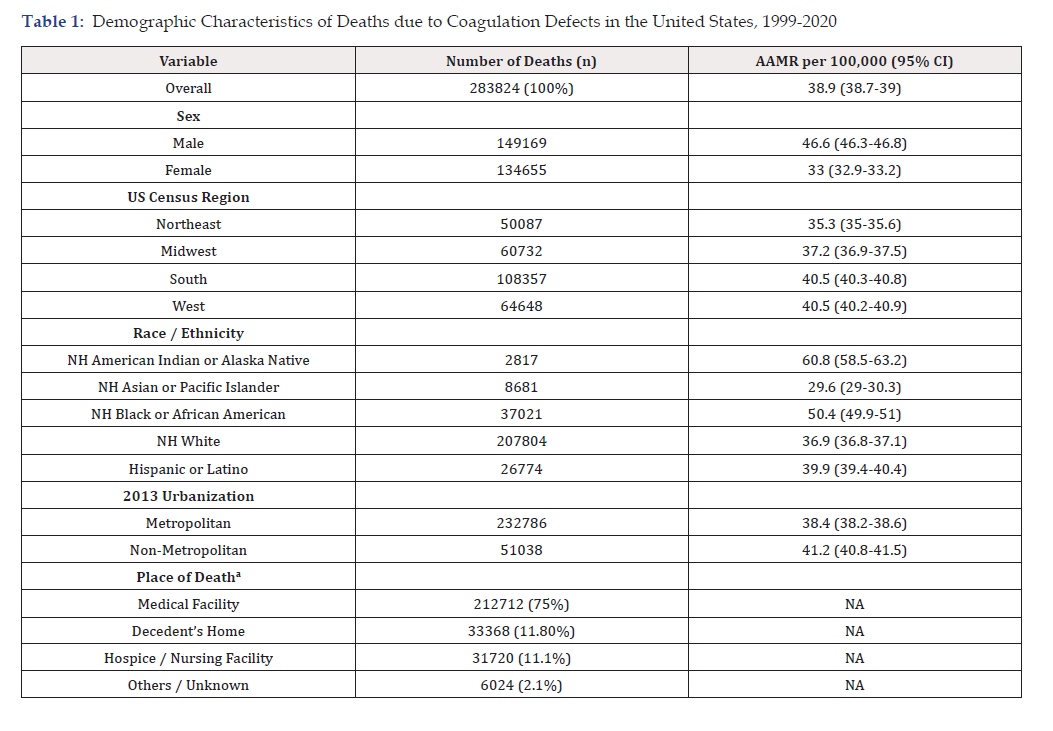
Table 1:Demographic Characteristics of Deaths due to Coagulation Defects in the United States, 1999-2020
Note*: aAAMRs are not applicable for the place of death.
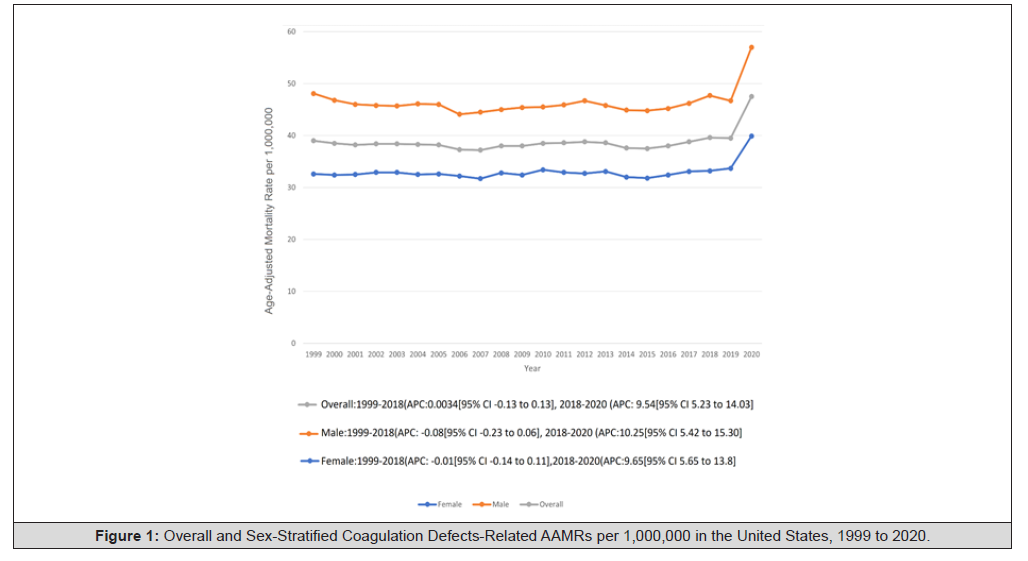
Figure 1:Overall and Sex-Stratified Coagulation Defects-Related AAMRs per 1,000,000 in the United States, 1999 to 2020.
Sex specific Trends
Male had consistently higher AAMRs than females throughout the study period (overall AAMR women: 33; 95% CI: 32.9-33.2; men: 46.6; 95% CI: 46.3-46.8). (Table 1). The AAMR for women decreased from 32.6 in 1999 to 33.2 in 2018 (APC: -0.01; 95% CI -0.14 to 0.11), followed by an increase to 39.9 in 2020 (APC: 9.65; 95% CI 5.65 to 13.80). Similarly, the AAMR for men slightly decreased from 48.1 in 1999 to 47.7 in 2018 (APC: -0.09; 95% CI -0.23 to 0.068), followed by a sharp increase 57 in 2020 (APC: 10.25; 95% CI 5.4215.30) (Figure 1, Supplementary Table 6, Table 2).
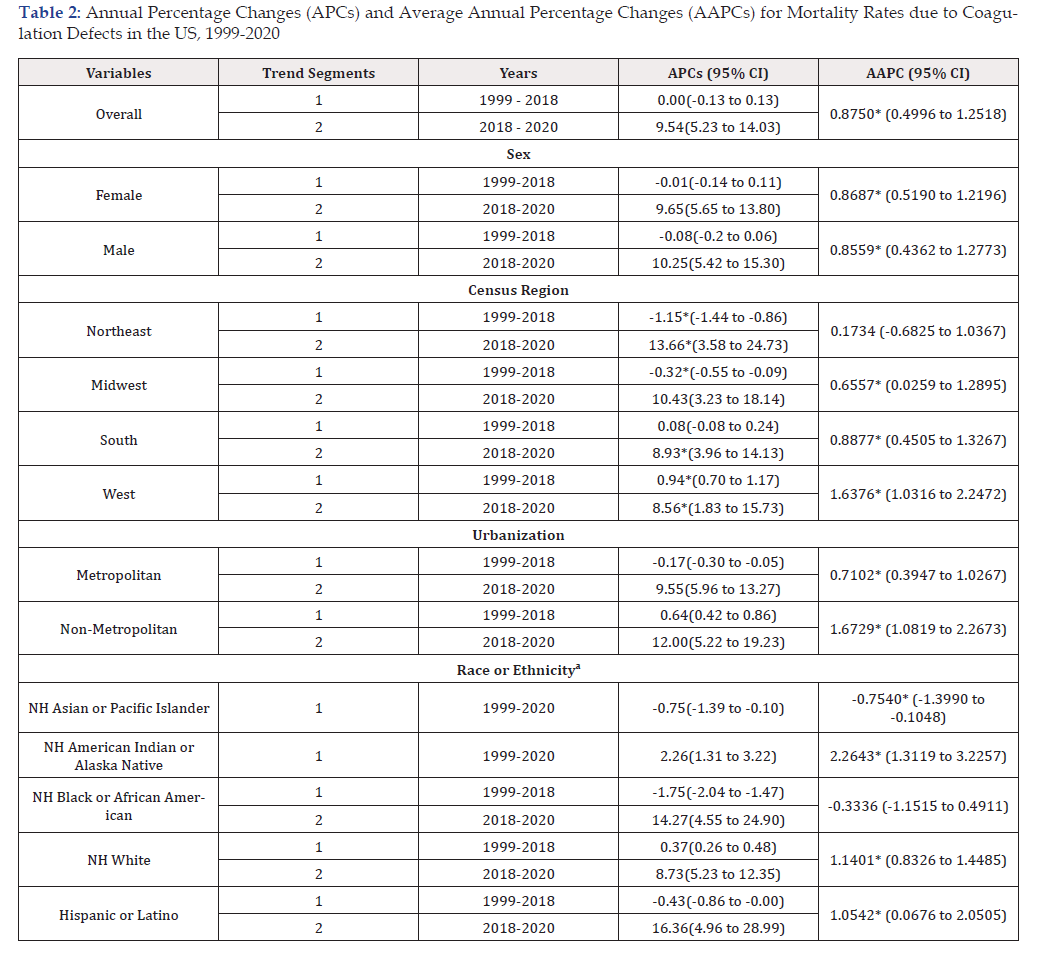
Table 2:Annual Percentage Changes (APCs) and Average Annual Percentage Changes (AAPCs) for Mortality Rates due to Coagulation Defects in the US, 1999-2020
Note*: a Hispanics could be of any race, all other categories are non-Hispanics.
Race/Ethnicity-Specific Trends:
When stratified by race, the AAMR was highest for NH American Indian, followed by NH black or African American, Hispanics, NH White, NH Asian or Pacific Islander (overall AAMR NH American Indian: 60.8; NH Black: 50.4; Hispanic: 39.9; NH White: 36.9; NH Asian or Pacific Islander: 29.6). (Table 1).
The AAMR for NH Asian or Pacific Islander was lowest throughout having a slight decrease from 1999-2020. (APC: -0.75; 95% CI -1.39 to -0.10). The AAMR for NH Black or African American decreased from 60 in 1999 to 44.6 in 2018 (APC: -1.76; 95% CI -2.04 to -1.47), followed by an increase to 57.5 in 2020 (APC: 14.28; 95% CI 4.55 to 24.99). The AAMR for NH American Indian increased from 59.5 in 1999 to 96.9 in 2020 (APC: 2.26; 95% CI 1.31 to 3.22). The AAMR for NH White increased from 35.6 in 1999 to 39 in 2018 (APC: 0.37; 95% CI 0.2 to 0.48), followed by an increase to 45.3 in 2020 (APC: 8.73; 95% CI 5.23 to 12.35). The AAMR for Hispanic decreased from 1999- 2018, followed by an increase till 2020 (Figure 2, Supplementary Table 7, Table 2). Absolute number of deaths were highest among NH Whites (Supplementary Table 2).
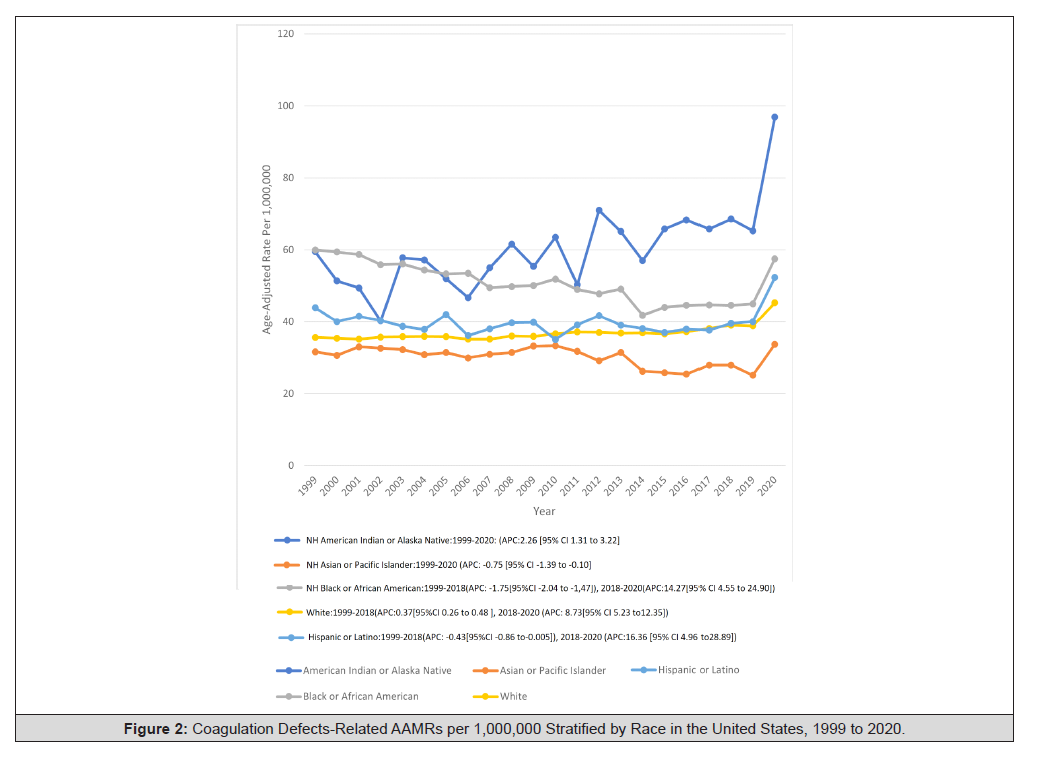
Figure 2:Coagulation Defects-Related AAMRs per 1,000,000 Stratified by Race in the United States, 1999 to 2020.
Census Region
When stratified by census region, the AAMR for Northeast had the lowest AAMR peak in 2018. The AAMR declined from 1999-2018 (APC: -1.15;95% CI -1.43 to -0.86), followed by an increase till 2020(APC: 13.66; 95% CI 3.57 to 24.7). The AAMR for Midwest decreased slightly from 1999-2018 (APC: -0.32; 95% CI -0.55 to -0.09), followed by an increase till 2020 (APC: 10.43; 95% CI 3.22 to 18.14). The AAMR four south and west increased slightly till 2018, followed by a sharp increase till 2020. APC for south 2018-2020(8.92; 95% CI 3.95 to 14.13), APC for west from 2018- 2020(8.55; 95% CI 1.83 to 15.73) (Supplementary Table 8, Table 2, Figure 3). Absolute number of deaths was highest in the South, followed by West, Midwest and Northeast (Supplementary Table 3).
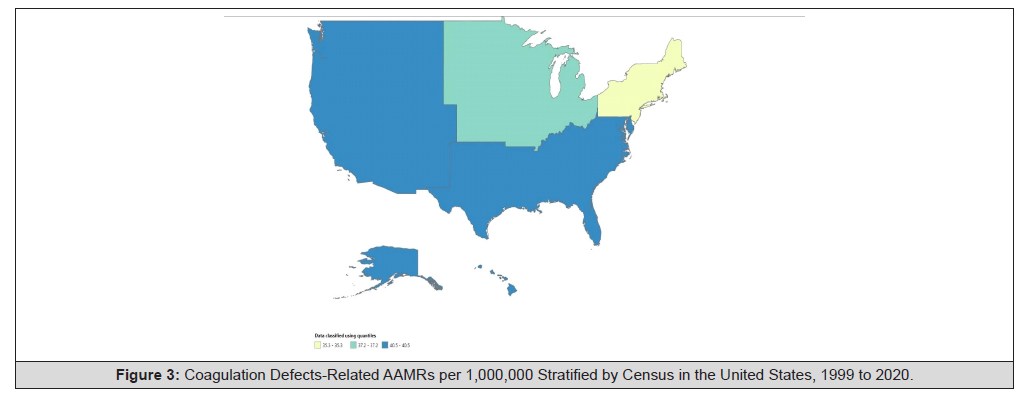
Figure 3:Coagulation Defects-Related AAMRs per 1,000,000 Stratified by Census in the United States, 1999 to 2020.
Urban-Rural Trends
When stratified by urbanization, the AAMR for Non-Metropolitan was higher throughout than metropolitan (41.2 vs 38.4). For nonmetropolitan, the AAMR increased from 38 in 1999 to 43.8 in 2018 (APC: 0.642; 95% CI 0.42 to 0.86), followed by a sharp increase to 54.2 in 2020 (APC: 12.00; 95% CI 5.22 to 19.2). For metropolitan, the AAMR slightly decreased from 39.2 in 1999 to 38.8 in 2018 (APC: -0.17; 95% CI -0.30 to -0.05), followed by a sharp increase to 46.3 in 2020 (APC: 9.55; 95% CI 5.96 to 13.27) (Figure 4, Supplementary Table 9, Table 4). Metropolitan areas exhibit higher absolute number of deaths than non-metropolitan areas (Supplementary Table 4).
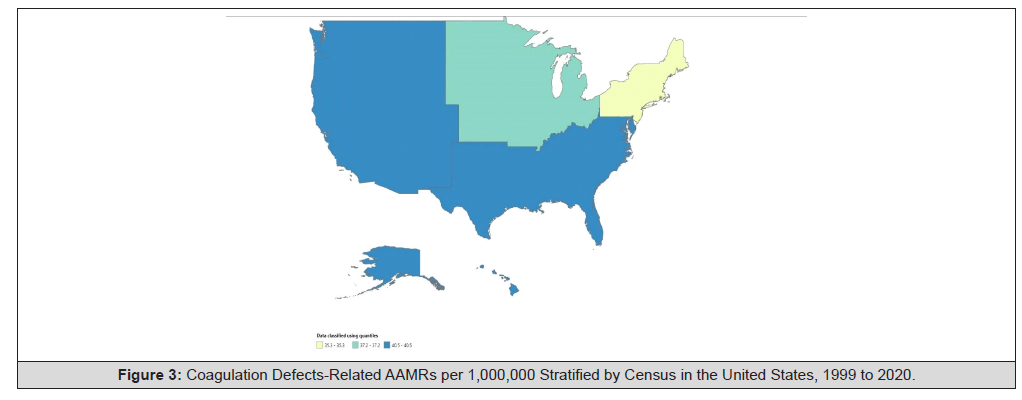
Figure 4:Coagulation Defects-Related AAMRs per 1,000,000 Stratified by Urban-Rural Status in the United States, 1999 to 2020.
States
AAMR values range from 24.9 in Louisiana to 66.8 in District of Columbia, with a notable contrast observed in different states. States in the top 90th percentile include District of Columbia, Hawaii, South Carolina, Maryland, West Virginia, North Dakota, and in the bottom 10th percentile includes Iowa, Utah, Wisconsin, Massachusetts, New York and Louisiana (Figure 3, Supplementary Table 10).
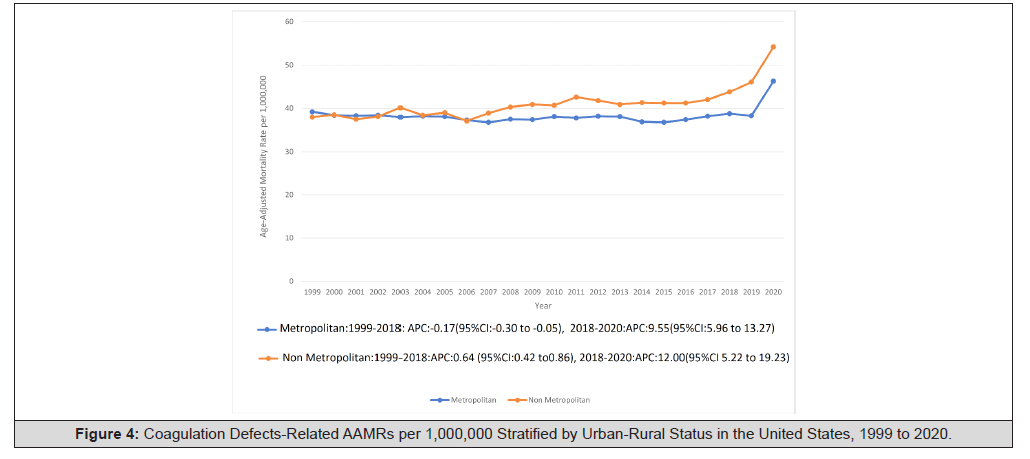
Figure 5:Coagulation Defects-Related AAMRs per 1,000,000 Stratified by Race in the United States, 1999 to 2020.
Discussion
This analysis of two-decade mortality data from CDC WONDER database reported some major trends. Overall deaths from coagulation defects in the U.S. were found to be 283,284. Males demonstrated consistently higher mortality than females throughout the study duration. Among all the racial groups, American Indians or Alaska Natives showed the highest mortality rate. Moreover, non-metropolitan areas and the Western region exhibited the greatest deaths rates due to coagulation defects from 1999 to 2020.
Our analysis revealed that overall mortality from coagulation defects increased in the last two decades. A CDC WONDER study by Shahzad M, et al. showed that overall mortality from Idiopathic Thrombocytopenic Purpura (ITP) has been on the rise from 1999 to 2017 with a decrease afterwards [12]. This might be due to the fact that patients with ITP experience higher mortality rates compared to the general population, primarily due to an increased risk of death from cardiovascular disease, infections, bleeding, and hematological cancers [13]. However, a study by Day JR, et al. revealed that mortality rates from hemophilia have decreased in recent years. Several factors contribute to this overall increase in lifespan, like advancements in comprehensive care provided at federally funded hemophilia treatment centers (HTCs), enhanced safety of blood products and factor concentrates, better access to prophylactic regimens, and improvements in hemophilia treatments, particularly the availability of extended half-life factor concentrates, which have led to greater adherence to prophylaxis and reduced bleeding episodes [14-16]. Additionally, hemophilia-related morbidity and mortality have been influenced by care outside hospital settings, including novel therapies, prophylactic treatments, and on-demand management [17-20] Enhanced outpatient treatment may also help minimize complications and reduce hospital admissions for hemophilia- related issues [21].
Females are more prone to develop hypercoagulability than males, likely because of estrogen [22]. Studies have also shown that females demonstrate hypercoagulable state post-trauma as compared to males, which in turn contributes to improvements in hemostasis following traumatic hemorrhage [23,24]. Hemophilia A and B, the most common inherited coagulation factor deficiency, is more prevalent in males than females due to its X-linked inheritance pattern ]25]. It is also well-established that males and females have inherent differences in enzymatic coagulation, leading to variations in thrombin generation. Compared to males, females exhibit higher levels of coagulation factors II, VII, VIII, IX, X, XI, and XII, along with a shorter activated partial thromboplastin time (APTT][26]. On the other hand, antiphospholipid syndrome (APS), an autoimmune thrombophilia, is seen to be more prevalent in females [27]. The reasons for this predominance are likely multifactorial, primarily related to the X chromosome and various genes expressed only on it, such as TLR7, FOX-P3, and CD40L [28], and other genes that play a role in the immune response process [29]. Another proposed mechanism is the involvement of sex hormones. Estrogen and progesterone can modulate immune responses. Estrogens, in particular, bind to specific receptors on lymphocytes, influencing both innate and adaptive immunity, potentially increasing the risk of APS in women ]30]. Meanwhile, our analysis showed that males had higher mortality rates than females due to coagulation defects.
Additionally, our study reveals that American Indians or Alaska Natives had the highest mortality rates from coagulation defects. A study by Fedewa SA, et al. showed that mortality rates due to hemophilia were higher in Blacks than in Whites [31]. Data from U.S. Haemophilia Treatment Centers reveals a slightly lower prevalence of haemophilia among Black males compared to White males. This disparity may stem from factors such as reduced survival rates, healthcare disparities, genetic variations, or underdiagnosis within the Black community [32]. The lower reported prevalence of haemophilia among Black males in U.S. HTC data might also be due to disparities in access to specialized care and/or inadequate diagnosis of mild to moderate cases within the Black population in the U.S. [33]. Apart from hemophilia, factor 5 Leiden mutation, an inherited resistance to activated protein C (APC) is a hypercoagulable state seen most in Caucasian American individuals [34]. This finding suggests that the Factor V-Leiden mutation is more common in populations with substantial Caucasian ancestry and is uncommon in genetically distinct non-European populations [35].
As per our analysis, deaths related to coagulation defects are greatest in the non-metropolitan areas of the U.S. Possible factors include variations in the implementation of care standards, which may not have been adopted as extensively in nonmetropolitan areas as in metropolitan regions, shifts in insurance coverage rates, fluctuations in disease incidence, and differences in health behaviors [36]. Furthermore, rural areas face limited access to healthcare services, which can be challenging due to long distances from medical facilities, transportation difficulties, and financial constraints [37]. While no research specifically supports our study’s finding of increased mortality in the Western U.S., a study by Gong G, et al. found that the Southern region tends to be socioeconomically disadvantaged compared to other U.S. regions, potentially contributing to higher overall mortality rates in general [38]. This is highlighted by a study using the National Inpatient Sample (NIS) database by Carter J, et al., which showed that cases of Thrombotic Thrombocytopenic Purpura (TTP), a thrombotic disorder, are more prevalent in the Southern region, with 43.5% of all cases, significantly higher than in any other region [39].
Study Limitations
Several limitations must be considered. First, dependance on ICD-10 codes and death certificates can potentially result in misdiagnosis or the exclusion of coagulation defects as the cause of mortality. Second, the database lacks information on disease severity. Third, it does not specify whether individuals died from coagulation defects or merely had this condition at the time of death. Finally, the database does not have information on treatments and social determinants of health, both of which can affect healthcare access and influence mortality rates.
Conclusions
Our analysis of two decades of U.S. mortality data from the CDC WONDER database highlights significant trends and disparities in deaths related to coagulation defects. Overall mortality has increased, with notable differences across sex, race, and geographic regions. Males and American Indians or Alaska Natives demonstrated higher mortality rates, while non-metropolitan and Western areas showed the highest regional death rates. These disparities may stem from a combination of biological factors, healthcare access limitations, genetic predispositions, and socioeconomic influences. Continued research and targeted public health efforts are essential to address these inequities and improve outcomes for individuals with coagulation disorders.
Acknowledgements
Funding: This research received no specific grant from any
funding agency in the public, commercial, or not-for-profit sectors.
Institutional Review Board Statement: Not applicable.
Informed Consent Statement: Not applicable.
Data Availability Statement: Not applicable.
Conflicts of Interest
The authors declare that they have no competing interests.
References
- Psaila B, Bussel JB (2007) Immune thrombocytopenic purpura. Hematol Oncol Clin North Am 21(4): 743-759.
- Bolton-Maggs PHB, Pasi KJ (2003) Haemophilia A and B Lancet. 361(9371): 1801-1809.
- Castaman G, Matino D(2019) Hemophilia A and B: molecular and clinical similarities and differences. Haematologica 104(9):1702-1709.
- Riedl J, Ay C, Pabinger I, Ingrid Pabinger (2017) Platelets and hemophilia: a review of the literature. Thromb Res; 155: 131-139.
- Weyand AC, Flood VH (2021) Von Willebrand disease. Hematol Oncol Clin North Am 35(6): 1085-1101.
- Dautaj A, Krasi G, Bushati V, Vincenza Precone, Miriam Gheza, et al. (2019) Hereditary thrombophilia. Acta Biomed90 (Suppl 10): 44-46.
- Centers for Disease Control and Prevention, National Center for Health Statistics. Multiple cause of death 1999–2019 on CDC WONDER online database. Published 2020. Accessed May 21, 2021.
- Aggarwal R, Chiu N, Loccoh EC, Dhruv S Kazi, Robert W Yeh, et al. (2021) Rural-urban disparities: diabetes, hypertension, heart disease, and stroke mortality among Black and White adults, 1999-2018. J Am Coll Cardiol 77: 1480-1481.
- Ingram DD, Franco SJ (2013) NCHS Urban-Rural Classification Scheme for Counties. US Department of Health and Human Services, Centers for Disease Control and Prevention; 2014 (166): 1-73.
- Anderson RN, Rosenberg HM (1998) Age standardization of death rates: implementation of the year 2000 standard. Natl Vital Stat Rep; 47: 1-16.
- Joinpoint Trend Analysis Software. Joinpoint regression program, version 2016. Surveillance Research Program, National Cancer Institute. Accessed October 14, 2022.
- Shahzad M, Ahmed S, Ahmad E, et al. (2024) Trends and disparities in idiopathic thrombocytopenic purpura-related mortality in the United States: a retrospective study over two decades Blood 144: 3947.
- Frederiksen H, Maegbaek ML, Nørgaard M (2014) Twenty-year mortality of adult patients with primary immune thrombocytopenia: a Danish population-based cohort study. Br J Haematol; 166(2): 260-267.
- Mazepa MA, Monahan PE, Baker JR, et al. (2016) Men with severe hemophilia in the US Hemophilia Treatment Center Network. Men with severe hemophilia in the United States: birth cohort analysis of a large national database. Blood;127(24): 3073-3081.
- Soucie JM, Nuss R, Evatt B, A Abdelhak, L Cowan, et al. (2000) Mortality among males with hemophilia: relations with source of medical care. The Hemophilia Surveillance System Project Investigators Blood; 96(2): 437-442.
- Oldenburg J. (2015) Optimal treatment strategies for hemophilia: achievements and limitations of current prophylactic regimens. Blood;125(13): 2038-2044.
- Witmer C, Presley R, Kulkarni R, J Michael Soucie, Catherine S Manno, et al. (2011) Associations between intracranial hemorrhage and prescribed prophylaxis in a large cohort of haemophilia patients in the United States. Br J Haematol;152(2): 211-216.
- Manco-Johnson MJ, Abshire TC, Shapiro AD, Brenda Riske, Michele R Hacker, et al. (2007) Prophylaxis versus episodic treatment to prevent joint disease in boys with severe hemophilia. N Engl J Med;357(6): 535-544.
- Manco-Johnson MJ, Kempton CL, Reding MT, T Lissitchkov, S Goranov, et al. (2013) Randomized, controlled, parallel-group trial of routine prophylaxis vs. on-demand treatment with sucrose-formulated recombinant factor VIII in adults with severe hemophilia A (SPINART). J Thromb Haemost ;11(6): 1119-1127.
- Gringeri A, Lundin B, von Mackensen S, Mantovani L, Mannucci PM, (2011) A randomized clinical trial of prophylaxis in children with hemophilia A (the ESPRIT Study). J Thromb Haemost; 9(4): 700-710.
- Day JR, Takemoto C, Sharathkumar A, Sarah Makhani 5, Ashwin Gupta, et al. (2022) Associated comorbidities, healthcare utilization & mortality in hospitalized patients with haemophilia in the United States: contemporary nationally representative estimates. Haemophilia; 28(4): 532-541.
- Gorton HJ, Warren ER, Simpson NA, Lyons GR, Columb MO (2000) Thromboelastography identifies sex-related differences in coagulation. Anesth Analg; 91(5): 1279-1281.
- Schreiber MA, Differding J, Thorborg P, Mayberry JC, Mullins RJ (2005) Hypercoagulability is most prevalent early after injury and in female patients. J Trauma ;58(3): 475-481.
- Rowell SE, Barbosa RR, Allison CE, Philbert Y Van, Martin A Schreiber, et al (2011) Gender-based differences in mortality in response to high product ratio massive transfusion. J Trauma; 71(2 Suppl 3): S375-S379.
- Schieve LA, Byams VR, Dupervil B, Meredith A Oakley 1, Connie H Miller, et al. (2020) Evaluation of CDC's Hemophilia Surveillance Program-Universal Data Collection (1998–2011) and Community Counts (2011-2019), United States. MMWR Surveill Summ; 69(5): 1-18.
- Favaloro EJ, Soltani S, McDonald J, Grezchnik E, Easton L Cross-laboratory audit of normal reference ranges and assessment of ABO blood group, gender and age on detected levels of plasma coagulation factors. Blood Coagul Fibrinolysis. 2005;16(8): 597-605.
- Yao WC, Leong KH, Chiu LT, Yao WC, Leong KH, Chiu LT, et al. (2022) The trends in the incidence and thrombosis-related comorbidities of antiphospholipid syndrome: a 14-year nationwide population-based study. Thromb J 20(1): 50. et al. (2022) The trends in the incidence and thrombosis-related comorbidities of antiphospholipid syndrome: a 14-year nationwide population-based study. Thromb J 20(1): 50.
- Sarmiento L, Svensson J, Barchetta I, Giwercman A, Cilio CM (2019) Copy number of the X-linked genes TLR7 and CD40L influences innate and adaptive immune responses. Scand J Immunol; 90(2): e12776.
- Barinotti A, Radin M, Cecchi I, Silvia Grazietta Foddai, Elena Rubini, et al. (2020) Genetic factors in antiphospholipid syndrome: preliminary experience with whole exome sequencing. Int J Mol Sci ;21(24): 9551.
- Taneja V (2018) Sex hormones determine immune response. Front Immunol; 27; 9: 1931.
- Fedewa SA, Payne AB, Tran D, Cafuir L, Antun A, et al. (2023) Racial and ethnic differences in reported haemophilia death rates in the United States. Haemophilia; 29(6): 1410-1418.
- Soucie JM, Miller CH, Dupervil B, Le B, Buckner (2020) TW Occurrence rates of haemophilia among males in the United States based on surveillance conducted in specialized haemophilia treatment centres. Haemophilia; 26(3): 487-493.
- Okolo AI, Soucie JM, Grosse SD, Christopher Roberson, Isaac A Janson, et al. (2019) Population-based surveillance of haemophilia and patient outcomes in Indiana using multiple data sources. Haemophilia; 25(3): 456-462.
- Ridker PM, Miletich JP, Hennekens CH, Buring JE (1997) Ethnic distribution of factor V Leiden in 4047 men and women: implications for venous thromboembolism screening. JAMA; 277(16): 1305-1307.
- Gregg JP, Yamane AJ, Grody (1997) WW Prevalence of the factor V-Leiden mutation in four distinct American ethnic populations. Am J Med Genet;73(3): 334-336.
- Cossman JS, James WL, Cosby AG, Cossman RE (2010) Underlying causes of the emerging nonmetropolitan mortality penalty. Am J Public Health100(8): 1417-1419
- Kuo YL, Chou WT, Chu CH (2022) Urban-rural differences in factors affecting mortality and causes of death among older adults. Geriatr Nurs;43: 151-158.
- Gong G, Phillips SG, Hudson C, Curti D, Philips BU (2019) Higher US rural mortality rates linked to socioeconomic status, physician shortages, and lack of health insurance. Health Aff (Millwood); 38(12): 2003-2010.
- Carter J, Lee W, Perimbeti S, et al. (2016) Thrombotic thrombocytopenic purpura predominance in the southern United States: trends in regional and seasonal variation and mortality of TTP utilizing the National Inpatient Sample database between 1999 and 2013. Blood; 128(22): 4750.




 We use cookies to ensure you get the best experience on our website.