
Review Article 
 Creative Commons, CC-BY
Water Scarcity AI Solution: Applying the Natural Water Cycle Model at the U.S.- Mexico Border States
*Corresponding author:Jorge Garza Ulloa, Research Consulting Services, University of Texas El Paso, USA.
Received:October 09, 2025; Published:October 17, 2025
DOI: 10.34297/AJBSR.2025.28.003731
Abstract
The U.S.-Mexico border is almost 2000 miles long and is one of the most crossed international borders in the world. Where water scarcity is threatening the livelihoods of millions of people in both nations. The water crisis is a big challenge and a great opportunity to deploy innovative solutions to handle the growing demand and pollution in the world’s greatest resource: water for human consumption. The two main rivers in the region, the Colorado River and the Rio Grande, are among the most water-stressed by erratic precipitations, diminishing snow melting, and increasingly prolonged droughts. The analysis and measurements for climate change are needed to implement and continuously monitor water resources that are currently shrinking due to overexploitation and rising temperatures that increase the evaporation of rivers, reservoirs, and streams. Spending water infrastructure, improving natural solutions, and the need to monitor water levels are necessary to improve water availability in a cross-border collaboration. In this case study, based on the measurement of the natural water cycle that is affected by the average temperature at each region, a complete study case of the border region El Paso, TX–Ciudad Juarez, Chih, is given to go back to water levels by applying the Altered Natural Water Cycle Value (ANWC), also known as the Natural Water General Cycle Index (NWGCI), as explained in my two previous research papers [1,2]. The AI methods used here to measure the water scarcity, evaluate regions, model adaptations, policy integrations, and forecast to diminish or correct the water scarcity can be used on any border countries sharing the water resources around the world.
Introduction to the Actual U.S.-Mexico Border Water Scarcity Situation
Water scarcity is threatening the livelihoods of millions of people in the world. In this research, we are focusing on the U.S.-Mexico border as an example of many nations that share the water problem, as do many nations around the globe. The U.S.-Mexico border is almost 2000 miles long, being a long continental border and one of the most crossed international borders in the world [3]. The border states between both countries are shown in Figure 1 and include four U.S.A. states: California, Arizona, New Mexico, and Texas are neighbors with six Mexico states: Baja California, Sonora, Chihuahua, Coahuila, Nuevo Leon, and Tamaulipas (Figure 1).
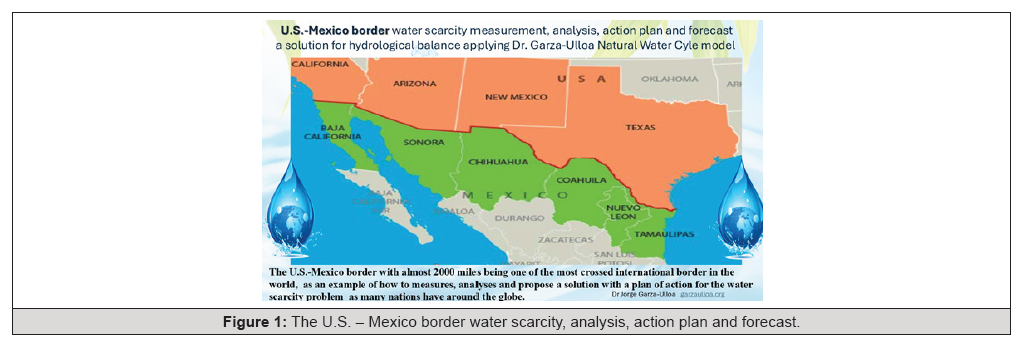
Figure 1:The U.S. – Mexico border water scarcity, analysis, action plan and forecast.
Description of Border U.S.A. and Mexico States
The border between the U.S. and Mexico is formed by four U.S. states-California, Arizona, New Mexico, and Texas-that are neighbors with six Mexican states: Baja California, Sonora, Chihuahua, Coahuila, Nuevo Leon, and Tamaulipas. These border states between the U.S. and Mexico and their main major 8 cities [4,5] in the U.S.A. Mexico Borders sharing the water resources are shown in (Table 1).
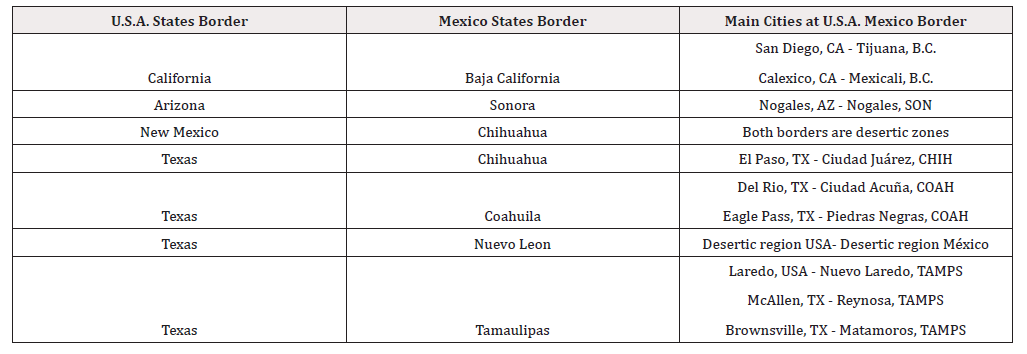
Table 1:USA-México States Border and their main cities at U.S.A. Mexico Border sharing the water between the 2 nations.
Remark:
i. In 2025 there are over 30 million people living within the
U.S.A/ Mexico Border, withing 100 miles (160 Kms) on both
sides sharing the water, they need to cooperate to avoid water
scarcity.
ii. The population on both sides of the borders in the next 30
years is expected to double to approx. 60 million people that
will need this precious resource; it is necessary to act now to
diminish their consequences for the well-being of the 2 nations.
Water Scarcity of Border U.S.A. and Mexico States
Water scarcity is threatening the livelihoods of millions of people on both nations’ sides. The water crisis is a big challenge and a great opportunity to deploy innovative solutions on the U.S.-Mexico border to handle the growing demand and the pollution in the world’s greatest resource: water for human consumption.
The U.S.-Mexico border is evaluated using water measured mathematically and analyzed to deduct an action plan and to get an AI forecast solution for a hydrological balance by applying Dr. Garza- Ulloa’s Natural Water Cycle model. This shared border has two main rivers in the region: the Colorado River and the Rio Grande, also known as the Rio Bravo. Unfortunately, “this is one of the most water-stressed zones” due to
i. Erratic precipitation
ii. Diminishing snow melting than coming from mountains,
iii. Each time there are more prolonged droughts.
Remark:
“The water analysis and measurements for climate change are urgently needed to implement solutions based on continuously monitoring water resources in the geographic area of both nations.”
The water availability at on the U.S.-Mexico border is currently
shrinking by [2]:
i. Overexploitation,
ii. Rising temperatures by global warming,
iii. Rate increase t of evaporation of rivers, reservoirs and streams.
Remark:
“It is necessary to spend on infrastructure and natural solutions that must be monitored to improve water availability in a cross-border collaboration.”
Methodology “Altered Natural Water Cycle”
To achieve this goal in this case study, I am applying my methodology for measurement of the “altered natural water cycle [1,2],” with the following main characteristics:
i. Representing the natural water cycle as a circular system as
a circle, where the radius is constrained by the hydrological
variable Altered Natural Water Cycle (ANWC), also known as
the Natural Water General Cycle Index (NWGCI).
ii. This enables comparative analysis across regions and timeframes,
supporting policy benchmarking by applying artificial
intelligence algorithms to forecasting that allows performance-
based planning that is affected by the average
temperature at each region, as was introduced in my two previously
published papers, where you can find more details:
a. Perspective Chapter: Shortening the Natural Altered Water Cycle
by Global Warming link: [1].
b. How to Measure and Evaluate Water Availability in a Region
Based on the Natural Water Cycle [2]. Here an example of this
framework is applied to El Paso, Texas U.S.A.
USA States and Mexico Border States are Heating Faster
Statistics on temperatures indicate that some U.S.A. states are heating faster than the national average; they are shown at the left side of table 2, and the Mexican states that are heating faster are shown at the right side of the same table, where six of them are precisely on the U.S.–Mexico border (Table 2).
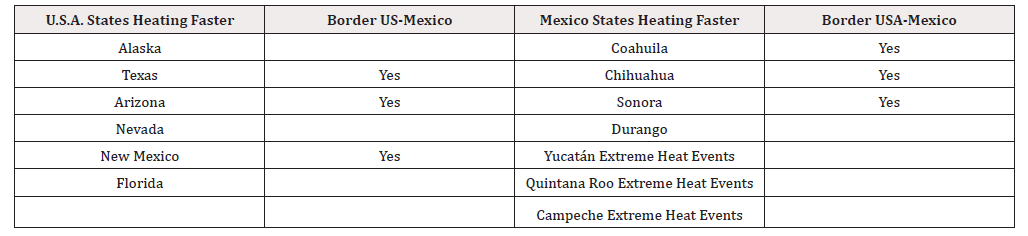
Table 2:USA states and Mexico Sates that are heating faster than the national averages.
Heat Cause and Heat Effects at U.S. and Mexico Border
Heat waves are the result of climate change that is getting hotter and the rise of greenhouse gas emissions that are trapped in the earth’s atmosphere. One main reason why the U.S. and Mexico had a climate shift is the result of the concentration of energy in lower- latitude, rising-temperature regions. “Cause and effect” at the U.S.-Mexico border are summarized in (Table 3).
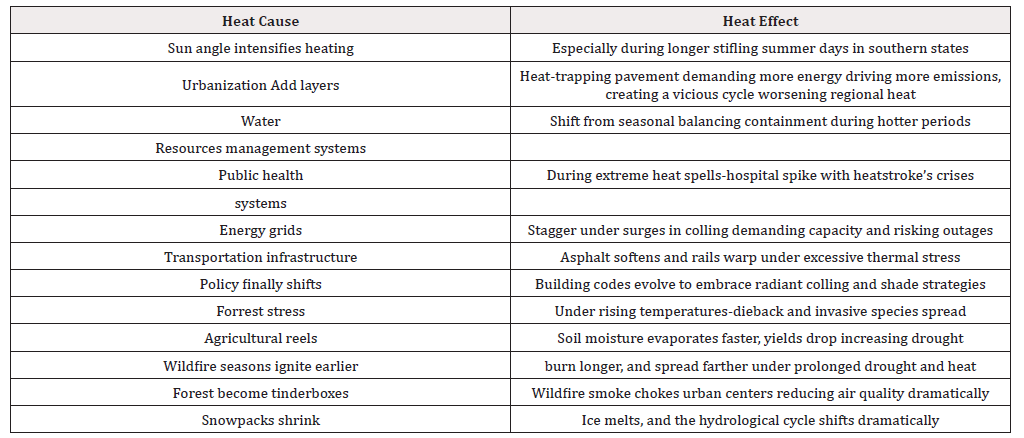
Table 3:Heat cause and heat effects at U.S. and Mexico border.
Water Loss of Border at U.S.A. and Mexico States
According to a water loss map [6], there is already an acceleration of groundwater depletion across the U.S., especially in regions where agriculture and drought collide. The U.S. and Mexico states are facing the most critical water losses. There are seven states with critical water losses from both countries that are precisely on the border between the U.S. and Mexico (Table 4).
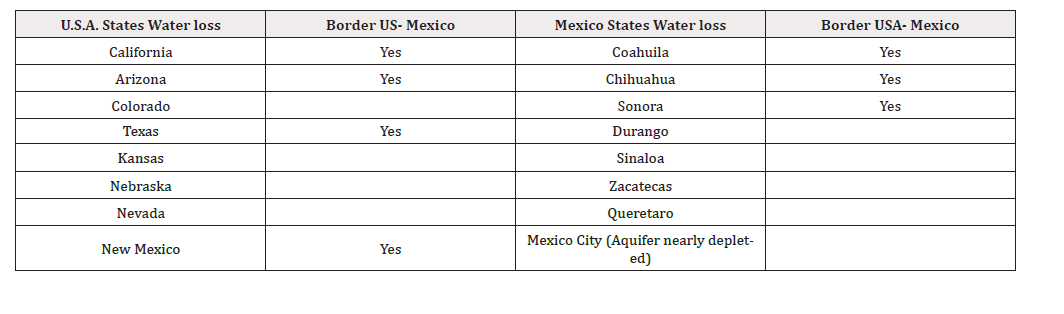
Table 4:U.S.- Mexico main states with water loss including aquifers.
Remarks alarming water loss at U.S.
i. Central Valley California is considered the epicenter of groundwater
collapse, accounts for 21% of total U.S. groundwater
use, and three-quarters of its 183 groundwater basins are in
decline, and in areas like Cuyama Valley, water levels are dropping
1.45 meters (nearly 5 feet) per year [7,8].
ii. Arizona has low water levels in reservoirs over the years,
where the depletion of groundwater far outpaces the surface
water losses.
iii. In the years 2002-2014 the basin in western Arizona (La Paz
and Mohave counties) and in the southeast of the state (Cochise
County) lost groundwater at a rate of around 0.2 inches
per year. However, this rate more than doubled, to 0.5 inches
per year, in the following decade 2014-2024. 72 percent of the
Arizona state’s available water supply is used for irrigation agriculture.
Remarks alarming water loss at Mexico
i. Northern Mexico has long been geographically and economically
critical to Mexico’s national development.
ii. Proximity to the US border, a business-friendly environment
and an entrepreneurial culture make the region prime for foreign
direct investment, particularly amid the current wave of
nearshoring [9]
Conclusion to the Actual U.S.-Mexico Border Water Scarcity Situation
Based on the results explained in this section, we can conclude that the actual U.S.-Mexico border water scarcity is currently in a state of alert for water scarcity:
i. The U.S.-Mexico border has four U.S. border states (California,
Arizona, New Mexico, and Texas). It borders six Mexican states
(Baja California, Sonora, Chihuahua, Coahuila, Nuevo Leon,
and Tamaulipas). The border states on the U.S.–Mexico border
have eight major cities sharing the water resources on a critical
level, as indicated in (Table 1).
ii. Almost 50% of the states on both sides of the border of U.S. and
Mexico are heating faster than national average temperature
as shown on (Table 2).
iii. These border cities have a water scarcity situation, mainly because
of a climate shift caused by the concentration of energy
in lower-latitude and the rising-temperature regions, as summarized
by “heat causes and heat effects” in (Table 3).
iv. According to water loss maps for border at U.S.A. and Mexico
states there is already an acceleration of groundwater depletion,
especially in regions where agriculture and drought collide,
as shown at (Table 4).
There are alarming “NASA water loss maps,” like the one shown in Figure 2, showing water levels at Arizona groundwater reaching critical levels, from 0.2 inches per year from 2002 to 2014 to 0.5 inches per year from 2015 to 2024. There is a need for immediate action for both nations to avoid or diminish consequences for water scarcity (Figure 2).
v. Final Remark section 1:
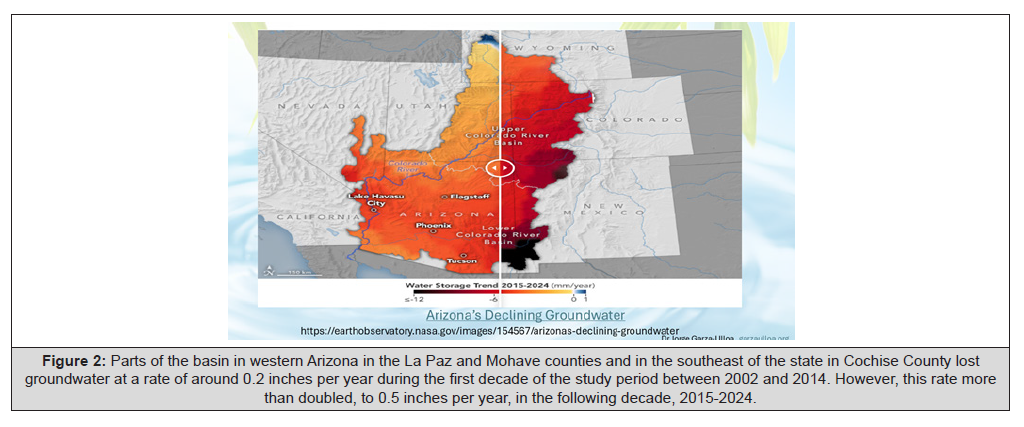
Figure 2:Parts of the basin in western Arizona in the La Paz and Mohave counties and in the southeast of the state in Cochise County lost groundwater at a rate of around 0.2 inches per year during the first decade of the study period between 2002 and 2014. However, this rate more than doubled, to 0.5 inches per year, in the following decade, 2015-2024.
This research paper explains a methodology that can help to make recommendations to diminish and improve the water scarcity situation based on the method for measuring the “altered natural water cycle” from Dr. Garza-Ulloa [10] in the next section and applies AI methodology in the region of El Paso, TX–Ciudad Juarez, CHIH, in the last section to achieve the calculated goal of improvement on water availability.
U.S.-Mexico Border General Water Hydrology Analysis Applying the Altered Natural Water Cycle Model
The U.S.-Mexico border water scarcity methodology is explained using a hydrology analysis that could be applied at each main border city, as shown in the table at the top of Figure 3. The main border cities with higher populations are indicated in boldface type. The hydrological methodology is divided into five steps, which are shown in the bottom section in Figure 3 and explained in more detail for each of the five basic steps for hydrology analysis (Figure 3).
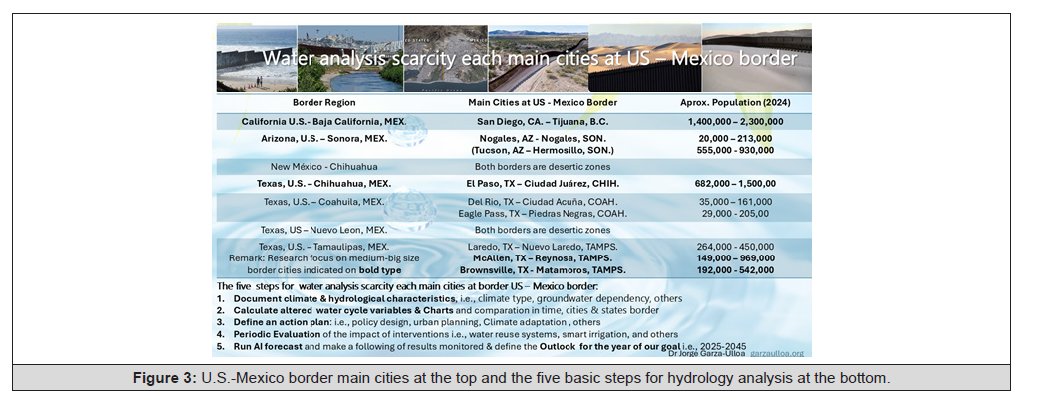
Figure 3:U.S.-Mexico border main cities at the top and the five basic steps for hydrology analysis at the bottom.
The five basic steps for hydrology analysis are
Document climate & hydrological characteristics of each city as:
i. Climate type, i.e., arid- semi-arid, others ii. Season rainfall i.e., monsoon rains, erratic due to climate change, others iii. Groundwater dependency, i.e. on aquifers, rain, others
Circular Water Cycle Data Modeling
i. Calculate the Altered Natural Water Cycle Value (ANWC) also
known as the Natural Water General Cycle Index (NWGCI) for
each main city in the U.S.-Mexico border climate data (GAST).
ii. Create a visual chart based on a mathematical framework representing
the water cycle as a circular system to facilitate intuitive
comparisons between historical hydrological behavior,
i.e., (1900-1949), (1950-2000), and future (2000-2050). This
approach reveals how global warming is affecting and slowing
the ANWC, increasing water scarcity, and delaying the frequency
of rains.
iii. Make a comparative analysis across cities and states of each
side of the U.S.-Mexico border to obtain the natural water general
cycle index (NWGCI) to quantify the efficiency and health
of a region’s water cycle. NWGCI is used as a powerful tool for
policy benchmarking and resilience planning. The ANWC is
represented as circular diagrams, energy flow charts, and cycle
radius comparisons.
Define an action plan based on real word applications such as:
i. Policy Design: Enables performance-based budgeting tied
to measurable cycle restoration, i.e., water reuse & recycling,
smart irrigation technologies, and others.
ii. Urban Planning: Supports zoning and infrastructure decisions
based on cycle health.
iii. Climate Adaptation: Helps regions visualize and quantify the
impact of warming on water availability with climate-adaptive
infrastructure on both borders of the USA and Mexico
and helps them learn how to handle extreme weather swings
(floods and droughts).
Evaluation of the impact of interventions such as:
i. Water reuse systems,
ii. Smart irrigation,
Others
AI forecast
i. AI models predict water demand spikes based on climate, population,
and economic data to feed into automated water allocation
systems.
ii. Outlook for the calculated year of our NWGCI goal i.e., 2025-
2045, in 15 years we expect to see a normal value for the natural
water general cycle index (NWGCI)
Remark:
The next section shows a complete hydrological analysis for water scarcity in one of the main U.S.-Mexico border cities: El Paso, TX – Ciudad Juárez.
Hydrological Analysis for El Paso, TX – Ciudad Juárez, CHIH.
A complete example of the hydrological analysis for the U.S.-Mexico cities: El Paso, TX (population 682,000 in 2024) - Ciudad Juárez, CHIH (1,500,000 in 2024) is explained based on the steps summarized at the bottom of Figure 3 and explained with more details in the last section U.S.-Mexico Border General Water Hydrology, Analysis Applying the Altered Natural Water.
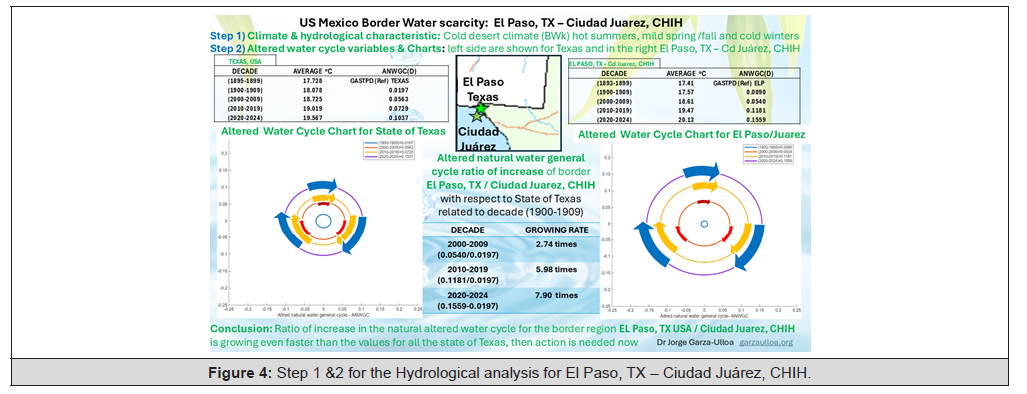
Figure 4:Step 1 &2 for the Hydrological analysis for El Paso, TX – Ciudad Juárez, CHIH.
The implementation of the five steps for water analysis scarcity for El Paso, TX – Ciudad Juárez, CHIH as a border region divided by the Rio Grande (Rio Bravo) using the Natural Water General Cycle Index (NWGCI) are:
Step 1) Climate & Hydrological Characteristics of El Paso, TX – Juárez, CHIH
Climate type: El Paso, TX-Ciudad Juarez, CHIH, as shown in the centre of Figure 4, settles within the Chihuahuan Desert and falls under USD hardiness zone8a characterized by hot summers, mild winters, and low annual rainfall. In El Paso’s zone 8a, gardeners should focus on plants that can tolerate low temperatures and adapt to the arid conditions of the desert [11].
i. Cacti and Succulents such as prickly pear cactus, agave, and
yucca
ii. Desert Adapted Shrubs as marigold, Texas sage, and creosote
bush
iii. Native Grasses like buffalo grass and blue grama gras.
iv. Fruit Trees as apricot, peach, and pomegranate.
v. Remark:
The USDA hardiness zone is a classification system used to determine the suitability of plants for specific regions based on their ability to withstand the average annual minimum temperatures.
With the following temperature values:
i. Annual high temperature 24.53°C (76.15°F)
ii. Annual low temperature 14.16°C (57.49°F)
iii. Average annual precipitation 33.2mm (1.31in)
iv. Warmest month June (35.28°C / 95.5°F)
v. Coldest Month January (3.67°C / 38.61°F)
vi. Wettest Month July (100.03 mm / 3.94in)
vii. Driest Month April (6.45mm / 0.25in)
viii. Number of days with rainfall (≥ 1.0 mm) 66.81 days (18.3%)
ix. Days with no rain 298.19 days (81.7%)
x. Humidity 34.06%
Groundwater dependency [12]
i. El Paso, Texas, and Ciudad Juarez, Mexico, share a delicate balance
of water resources due to their proximity and shared access
to the Paso Del Norte Watershed.
ii. The primary water sources for both cities are the Rio Grande
and the Hueco Bolson Aquifer (to the East) and the Mesilla Bolson
(to the West)
iii. El Paso, TX – Cd. Juarez, CHIH ability to source water from the
Rio Grande regions, shown an annual precipitation that has
been on declining the last years.
iv. The Kay Bailey Hutchison Desalination Plant, in the US is
the largest inland desalination plant in the world, plays a significant
role in treating brackish water from the Hueco Bolson, contributing
5% of total water consumed in El Paso. This plant is part of a larger
plan to diversify the water portfolio and improve the city’s capacity
for water scarcity resiliency.
Step 2) Calculate Altered Water Cycle Variables & Charts
The evaluation of the Altered Natural Water General Cycle for any decade is the variable ANWGC(D), also known as the Natural Water General Cycle index (NWGCI), which is the difference between the absolute value (ABS) ratio between the Global Average Surface Temperature for Decade GASTD(REF) minus the decade used as reference divided by GASTD(REF), where REF is the decade of reference as shown in equation 1.
Eq 1)

Where: ABS is the value without regard to its sign
The average temperature for the state of Texas in °C for the decade (1895-1899) is 17.728; it is used as the variable GASTPD (Ref) to be compared with the following decades at El Paso/ Juarez, summarized in the top-left side of Figure 4, and the chart shown below also at the left side is the circle representation for their respective ANWGC(D) value.
Remark:
i. The data source is from the “extreme weather watch webpage.”
[13]
ii. The steps for the calculations of the altered natural water cycle
variables shown in this section were explained in more detail
in my previous research paper [2].
1. The average temperature for El Paso, Texas, was calculated for
the decade (1895-1899) as 17.41; °C; it is used for reference
and identified as variable “GASTPD (Ref) ELP”, but the one that
is recommended to use is the Texas State average temperature
for the same decade, which is 14.728 °C identified as variable
“GASTPD (Ref) TEXAS”. This variable is used to compare with
the following decades that are summarized in the top-right
side of Figure 4, and the chart shown below, also at the right
side, is the circle representation for their respective ANWGC(
D) value.
Remark: Data source from Average Temperature in El Paso by
Year [14]
2. At The center of Figure 4 is the map of the region El Paso, TX –
Ciudad Juarez, CHIH., and shown the result of the calculation of
the altered natural water general cycle ratio general temperature
(RGT) represents the increase of average temperature at
the border El Paso, TX and Ciudad Juarez, CHIH with respect to
the State of Texas related to the decade (1900-1909) this represent
the ratio increase in the 20th century as shown in eq.2

3. Remark:
As shown in the central part of Figure 4, the ratio of increase in the natural altered water cycle (ANWGC) by global warming for El Paso, Texas, is growing even faster than the values obtained for all of the state of Texas, showing a sharper exponential growth rate: (2000-2009) = 2.70 times, (2010-2019) = 5.98 times, and (2020- 2024) = 7.89 times. This is because El Paso City is in a desertic region with higher temperatures. Then we can forecast that the City of El Paso, Texas–Cd. Juarez, Chih., will have faster problems with water scarcity, and it is time to act now with useful solutions [2].
Step 3) Define an Action Plan to Improve the Altered Natural Water General Cycle
(Figure 5) The following “five actions” are defined specially for El Paso, TX–Juarez, CHIH, based on the Natural Water General Cycle index that is shown in Figure 5 and explained as follows:
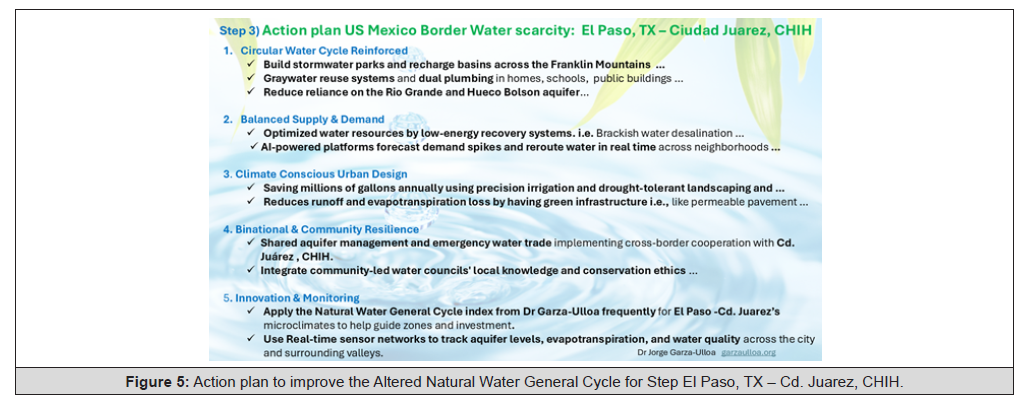
Figure 5:Action plan to improve the Altered Natural Water General Cycle for Step El Paso, TX – Cd. Juarez, CHIH.
Circular Water Cycle is reinforced to help loop rainfall back into aquifers with actions as follows:
i. Build stormwater parks and recharge basins across the Franklin
Mountains and urban zones to help loop rainfall back into
aquifers.
ii. Graywater reuse systems and dual plumbing in homes, schools,
and public buildings.
iii. Build stormwater parks and recharge basins across the Franklin
Mountains and urban zones to help loop rainfall back into
aquifers.
iv. Reduce reliance on the Rio Grande and Hueco Bolson aquifer,
by Shortening the water delay loop.
Balanced supply-and-demand optimization with low-energy recovery systems and actions as follows:
i. Detect and repair all water distribution leakage; in some cities
it reaches 30-40%
ii. AI-powered platforms forecast demand spikes and reroute
water in real time across neighborhoods, agriculture, and industry.
iii. Optimized water resources using low-energy recovery systems.
i.e. Brackish water (slightly salty) desalination from the
Kay Bailey Hutchison plant that supplies up to 25% of potable
water for El Paso, TX.
iv. Remark:
El Paso is home to the world’s largest inland plant with vast brackish groundwater resources that were previously unusable. The Kay Bailey Hutchison (KBH) Desalination Plant filters out the salts and creates a new supply of water. The plant serves as a learning center for desalination research and a model for other inland cities facing diminishing supplies of fresh water.
Climate-conscious urban design to achieve:
i. Saving millions of gallons (or liters) annually using precision
irrigation for drought-tolerant landscaping in residential
zones and public spaces.
ii. Reduces runoff and evapotranspiration loss by having green
infrastructure like permeable pavement and shaded corridors.
Binational & community resilience with actions like
i. Share aquifer management and emergency water trade implementing
cross-border cooperation between El Paso, TEX - Ciudad
Juárez, CHIH
ii. Integrate community-led water councils’ local knowledge and
conservation ethics into planning and monitoring.
Innovation & monitoring applying with actions as follows:
i. Apply the Natural Water General Cycle index (NWGCI) from Dr
Garza-Ulloa in a periodic way for El Paso, TX – Juarez, CHIH ’s
microclimates to help guide zones and investment.
ii. Installing Real-time sensor networks to track aquifer levels,
evapotranspiration, and water quality across the city and surrounding
valleys.
Step 4) Periodic Evaluation of the Impact of Interventions to Improve the Altered Natural Water General Cycle
(Figure 6) Periodic evaluation of the impact of interventions for improving the Natural Water General Cycle Index (NWGCI) also known as the Altered Natural Water Cycle Value (ANWC). Expanding aquifer recharge zones, deploying smart irrigation systems, retrofit urban infrastructure for stormwater capture, and integrate binational water management protocols [15].
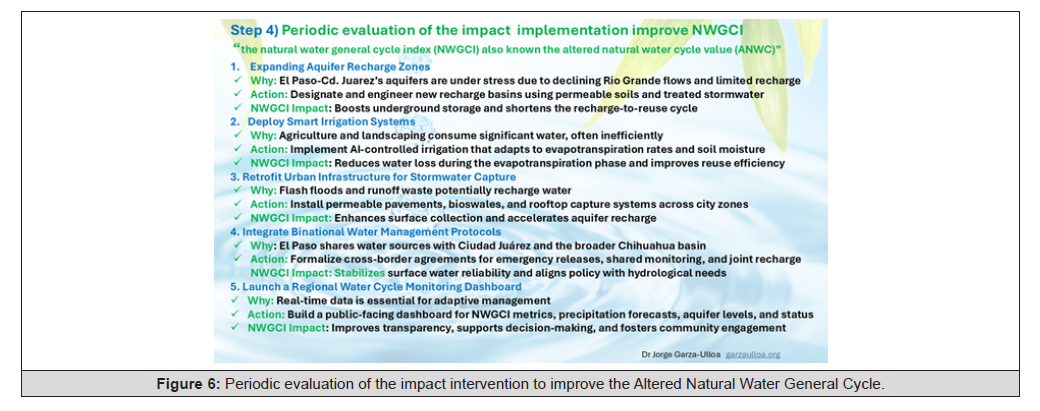
Figure 6:Periodic evaluation of the impact intervention to improve the Altered Natural Water General Cycle.
Launch a regional water cycle monitoring dashboard, explaining each improvement in a simple and clear way, specifying the “why,” “action,” and “NWGCI impact.” These are shown at Figure 6 and explain with detail as follows:.
Expanding Aquifer Recharge Zones
i. Why: El Paso-Cd. Juarez’s aquifers are under stress due to declining
Rio Grande flows and limited natural recharge.
ii. Action: Designate and engineer new recharge basins using
permeable soils and treated stormwater.
iii. NWGCI Impact: Boosts underground storage and shortens the
recharge-to-reuse cycle.
Deploy Smart Irrigation Systems
i. Why: Agriculture and landscaping consume significant water,
often inefficiently.
ii. Action: Implement AI-controlled irrigation that adapts to
evapotranspiration rates and soil moisture.
iii. NWGCI Impact: Reduces water loss during the evapotranspiration
phase and improves reuse efficiency.
Retrofit Urban Infrastructure for Stormwater Capture
i. Why: Flash floods and runoff waste potentially recharge water.
ii. Action: Install permeable pavements, bioswales, and rooftop
capture systems across city zones.
iii. NWGCI Impact: Enhances surface collection and accelerates
aquifer recharge.
Integrate Binational Water Management Protocols
i. Why: El Paso shares water sources with Ciudad Juárez and the
broader Chihuahua basin.
ii. Action: Formalize cross-border agreements for emergency releases,
shared monitoring, and joint recharge projects.
iii. NWGCI Impact: Stabilizes surface water reliability and aligns
policy with hydrological needs.
Launch a Regional Water Cycle Monitoring Dashboard
i. Why: Real-time data is essential for adaptive management.
ii. Action: Build a public-facing dashboard showing NWGCI metrics,
precipitation forecasts, aquifer levels, and intervention
status.
iii. NWGCI Impact: Improves transparency, supports decision-
making, and fosters community engagement
Step 5) Run an AI Forecast of the Impact of Interventions, to Improve the Altered Natural Water General Cycle for Follow-Up of Results Monitored & Define the Outlook for the Target Year.
(Figure 7) Running the AI simulation for the forecast of actions take that will impact water levels, with improvement based on the NWGCI for El Paso. TX – Ciudad Juarez, CHIH [16].
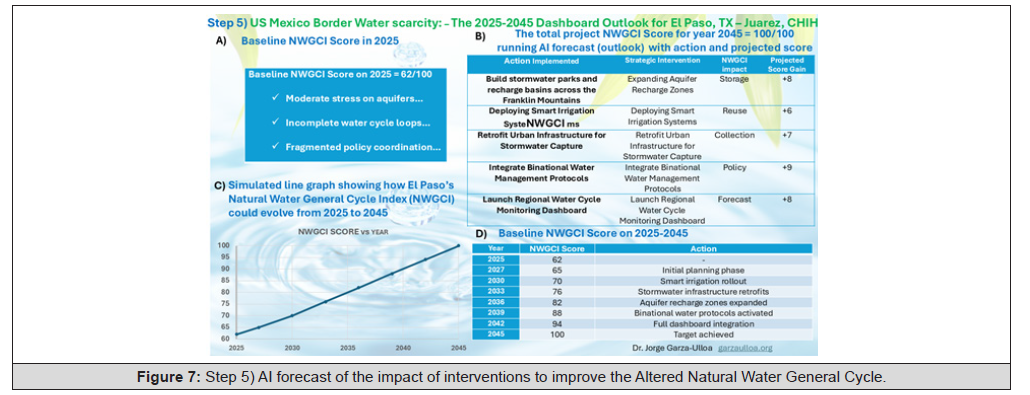
Figure 7:Step 5) AI forecast of the impact of interventions to improve the Altered Natural Water General Cycle.
Then, Having already defined the actions to take in the last section that are indicated in Figure 7. And assuming the actual water situation in the region as:
a. There in 2024/2025 a moderate stress on aquifers at the region
El Paso, TX – Ciudad Juarez, CHIH.
b. The water policy for water scarcity is fragmented and not well
coordinated
c. There are exaggerated values for the NWGCI for the decade
(2000-2024) = 0.1559 that grow from the decade (2000-2009)
=0.0540 as shown on the right side at Figure 4.
The next step is to define the Baseline score: for this, the actual water scarcity situation on the area using a scale from score 0 (no water) to score 100 (water availability goal) based on the NWGCI values obtained from the region of El Paso, TX – Ciudad Juarez, CHIH, and assuming that:
d. The goal of score 100 on the water availability index equal to
the beginning of this century (2000-2009), where the average
temperature was 18.61 °C and the ANWG (2000-2009) was
0.0540 as shown on the right side of (Figure 4),
e. Our water level’s goal must be reached 100% in the year 2045
as indicated with a line chart in (Figure 7B) and the action of
the inflexion points indicated in the table in Figure 7C)
f. The baseline score in 2024/2025 is 62% of 100% in the target
year
g. The total project NWGCI Score for target year of 2045 =
100/100. This target deducted from the AI forecast (outlook)
achieved with actions taken and projected scores that are
shown in Figure 7D).
In summary:
1. The actual score of 62 with the goal of reestablishing the NWGCI to 100 the same of decade (2000-2009) = 0.0540, we need to reach the projected score gain for NWGCI impacts are shown at (Table 5).

Table 5:NWGCI impact Type and Projected Score Gain.
2. The AI simulation line graph shows how El Paso-Cd. Juarez ’s
Natural Water General Cycle Index (NWGCI) could evolve from
2025 to 2045, if full implementation of the strategic actions as
indicated in (Figure 7C)
3. Baseline NWGCI Score from the baseline from 2025 to 2045
indicating the inflexion years and action as shown in (Figure
7D) to reach the NWGCI Score of 100 on 2045
4. Remark:
This is a wonderful methodology that will help the region of El Paso, Tx. – Ciudad Juarez, CHIH to return from 2045 to the weather with general average normal temperature and water level of the year 2000
Outlook 2045 for El Paso, Tx. – Ciudad Juarez, Chih Benefits of a Stable Natural Water General Cycle Index (NWGCI)
(Figure 8) The border region El Paso, Tx. – Ciudad Juarez, CHIH could have the 2045 Outlook only if all necessary actions are well implemented: for the circular water cycle is reinforced, with stormwater parks and recharge basins, balanced water supply & demand, climate-conscious urban design, binational & community resilience and innovation & monitoring. As summarized in Figure 8 and explained as follows:
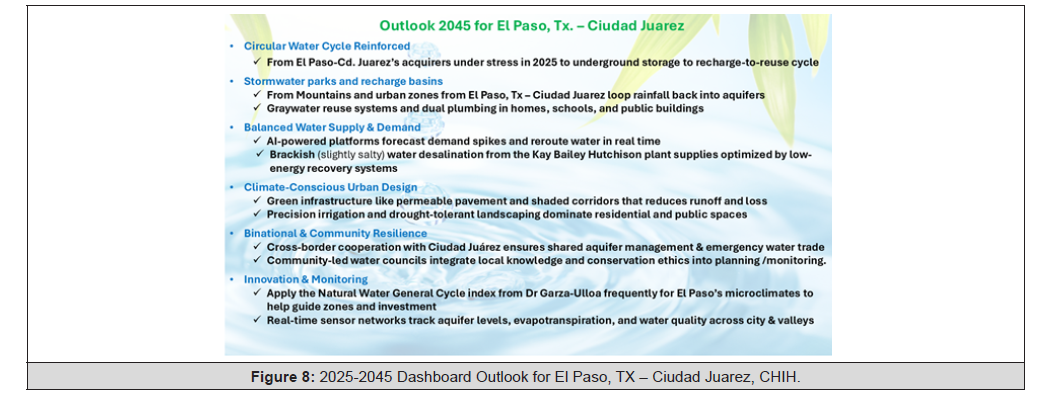
Figure 8:2025-2045 Dashboard Outlook for El Paso, TX – Ciudad Juarez, CHIH.
Circular Water Cycle Reinforced
From El Paso-Cd. Juarez’s acquirers are currently under stress in 2024/2025 to boost underground storage and shorten the recharge- to-reuse cycle in 2025.
Stormwater Parks and Recharge Basins
a. From mountains and urban zones from El Paso, Tx – Ciudad
Juarez loop rainfall back into aquifers.
b. Graywater reuse systems and dual plumbing in homes, schools,
and public buildings shorten the water delay loop and reduce
reliance on the Rio Grande (Rio Bravo) and Hueco Bolson aquifer.
Balanced Water Supply & Demand
a. AI-powered platforms forecast demand spikes and reroute
water in real time across neighborhoods, agriculture, and industry.
b. Brackish (slightly salty) water desalination from the Kay Bailey
Hutchison plant supplies up to 25% of potable water, optimized
by low-energy recovery systems.
Climate-Conscious Urban Design
a. Green infrastructure like permeable pavement and shaded
corridors that reduces runoff and evapotranspiration loss.
b. Precision irrigation and drought-tolerant landscaping dominate
residential and public spaces, saving millions of gallons
annually.
Binational & Community Resilience
a. Cross-border cooperation with Ciudad Juárez ensures shared
aquifer management and emergency water trade.
b. Community-led water councils integrate local knowledge and
conservation ethics into planning and monitoring.
Innovation & Monitoring
a. Apply the Natural Water General Cycle index from Dr Garza-
Ulloa frequently for El Paso’s microclimates to help guide
zones and investment. To refine the Natural Water General Cycle
guiding zoning and investment.
b. Real-time sensor networks track aquifer levels, evapotranspiration,
and water quality across the city and surrounding valleys.
c. Remarks:
It could be a dream-time machine, that allows us to go back to the good all time of abundant water and green areas at the border region El Paso, Tx. – Ciudad Juarez, CHIH!
Conclusion Water Analysis Scarcity Based on NWGCI for El Paso, Tx. – Ciudad Juarez, CHIH
The five steps for water scarcity analysis show the analysis of water scarcity for El Paso, TX. – Ciudad Juarez, CHIH. are valid if they are well implemented as follows:
Climate & Hydrological Characteristics
They are shown in Figure 4 and documented in section 3. - Step 1) Climate & hydrological characteristics of El Paso, TX – Juárez, CHIH. This border region settles within the Chihuahuan Desert and falls under USD hardiness zone8a characterized by hot summers, mild winters and low annual rainfall.
Altered Water Cycle Variables & Charts:
a. The calculation for the state of Texas is shown on Figure 4
left side, its altered water cycle circle charts indicate decade
(1900-1909) with ANWGC(D)=1.197 and (2020-2024) with
ANWGC(D)=0.0337
b. The calculation for the EL Paso, TX – Juarez, Chih. shown on
Figure 4 right side, its altered water cycle circle charts indicate
decade (1900-1909) with ANWGC(D)=0.0090 and (2020-
2024) with ANWGC(D)=0.1559
c. The growing Rate shown in Figure 4 center, indicates exponential
behavior with values: decade (2000-2009) = 2.74, decade
(2010-2019) = 5.89 and partial decade (2020-2024) = 7.90.
The resulting values are the time grown with respect to reference
decade (1895-1895)
d. Remark:
The Altered Natural Water General Cycle for any Decade ANWGC( D) calculated is also identified as Natural Water General Cycle Index (NWGCI) used in the rate that indicated that the expected value for decade (2020-2029) greater than 10 times!
Defining Suitable Actions Plan:
The action plan is shown in Figure 5 and explain in section 3 -
Step 3) Define an action plan these are:
a. Circular water cycle reinforced to help loop rainfall back into
aquifers
b. Balanced supply & demand optimization by low-energy recovery
systems
c. Climate-conscious urban design
d. Binational & community resilience
e. Innovation & monitoring
Periodic Evaluation of the Impact of Interventions:
The recommendations are periodic partial weekly, register monthly evaluations and general evaluation yearly to feedback on the impact of interventions that improve the Natural Water General Cycle Index (NWGCI) or (ANWC) indicated in Figure 6 mainly, that focus on the ones that make impacts explaining “Why, Action and NWGI impact i.e.,
a. Expanding aquifer recharge zones, deployment of smart irrigation
systems
b. Deploy Smart Irrigation Systems
c. Retrofit urban infrastructure for stormwater capture
d. Integrate binational water management protocols
e. Launch a regional water cycle monitoring dashboard indicating
“why”, “specific action” and the “NWGCI impact”
Run AI Forecast Based on Value Monitored, and Define the Outlook for the Target Year
Calculated for Our Goal of Correcting the NWGCI
Additionally, an AI timeline implementation is shown in table
6 in 4 phases:
Phase 1: preparations 2025–2028, Phase 2: Recharge 2028–
2032,
Phase 3: Order & Expand2032–2038 and Phase 4: Integration
and restoration 2038–2045Ad
Timeline for El Paso, TX – Ciudad Juarez ’S Water Resilience (2025–2045)
(Table 6). Final Remark:
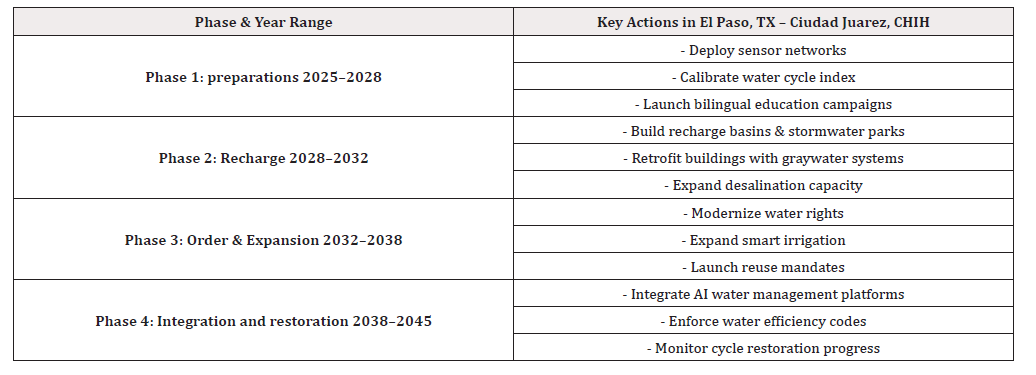
Table 6:Timeline for El Paso, TX – Ciudad Juarez ’s Water Resilience (2025–2045).
The methodology explain here can be used in any other USMexico border regions as shown in Figure 3 and any border regions of countries around the world
Notices
Knowledge and best practices in this field are constantly changing as new research and experience broaden our understanding. Changes in research methods, professional practices, or other changes may be necessary. To the fullest extent of the law, neither the publisher nor the authors, contributors, or publishers assume any liability for any injury and/or damage to persons or property as a matter of product liability, negligence, or otherwise, or for any use or operation of any method, product, instruction, or idea contained herein.
Acknowledgments
None.
Conflict of Interest
None.
References
- Garza Ulloa Jorge (2025) Perspective Chapter: Shortening the Natural Altered Water Cycle by Global Warming, Intech open London, UK Published: DOI: 10.5772/intechopen.1006898. Link Perspective Chapter: Shortening the Natural Altered Water Cycle by Global Warming | IntechOpen.
- Garza Ulloa Jorge (2025) How to Measure and Evaluate Water Availability in a Region Based on the Natural Water Cycle. Biomed Sci & Res 27: 2.
- Melissa Diehl (2025) The Other Border Battle: Water Scarcity on the U.S.-Mexico Line. Published on line by water treatment industry. Link: The Other Border Battle: Water Scarcity on the U.S.-Mexico Line - Water Treatment 411.
- Picture generated by AI chat GPT Link: https://tse4.mm.bing.net/th/id/OIG3.kTSwM_TKZDd.IcKJ4SD1?r=0&pid=ImgGn.
- Picture generated by Microsoft Copilot, chat GPT Link: https://tse1.mm.bing.net/th/id/OIG3. 6TDi51frAnYf.rrAQyRL?r=0&pid=ImgGn].
- Soo Kim (2025) Map reveals "accelerating" water loss affecting 40 million American, publish on line on Newsweek, Link: Map reveals "accelerating" water loss affecting 40 million Americans.
- (2025) Department of Water Resources, Natural Resource Agency. State of California. Published online, link: ca.gov/-/media/DWRWebsite/WebPages/Programs/GroundwaterManagement/Bulletin118/Files/StatewideReports/GWU2013_Ch_2_Statewide_Final.pdf.
- (2025) California Department of Water resources, California’s Ground water live current conditions, October. Link: https://sgma.water.ca.gov/CalGWLive/.
- (2025) NASA earth observatory, link: Arizona’s Declining Groundwater.
- (2025) Picture from NASA earth observatory, link https://earthobservatory.nasa.gov/images/154567/arizonas-declining-groundwater.
- Thomas Nelson (2025) Gardening Expert, El Paso, TX USDA Hardiness Zone Map & Planting Guide, Link: El Paso, TX USDA Hardiness Zone Map & Planting Guide - The Garden Magazine.
- (2025) Review report fomr El Paso Water, web page, link: El Paso Water | Our Aquifers.
- (2025) Extreme Weather Watch web page, link: Average Temperature in Texas by Year.
- (2025) Extreme Weather Watch web page, link: Average Temperature in El Paso by Year.
- El Paso Water (2025) web page Desalination, Link: El Paso Water | Desalination.
- Wood Duncan (2025) World Economic Forim, web page, Addressing Northern Mexico's water-energy nexus amid an industrial boom, Link: Northern Mexico's Water-Energy nexus amid industrial boom | World Economic Forum.




 We use cookies to ensure you get the best experience on our website.