Research Article 
![]() Creative Commons, CC-BY
Creative Commons, CC-BY
A Web‑Based System for Automated Assessment of Therapeutic Outcomes Using Hematological Data
*Corresponding author:Valentin V Fursov, N.I. Pirogov Russian National Research Medical University, Moscow, Russia.
Received:March 27, 2026; Published:April 08, 2026
DOI: 10.34297/AJBSR.2026.30.003972
Abstract
The study is devoted to the automation of assessing the effectiveness and individual tolerability of therapeutic interventions based on hematological parameters. The aim of the study is to develop an algorithm for processing histograms of blood cell size distributions to assist in the interpretation of cellular changes arising as a result of therapy. An algorithm for histogram analysis is proposed, enabling the identification of characteristic cellular phenomena. A specialized web-based application for the processing, storage, and systematization of patients’ hematological data has been developed. It is shown that the implementation of standardized and automated approaches contributes to increased speed and quality of hematological research.
Keywords:Hematological data, Cell distribution analysis, Spline approximation, Web application, Data processing automation, Medical information systems, Hematological, Algorithm, Automation, Histogram, Therapy monitoring
Introduction
A pressing issue in modern medicine is the development of objective methods for evaluating the effectiveness and individual tolerability of various therapeutic methods, such as chemotherapy, photodynamic therapy, ozone therapy, and intravenous administration of antibiotics and immunotropic drugs. To solve this problem, the cellular composition of blood is analyzed using automatic hematology analyzers that operate on the impedance principle. This principle is based on measuring the change in resistance as blood cells pass between two electrodes [1]. These devices construct histograms of the distribution of blood cells by size, with the analysis of the histogram of leukocyte distribution being of greatest interest for diagnosis.
Problem Statement
In accordance with the methodology developed by Dr. M.E. Bogdanov, blood samples are taken from the patient before and after therapeutic intervention. A comparative analysis of the histograms obtained allows the key cellular phenomena arising in response to therapy to be identified and quantitatively described. Currently, this analysis is performed manually in the customer’s laboratory using Excel and Access programs, which is a labor-intensive process prone to subjective errors. Therefore, there was a need to develop a software package that automates patient records and performs an objective analysis of leukocyte distribution histograms to identify and quantitatively assess diagnostically significant phenomena. The blood tests obtained are compared in terms of the absolute content of leukocytes, erythrocytes, and thrombocytes. Measurements of their quantities can have direct diagnostic value. For example, studies by the National Specialized Hospital for Active Treatment of Hematological Diseases in Sofia, Bulgaria, demonstrate how therapy has contributed to a significant reduction in the number of large erythrocyte aggregates in patients with chronic lymphocytic leukemia [2]. Comparing histograms of leukocyte size distribution allows us to identify and quantitatively describe the changes occurring in the blood during therapeutic exposure. The following physiological phenomena can be distinguished:
a) Aggregation of erythrocytes with the formation of “coin stacks” as a result of the release of antigens into the blood
that irritate the patient’s B-lymphocytes. This phenomenon
manifests itself in the appearance of additional “cells” in the
fraction of small and medium-sized lymphocytes. The severity
of erythrocyte aggregation can serve as an indicator of the
degree of damage to cells in the bloodstream [3].
b) Destruction of certain fractions of leukocytes
(lymphocytes, monocytes, granulocytes). This phenomenon
is characterized by a decrease in cells in the corresponding
leukocyte fractions. Since defective and pathologically altered
cells are destroyed first, this phenomenon allows us to clarify
the type of pathological process occurring in the patient’s body
[4].
c) Neutrophil degranulation. This is an indicator of the
functional activity of innate immune cells. It manifests itself
in the form of a decrease in granulocyte volume. Changes in
the mechanisms of neutrophil destruction are associated with
pathologies such as cancer and autoimmune diseases [5].
d) Release of additional leukocytes from the depot into the
bloodstream. This indicates the presence of functional reserves
in the patient’s immune system [6]. It manifests itself as an
increase in the concentration of granulocytes in a blood sample
obtained after therapeutic intervention.
Description of the Algorithm
The initial data obtained from the device is a discrete set of points (χi ,yi ), where xi is the cell volume, and yi is the number of cells of the i-th volume. Two types of histograms are studied: a control sample obtained from the analysis of the patient’s blood before therapeutic intervention and an experimental sample obtained after therapeutic intervention. As the practice of some clinical laboratories and veterinary clinics shows, histograms allow you to quickly see abnormalities and are an important visual tool [7,8]. The initial data are presented in (Figure 1).

Figure 1:Leukocyte (WBCe/WBCa) and erythrocyte histograms (RBCe/RBCa) before and after therapeutic intervention.
Each analysis is divided into two classes: erythrocyte histogram and leukocyte histogram. To account for differences in the volume of blood collected, each analysis is normalized by volume. The leukocyte histogram is used for direct interpretation of the effect of therapeutic exposure. At first glance at the leukocyte histogram, two clearly defined maxima and minima can be seen. The first maximum, in the area of smaller cells, is the peak of the lymphocyte fraction. The global minimum corresponds to the monocyte fraction and aggregated lymphocytes. The second maximum, in the area of larger cells, is the peak of the granulocyte fraction.
The algorithm underlying the calculation module is shown in (Figure 2). The task of the calculation module is to generate two difference diagrams: the first, step-by-step, shows the difference between the experimental and control samples for cells of each individual size; the second, a segmental diagram, shows the difference in blood segments. The method of dividing the histogram into sectors is described below. Differential diagrams are designed to help recognize and interpret the blood’s response to therapeutic intervention. Since blood samples vary in mass, appropriate adjustments must be made. The leukocyte histogram data is converted so that the area under the graph equals the calculated area based on the reference leukocyte, reference erythrocyte, and experimental erythrocyte histogram data. The Simpson method scipy.integrate.simpson is used to calculate the area under the curves.

Figure 2:Block diagram of the hematological data processing algorithm.
Next, the original data is approximated. The approximation of experimental data using various functions was investigated, including spline interpolation and polynomials of various orders, including Chebyshev polynomials. (Figure 3) shows the approximation of data using various methods. As a result, Chebyshev polynomials of the 11th degree were selected, since they significantly smooth out data fluctuations and allow the extraction of extrema close to the parameters of normal distributions of fractions [9,10]. This was implemented using the chebfit and chebval functions of the numpy.polynomial.chebyshev library. The resulting smooth continuous function (Figure 4) allows us to use a simple and effective algorithm for finding extrema by comparing the values of the function at neighboring points. Local extrema were searched for using the argrelextrema function from the scipy.signal library. The function allows finding both local minima and local maxima with flexible parameter settings. The specified methods from the SciPy and Numpy libraries of the Python programming language were used because they have proven themselves to be powerful and high-performance computational tools [11].

Figure 3:Comparison of approximation methods using the example of a “spiked” leukocyte histogram.

Figure 4:Approximation of the original data with an 11th-order Chebyshev polynomial.
Two maxima and one minimum between them are then selected from the obtained extrema. The selection of specific points is left to the discretion of the expert; the selection interface is shown in (Figure 5). The obtained points are the boundaries separating the leukocyte fractions.
Each fraction is then divided into a certain number of equal intervals, the number of which can also be varied by the expert; the interface is shown in (Figure 6). An example of such a division is shown in (Figure 7).
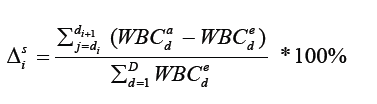
The final stage of the algorithm is the construction of two types of difference diagrams: a general step-by-step difference diagram and a sector difference diagram. The general step-by-step difference diagram represents the difference between the leukocyte histograms before and after therapeutic intervention at each point in terms of cell size:

Where  is the number of leukocytes in the post-therapeutic
sample at point d, and
is the number of leukocytes in the post-therapeutic
sample at point d, and  is the number of leukocytes in the
reference sample.
is the number of leukocytes in the
reference sample.
The sector difference diagram is calculated using the following formula:
The resulting histograms, shown in (Figure 8), are intended to assist in studying the effect of therapeutic exposure on the patient’s body and adjusting the treatment strategy.
The numerical values of the differences by sector are presented in the table (Figure 9). Red color indicates negative values, green color indicates positive values. The color is more intense, the higher the absolute value of the difference by sector.

Figure 5:Interface for selecting key extrema.

Figure 6:Example of selecting key extremes and dividing fractions into intervals.

Figure 7:Example of selecting key extremes and dividing fractions into intervals.

Figure 8:Stepwise and sectoral difference diagrams.

Figure 9:Table of sector differences.
Technical Implementation
Web architecture was chosen for the implementation of the complex, ensuring cross-platform compatibility and easy access from any workstation in the laboratory. This approach is widely used for the transition from paper-based accounting to an automated system [12]. (Figure10) shows a diagram of the interaction between the system components. The software complex for laboratory diagnostics is built on a client-server model and is divided into two large interconnected parts: an internal application for the laboratory and a public application for patients. The internal application provides a complete data processing cycle. It includes the following modules:

Figure 10:Diagram of the interaction between the components of the software complex.
a) The patient accounting module is designed to maintain a
centralized electronic file. It allows you to register, search, and
manage patient data.
b) The cytometer data download module provides direct
integration with laboratory equipment.
c) The analytical module performs primary analysis, curve
smoothing, peak search and identification, and statistical
evaluation of results.
d) The visualization module displays distribution
histograms, allows you to manage the division of histograms
into sectors, and is responsible for generating reports.
The public application provides patients with secure access
to test results and helps maintain feedback with doctors. It
includes the following modules:
a) The authorization module provides secure user login to
the system.
b) The data exchange model provides patients with access
to their medical history, test results, and doctors’ conclusions.
It also allows them to send information about their well-being
and the results of additional tests.
The backend of both applications is implemented on ASP.NET Core, provides a REST API for the client, con-tains business logic, and implements the described mathematical methods. The frontend for the internal application was created using Blazor WebAssembly, which allows for a minimalistic and functional interface. For the frontend of the public application, it was decided to use the Vue.js framework. It provides a wide range of functionality and supports a modular structure. This is especially important for projects that require constant updating and expansion of functionality [13]. Although the JavaScript programming language can lead to data type issues during execution, it greatly speeds up development and provides greater flexibility [14]. Data storage is implemented using Entity Framework Core as an ORM for working with the PostgreSQL relational database. The software complex is deployed in the cloud on an Nginx server. It was chosen because it has open source code and a wide range of capabilities, including reverse proxying, load balancing, and proxy caching [15].
Designing a New Database and Migrating Data
The laboratory, which is the customer for this development, uses a Microsoft Access database to store analysis data. This database cannot cope with the current volume of data, is poorly structured, and is not suitable for use in the software complex. It was decided to design a new database for PostgreSQL, taking into account the new requirements, and to migrate the existing data. The new model includes all the necessary entities and demonstrates a clearer division of responsibilities. Separating patient personal data and specific examination data, as well as moving microscopic/ cytometric measurements to a separate table, improves normalization, reduces duplication, and simplifies the expansion of the schema for new types of studies [16]. Data obtained from cytometers and laboratory blood tests are characterized by a large number of quantitative indicators and parameters, which requires strict normalization and maintenance of integrity [17]. In the new scheme, such data is grouped by thematic entities (general patient information, visit information, specific test results), which facilitates the use of standardized encodings, reuse of results, and construction of complex samples for statistics and machine learning [18].
In practice, data migration was performed using Python scripts, which is consistent with current recommendations for programmable data transfer from Access to PostgreSQL [19]. This approach allows you to sequentially: read data from the original Access tables, transform it according to the new schema: distribute fields across normalized tables, convert types and values to uniform formats, and safely load them into PostgreSQL with error checking [20].
The following algorithm has been developed to ensure seamless
migration of the existing database.
a) Analyze the existing MS Access schema. Create a schema
for the PostgreSQL database based on existing and new
requirements.
b) Performing the initial data transfer. During this operation,
the Access database is switched to read-only mode to ensure
data consistency. All changes made in Access during the transfer
are recorded.
c) Setting up a process for regular synchronization of
changes. Applications are switched to parallel mode with both
databases, ensuring that new data is written only to PostgreSQL,
while maintaining read access from both DBMSs.
d) Performing data integrity checks. Testing query
performance. Implementing backup.
e) Switching all modules to use the new DBMS. Short-term
support for parallel access for a smooth transition.
f) Final synchronization and data verification. Complete
cessation of work with the Access database.
Results
A working prototype of the system has now been developed.
It has been tested on historical laboratory data. It has been
confirmed that the algorithm correctly performs approximation,
peak identification, and calculation of differences between
samples. A database is being developed to support the new system
requirements. An algorithm has been developed to migrate data
from the existing database to the new one.
Practical benefits:
a) Reduced labor costs for data processing and analysis.
b) Improved accuracy of research results and their analysis.
c) Standardization of data processing and analysis.
d) Centralized storage of test results and patient data.
Project development prospects:
a) Implementation of machine learning methods for
classifying types of immune response based on accumulated data.
b) Development of a module for statistical evaluation of the
significance of differences obtained by sector.
Conclusion
The described software complex successfully solves the problem of automating the labor-intensive process of analyzing hematological data. The use of mathematical methods of approximation and function analysis made it possible to formalize and make reproducible a key stage of the study – the quantitative assessment of the effect of various therapeutic methods on the cellular composition of blood. The introduction of the web application into the practice of this immunological laboratory and similar ones will not only speed up research, but also increase the reliability and standardization of the results obtained, adjust individual patient treatment trajectories, and increase its effectiveness. This is an important contribution to the development of modern digital medicine and personalized treatment methods.
Funding
No Funding
Acknowledgments
Prof. Dr. Eleonora M. Koltsova, Russian Federation, are to be sincerely thanked for their kind assistance with preparation of a manuscript, consultations and for their encouraging comments on this work.
Conflicts of interest
No conflicts of interests of any sort beyond.
Informed Consent
none to declare.
Data Availability
None to declare.
References
- Lehner J, Greve B, Cassens U (2007) Automation in Hematology.
- Alexandrova Watanabe A, Abadjieva E, Gartcheva L, Langari A, Ivanova M, et al. (2025) The Impact of Targeted Therapies on Red Blood Cell Aggregation in Patients with Chronic Lymphocytic Leukemia Evaluated Using Software Image Flow Analysis. Micromachines (Basel) 16(1): 95.
- Baskurt OK, Meiselman HJ (2013) Erythrocyte aggregation: basic aspects and clinical importance. Clinical hemorheology and microcirculation 53(1-2): 23-27.
- Raskin RE, Latimer KS, Tvedten H (2009) Leukocyte disorders. Small animal clinical diagnosis by laboratory methods: 63.
- Pérez Figueroa E, Pablo Álvarez Carrasco, Enrique Ortega, Carmen Maldonado Bernal (2021) Neutrophils: many ways to die. Frontiers in immunology 12: 631821.
- Steele RW, CR Steele, NS Pilkington, RK Charlton (1987) Functional capacity of marginated and bone marrow reserve granulocytes. Infection and immunity 55(10): 2359-2363.
- Athanasiou LV, Tsokana CN, Pardali D, Moraitou KA (2018) Histograms of Complete Blood Counts in Dogs: Maximizing Diagnostic Information. Topics in Companion Animal Medicine 33(4): 141-146.
- Saito R, Yokoyama H, Meguro K, Ohba Y, Izumi Y, et al. (2018) Rapid diagnosis of mixed phenotype acute leukemia after identifying a blood histogram abnormality. Practical Laboratory Medicine 12: e00101.
- Virtanen P, Gommers R, Oliphant TE, Matt Haberland, Tyler Reddy, et al. (2020) SciPy 1.0: fundamental algorithms for scientific computing in Python. Nature Methods 17(3) 261-272.
- Al Ghrairi AHT (2021) An Application of Web-based E-Healthcare Management System.
- Saveliev AE, Rakhmatullina LSh (2024) Vue.js: a universal tool for creating web applications. Topical issues of science 2024: collection of articles of the VI International Scientific and Practical Conference. Penza.
- Ocariza F (2013) An empirical study of client-side JavaScript bugs. ACM/IEEE International Symposium on Empirical Software Engineering and Measurement 55-64.
- Fjordvald MB, Nedelcu C (2018) Nginx HTTP Server: Harness the power of Nginx to make the most of your infrastructure and serve pages faster than ever before. Packt Publishing Ltd.
- Vadlamani V (2024) PostgreSQL Skills Development on Cloud: A Practical Guide to Database Management with AWS and Azure. Springer Nature.
- Fenech M, Morley AA (1986) Cytokinesis-block micronucleus method in human lymphocytes: effect of in vivo ageing and low dose X-irradiation. Mutat Res 161(2): 193-198.
- Khadidos A (2022) Semantic Normal Form for Performance-Critical Databases. International Conference on Flexible Electronics for Electric Vehicles. Singapore, Springer Nature Singapore: 473-483.
- Rabelo L, Sodré D, Balcázar ODA, Rosário MF, Guimarães Costa AJ, et al. (2025) An efficient Python tool and user-friendly web-form for mining mitochondrial and chloroplast sequences, taxonomic, and biodiversity data. Ecological Informatics 85.
- Viloria A, Acuña GC, Franco DJA, Hernández Palma H, Fuentes JP, et al. (2019) Integration of Data Mining Techniques to PostgreSQL Database Manager System. Procedia Computer Science 155: 575-580.
- Fang T, Leng XL, Song CQ (2003) Chebyshev polynomial approximation for dynamical response problem of random system. Journal of Sound and Vibration 266(1): 198-206.
- Huber MF (2013) Chebyshev polynomial Kalman filter. Digital Signal Processing 23(5): 1620-1629.


 We use cookies to ensure you get the best experience on our website.