
Research Article 
 Creative Commons, CC-BY
Clinical Determinants and Machine Learning Prediction of Exercise Induced ST-Segment Depression
*Corresponding author:Umair Arif, School of Sciences, The University of Faisalabad, Faisalabad, Pakistan.
Received:November 02, 2026; Published:November 12, 2026
DOI: 10.34297/AJBSR.2026.32.004215
Abstract
Background: The magnitude of exercise-induced ST-segment depression (oldpeak) may provide clinically relevant information beyond conventional positive/negative exercise-test classification. However, its clinical determinants and predictability from routine variables remain insufficiently characterised.
Objective: To identify factors associated with oldpeak and evaluate the predictive performance of machine-learning regression models.
Methods: This retrospective secondary analysis used the UCI Heart Disease dataset, comprising 920 records from four centres. After excluding records with missing oldpeak, 858 patients were analysed. Associations were examined using Spearman correlation and Kruskal–Wallis tests with epsilon-squared, applying Holm correction. Five regression models (linear, ridge, random forest, gradient boosting, and support vector regression) were evaluated against a mean-baseline model using repeated five-fold cross-validation. Performance was assessed using mean absolute error (MAE), root mean squared error (RMSE), and R². Permutation importance and sensitivity analysis of ST-segment slope were also examined.
Results: Age, resting blood pressure, maximum heart rate, sex, chest-pain type, resting ECG, exercise-induced angina, and ST slope were significantly associated with oldpeak. The largest effects were observed for ST slope (ε²=0.193), exercise-induced angina (ε²=0.182), and chest-pain type (ε²=0.122). Support vector regression achieved the best overall performance (MAE=0.716 mm; RMSE=0.966 mm; R²=0.206). Exercise-induced angina was the most influential predictor. Including ST slope improved performance in the available-case sensitivity analysis (maximum R²=0.252).
Conclusions: Routine clinical variables provide modest predictive information about oldpeak, but substantial unexplained variation limits individual-level prediction. External validation and richer clinical data are required before clinical application.
Keywords:Exercise electrocardiography, ST-segment depression, Oldpeak, Machine learning, Permutation importance, coronary artery disease
Introduction
Exercise electrocardiography remains a widely used and accessible method for evaluating patients with suspected or known coronary artery disease, and ST-segment depression is one of its most closely examined measurements [1,2]. Results have traditionally been labelled simply as positive or negative, but this dichotomy discards information. The predictive value of exerciseinduced ST depression for coronary disease depends on both the degree of depression and the patient’s pretest risk, so results are better interpreted as a continuum of risk than as a binary finding [3,4].
The magnitude of ST depression also carries prognostic meaning. Profound depression of 3 mm or more during treadmill testing has been linked to an adverse long-term prognosis in coronary heart disease, particularly a greater frequency of sudden cardiac death. Even among patients with non-ischaemic stress echocardiograms, ST depression of about 1.5 mm or more identified a group with poorer outcomes [5]. Depression appearing only during recovery has been reported to have diagnostic and prognostic power largely similar to depression arising during exertion. Together, these findings justify treating oldpeak, the dataset’s measure of ST depression induced by exercise relative to rest, as a quantitative clinical signal rather than a simple indicator [6, 7]. Despite this importance, relatively little is known about which routinely recorded characteristics are associated with how much ST depression a patient develops [8]. Age, sex, chest-pain, resting electrocardiographic abnormalities, exercise-induced angina, blood pressure, peak heart rate and the slope of the ST segment at peak exercise may each plausibly relate to the degree of depression, through underlying ischaemia or through non-ischaemic factors [9- 12]. Nevertheless, the strength and direction of these relationships may differ across variables, and associations observed individually may not persist when other characteristics are considered. Identifying these relationships is therefore important for describing the clinical factors associated with oldpeak and determining whether routinely available information can help predict its magnitude. Machine learning regression provides an additional approach to investigating these relationships. Unlike methods that focus primarily on statistical association, predictive models can evaluate how accurately a set of clinical variables estimates a continuous outcome in previously unseen observations [13]. Linear and ridge regression provide interpretable reference models for assessing approximately linear relationships, while random forest and gradient boosting regression can accommodate nonlinear patterns and interactions. Support vector regression offers another approach to modelling potentially nonlinear relationships through kernel functions [14-16]. Comparing these methods under a consistent validation framework can help establish whether more flexible algorithms offer meaningful predictive improvements over simpler regression approaches. However, predictive performance must be evaluated using out-of-sample measures, such as mean absolute error (MAE), root mean squared error (RMSE), and the coefficient of determination R2, rather than inferred from model complexity alone [17,18]. Despite the clinical relevance of exercise-induced ST-segment depression, evidence remains limited regarding the predictive value of routinely recorded clinical and demographic variables for estimating its continuous magnitude [19,20]. Analyses based on categorical severity groups may obscure variation within categories, while individual association tests do not establish the combined predictive performance of multiple variables. A systematic evaluation of clinical associations, regression performance, predictor importance, and sensitivity to slope availability is therefore needed to distinguish statistically significant relationships from meaningful predictive information. To address these gaps, this study investigates clinical and demographic factors associated with oldpeak and evaluates the predictive performance of regression models using routinely available patient characteristics. The specific objectives are to describe patient characteristics across none, mild, and marked oldpeak severity groups; quantify associations between individual predictors and oldpeak using appropriate statistical tests, effect sizes, and Holm correction for multiple comparisons; compare regression models using repeated cross-validation and MAE, RMSE, and R2 and identify influential predictors through permutation importance. A sensitivity analysis additionally examines model performance in relation to the availability and inclusion of the ST-segment slope. Recorded heart disease status is excluded from the predictor set to focus on estimating the ST-segment response from clinical characteristics rather than relying on the recorded diagnostic outcome. By integrating conventional statistical analysis with out of sample predictive evaluation, this study aims to clarify the clinical information associated with oldpeak and establish the extent to which routine variables can support its prediction, while recognising the limitations of model based estimates and the need for further validation before clinical application.
Methodology
Study design and data source
This was a retrospective secondary analysis of the publicly available UCI Heart Disease dataset, which combines records from four sources: Cleveland, Hungary, Switzerland and the VA Long Beach. The combined file contained 920 patient records. The outcome was exercise-induced ST-segment depression (oldpeak), a continuous measurement in millimetres defined as ST depression induced by exercise relative to rest. The study had two components: a statistical analysis of the association between clinical variables and oldpeak, and a machine-learning regression analysis of how accurately oldpeak can be predicted from those variables. Because the data are publicly available and de-identified, this analysis did not require ethical approval.
Data quality assessment and preprocessing
Oldpeak was treated as a continuous outcome. Sixty-two records (6.74%) had no oldpeak value and were excluded, leaving 858 patients for analysis. The primary predictors were age, resting blood pressure (trestbps), serum cholesterol (chol), maximum heart rate achieved (thalch), sex, chest-pain type (cp), fasting blood sugar (fbs), resting electrocardiographic result (restecg) and exerciseinduced angina (exang). The ST slope at peak exercise (slope) was analysed separately because of its extensive missing data. Several variables were excluded from all models. Record identifier and data source were removed because they carry no clinical information. The recorded diagnosis (num) was excluded so that the models describe how clinical characteristics relate to ST response without using disease status, which prevents information leakage. The variables ca and thal were excluded because of high proportions of missing values (66.41% and 52.83%, respectively). The dataset was examined for duplicate records, missing values and physiologically implausible measurements. No exact duplicate rows were found. Zero values of serum cholesterol (157 records) and resting blood pressure (1 record) were considered physiologically implausible and were recoded as missing. Missingness in predictors was handled differently for the descriptive and modelling analyses. In descriptive tables, missing categorical values are shown as a separate “Missing” category and excluded from hypothesis tests. In the machine-learning pipelines, all imputation, encoding and scaling steps were fitted only on training data within each cross-validation fold, to prevent leakage. Missing numeric values were imputed with the training-fold median, with missing-value indicators added, and numeric variables were then standardised. Missing values of the categorical predictors (fbs, restecg and exang) were coded as an explicit “Missing” category before one-hot encoding. Slope was missing for 247 patients (28.8%), and 237 of these belonged to the group with no ST depression (62.0% of that group, versus 1–3% in the other groups). Because this pattern is likely to reflect datacollection practice rather than physiology, a “Missing” category for slope was not used. Slope was instead assessed only in a sensitivity analysis restricted to patients with an observed value shown in (Figure 1).
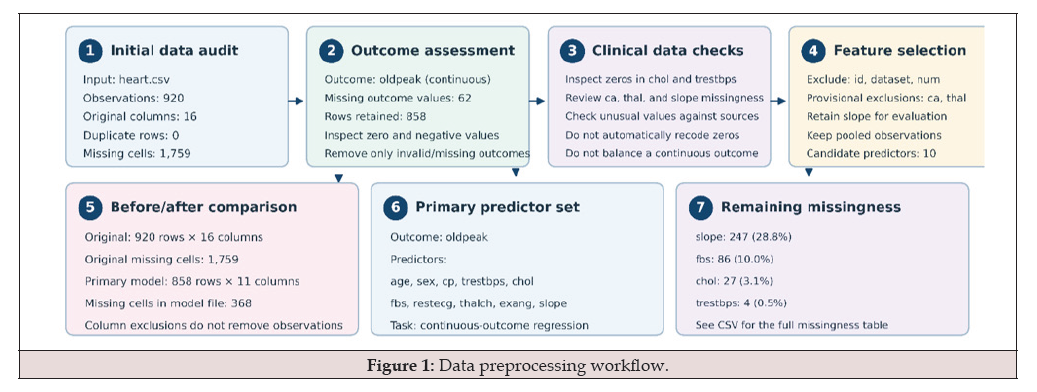
Figure 1:Data preprocessing workflow.
Statistical analysis
Patients were classified by oldpeak severity into three groups: none (≤0 mm), mild (>0 to <2 mm) and marked (≥2 mm). Continuous variables are presented as median [interquartile range] and compared across groups with the Kruskal–Wallis test. Categorical variables are presented as numbers (column percentages) and compared with the chi-square test using patients with observed values. The association between each predictor and oldpeak was quantified as follows. For continuous predictors, we used Spearman’s rank correlation coefficient (ρ). For categorical predictors, we used the Kruskal–Wallis test, with epsilon-squared (ε² = H/ (n − 1)) as the effect size; for binary variables this is equivalent to the Mann– Whitney U test. P-values for the ten predictor comparisons were adjusted with Holm’s method, and two-sided adjusted p-values below 0.05 were considered statistically significant.
Machine-learning models
The regression models were selected to predict continuous oldpeak values from clinical and demographic characteristics. Linear regression, ridge regression, random forest regression, gradient boosting regression, and support vector regression (SVR) were evaluated against a mean-baseline model to compare linear, regularized, and nonlinear prediction approaches.
Linear Regression: Linear regression [21] was used as an interpretable reference model to estimate the linear association between the predictor variables and oldpeak. The predicted outcome for observation i is expressed as
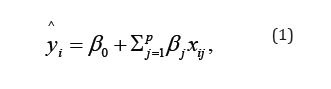
where  denotes the predicted oldpeak, xij is the value
of predictor j for observation i, β0
is the intercept, βj
is the
corresponding regression coefficient, and p is the number of
predictors. The coefficients are estimated by minimizing the sum
of squared residuals:

Ridge Regression: Ridge regression [15] extends ordinar linear regression by adding an L2 penalty to the coefficient estimates. Its objective function is

where α ≥ 0 controls the strength of regularization. The intercept is not penalized. By shrinking coefficient magnitudes, ridge regression can improve estimation stability when predictors are correlated, although it does not directly perform variable selection. The regularization parameter was selected from α ∈ {0.1,1,10,100} using inner cross-validation.
Random Forest Regression: Random forest regression models [22] nonlinear relationships by combining predictions from multiple decision trees fitted to bootstrap samples of the training data, with random subsets of predictors considered when splitting nodes. The ensemble prediction is calculated as
where Tb (xi ) is the prediction from tree b, and B is the total number of trees. Averaging tree predictions can reduce the variance of individual trees and capture nonlinear patterns and interactions among predictors. The model used 300 trees, while maximum tree depth and minimum leaf size were selected from {3,5,8} and {3,10}, respectively.
Gradient Boosting Regression: Gradient boosting [23] builds an additive model sequentially, with each new tree fitted to reduce the residual errors of the current ensemble. Under squared-error loss, the model can be represented as
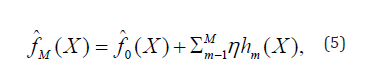
where
 is the initial prediction, h m( x) is the contribution of
tree m, M is the number of boosting stages, and η is the learning rate.
This approach can represent complex nonlinear relationships while
controlling the contribution of each successive tree. The number of
trees, learning rate, and maximum tree depth were tuned over M∈
{100,200}, η∈ {0.03,0.1}, and depth ∈ {2,3}, respectively.
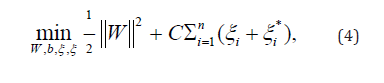
Support Vector Regression: Support vector regression (SVR) [9] was included to model potentially nonlinear relationships using a radial basis function (RBF) kernel. SVR estimates a function that balances model complexity against deviations exceeding a specified tolerance ε. Its optimization objective is
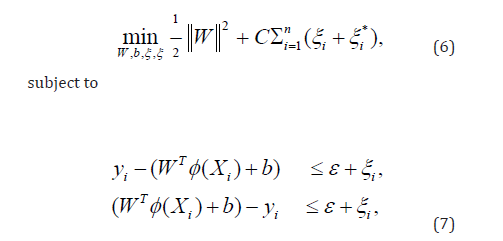
Here, represents the feature mapping induced by the kernel, C controls the penalty for deviations outside the ε-insensitive tube, and ξi, ξi* are slack variables. The RBF kernel is defined as

where γ controls the kernel’s spatial influence. The parameters C and ε were tuned over {0.5,1,5} and {0.1,0.3}, respectively. The kernel parameter γ was not tuned; it was set to the scikit-learn default (scale), which equals 1/(q⋅Var(X)), where q is the number of input features after preprocessing and Var(X) is the variance of all values in the training feature matrix.
Mean-Baseline Model
A mean-baseline model [24] was used to establish a reference level of predictive performance. For each cross-validation split, it predicted the mean oldpeak value in the training fold for every observation in the corresponding test fold:

where train denotes the training observations and ntrain is their number. This baseline provides a direct comparison for determining whether the fitted models offer predictive value beyond a constant prediction. All models were trained and evaluated using consistent predictor definitions, fold-specific preprocessing, and the same cross-validation splits.
Performance Evaluation and Statistical Measures
Prediction Error Metrics: Model performance was evaluated [25] on held-out test folds using the mean absolute error (MAE), root mean squared error (RMSE), and coefficient of determination
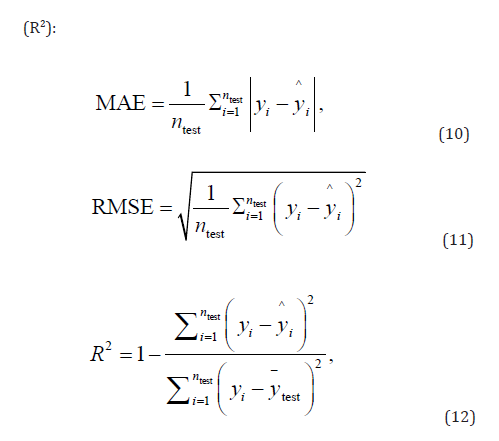
where ntest is the number of observations in the test fold and y −test is the mean observed oldpeak in that fold. Lower MAE and RMSE indicate better performance, whereas higher R2 indicates greater explained variation; R2 can be negative when a model predicts worse than the test-fold mean
Cross-Validation Summary
For each metric (M) MAE, RMSE and R2 [26], the value Mk was calculated in each of the K outer test folds (K=25 for five-fold crossvalidation repeated five times). Performance is reported as the mean and standard deviation across folds:
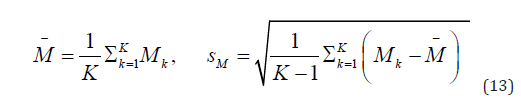
Because all models and scenarios used identical splits, foldmatched differences were calculated for paired comparisons. For example, the reduction in RMSE attributable to including ST slope was

where positive values of Δk indicate better prediction when slope is included.
Permutation Importance
The contribution of predictor j was quantified by permutation importance on held-out folds [27]. Within each test fold, the values of predictor j were randomly permuted R times, and the increase in RMSE relative to the unpermuted data was calculated:

where
^
f is the fitted model and  is the test matrix after
the r-th permutation of predictor j (R=5). Importance values were
averaged across folds, with larger values indicating a greater
contribution to prediction accuracy.
Multiple-Testing Correction
For m hypothesis tests, the raw p-values were ordered as (1) (2) (m), p ≤ p ≤...≤ p , and Holm-adjusted p-values were calculated as

Results
Clinical characteristics across the three levels of exerciseinduced ST-segment depression presented in Table 1. Age increased from a median of 50.5 years (IQR: 43.0–56.0) in the none group to 56.0 years (IQR: 50.0–61.0) in the mild group and 57.0 years (IQR: 51.0–62.0) in the marked group p<0.001. Resting blood pressure (trestbps) also differed significantly across severity groups p<0.001, with the highest median observed in the marked group at 136.0 mmHg (IQR: 124.0–150.0), compared with 130.0 mmHg in both the none and mild groups. Cholesterol levels showed a smaller but statistically significant difference p=0.030; the mild group had the highest median cholesterol level at 244.5 (IQR: 213.2–284.8), followed by the marked group at 243.0 (IQR: 214.0–272.5) and the none group at 235.0 (IQR: 206.0–272.0). Maximum heart rate achieved (thalch) showed a pronounced decreasing pattern across the severity categories, declining from 147.5 (IQR: 120.0–164.0) in the none group to 138.0 (IQR: 120.0–153.0) in the mild group and 130.0 (IQR: 114.5–145.0) in the marked group p<0.001. This pattern indicates that patients with greater exercise-induced STsegment depression tended to achieve lower maximum heart rates, while also being older and having higher resting blood pressure. Although cholesterol differed significantly, its distribution did not increase consistently with severity. These clinical factors like age, resting blood pressure, and maximum heart rate may be relevant variables for further association analysis and prediction of oldpeak. The distribution of oldpeak severity differed significantly across several clinical categories, as illustrated in Figure 2. Sex was strongly associated with severity (p<0.001): females more often had no ST-segment depression (51% vs 43% in males), whereas marked depression was more frequent among males (24% vs 10%). Chestpain type was also strongly associated (p<0.001): atypical angina was predominantly associated with no depression (74%), while asymptomatic chest pain showed greater proportions of mild (40%) and marked (29%) depression. For resting ECG (p=0.004), marked depression was more common in patients with ST–T abnormalities (27%) and left ventricular hypertrophy (23%) than in those with a normal ECG (18%). Fasting blood sugar showed a statistically significant but weaker association (p=0.034); marked depression was similar across groups (20–24%), indicating that the difference arose from the overall distribution rather than from separation in marked cases. The most pronounced patterns occurred for exerciseinduced angina and peak-exercise ST slope (both p<0.001): 35% of patients with exercise-induced angina had marked depression versus 11% of those without, and the single patient with missing angina status had marked depression, although this cannot be interpreted as a stable group pattern; for ST slope, marked depression accounted for 56% of downsloping, 34% of flat, and 9% of upsloping patterns, whereas 96% of patients with missing ST-slope values had no depression, suggesting that missingness may not be random and could affect analyses using this predictor. These patterns are physiologically plausible, as exercise-induced angina and downsloping ST segments can accompany myocardial ischemia, while sex, chest-pain presentation, and resting ECG reflect differences in clinical presentation and underlying cardiac status; however, the chi-square tests assess associations between categorical distributions only and do not adjust for confounding or establish independent predictive effects (Table 1 &2, Figure 2).
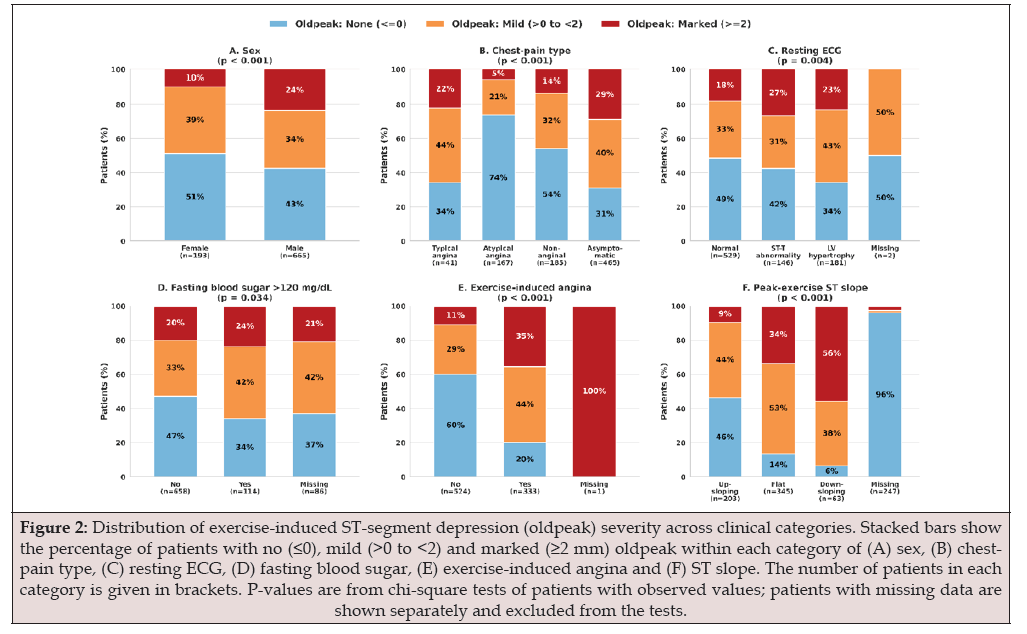
Figure 2:Distribution of exercise-induced ST-segment depression (oldpeak) severity across clinical categories. Stacked bars show the percentage of patients with no (≤0), mild (>0 to <2) and marked (≥2 mm) oldpeak within each category of (A) sex, (B) chestpain type, (C) resting ECG, (D) fasting blood sugar, (E) exercise-induced angina and (F) ST slope. The number of patients in each category is given in brackets. P-values are from chi-square tests of patients with observed values; patients with missing data are shown separately and excluded from the tests.

Table 1:Clinical and demographic characteristics of patients according to the severity of exercise-induced ST-segment depression (oldpeak).
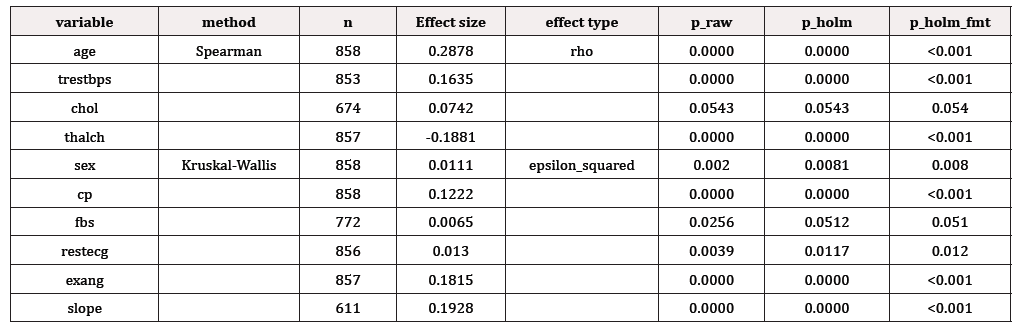
Table 2:Strength of association between each predictor and Oldpeak.
Several predictors showed statistically significant associations with oldpeak, though the strength and direction of these relationships varied. Among continuous variables, age had the strongest positive correlation (ρ=0.2878, p_Holm<0.001), indicating that older patients tended to have greater ST-segment depression; resting blood pressure was also positively associated but more weakly (ρ=0.1635, p_Holm<0.001), whereas maximum heart rate showed a negative correlation (ρ=−0.1881, p_Holm<0.001), so that lower maximum heart rates accompanied higher oldpeak values. Cholesterol showed only a weak positive correlation that did not remain significant after Holm correction (ρ=0.0742, p_ Holm=0.0543). Among categorical variables, exercise-induced angina (ε²=0.1815), ST slope (ε²=0.1928), and chest-pain type (ε²=0.1222) had the largest effect sizes, all remaining significant after Holm correction (p_Holm<0.001), indicating comparatively stronger differences in oldpeak distributions across their categories than those observed for sex (ε²=0.0111) and resting ECG (ε²=0.0130), which were also significant after correction. Fasting blood sugar was not significant after adjustment (p_Holm=0.0512). The Holm correction limits false-positive findings from multiple comparisons, while the effect sizes distinguish stronger associations from those that may be significant merely because of sample size, shown in Table 1 (Figure 3).
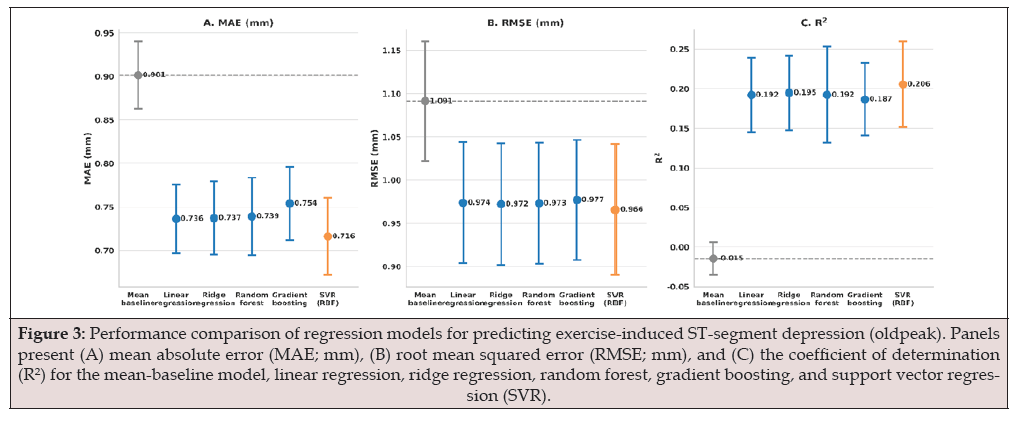
Figure 3:Performance comparison of regression models for predicting exercise-induced ST-segment depression (oldpeak). Panels present (A) mean absolute error (MAE; mm), (B) root mean squared error (RMSE; mm), and (C) the coefficient of determination (R²) for the mean-baseline model, linear regression, ridge regression, random forest, gradient boosting, and support vector regression (SVR).
Comparison of predictive performance of the regression models using mean absolute error (MAE), root mean squared error (RMSE), and the coefficient of determination (R²), illustrated in Figure 3. SVR achieved the lowest MAE (0.716 mm) and RMSE (0.966 mm), indicating the smallest average prediction errors. Linear regression, ridge regression, and random forest performed similarly (MAE 0.736–0.739 mm; RMSE 0.972–0.974 mm), whereas gradient boosting had the highest errors (MAE 0.754 mm; RMSE 0.977 mm). All fitted models reduced prediction errors relative to the mean-baseline model (MAE 0.901 mm; RMSE 1.091 mm), indicating that the clinical variables carried useful predictive information about oldpeak. However, R² values were low across all models (0.187 for gradient boosting to 0.206 for SVR), so even the best model explained only about 20.6% of the variation in oldpeak limited explanatory power despite lower prediction errors. The substantial overlap of error bars suggests that between-model differences may be modest, and statistical comparisons would be needed to confirm whether they are meaningful. The mean-baseline R² was approximately −0.015, whereas all fitted models were positive, indicating better explained variance than the baseline. The heatmaps compare model performance across three scenarios as shown in Figure 4 that all patients, patients with observed slope values but without slope as a predictor, and the same patients with slope included. For R², SVR performed best in the full cohort (0.206), while random forest was highest in the slope-observed cohort (0.252); when slope was excluded from that cohort, SVR again led (0.145). The mean-baseline model had negative R² in every scenario, meaning it explained less variation than simply predicting the mean. For RMSE, SVR had the lowest error in the full cohort (0.966 mm) and in the slope-observed cohort without slope (1.023 mm), while ridge regression performed best when slope was included (0.971 mm). Model rankings therefore depended on both the evaluation sample and whether slope was a predictor. Because restricting the analysis to patients with observed slope also changes the sample, the difference between the full and restricted cohorts should not be read as the isolated effect of removing slope. Within the restricted cohort, however, including slope was associated with higher R² for all models largest for random forest (0.252) and lower RMSE, a pattern consistent with slope carrying predictive information about oldpeak, though differences in sample composition may also contribute. Permutation importance identified exercise-induced angina as the most influential predictor in the SVR model, producing the largest increase in RMSE when permuted is approximately 0.113 mm is shown in Figure 5. Chestpain type ranked second, followed by age and cholesterol, while maximum heart rate contributed less. Sex, resting blood pressure, fasting blood sugar, and resting ECG had near-zero importance, indicating that permuting these features barely affected predictive error. The prominence of exercise-induced angina is consistent with its association with oldpeak in the preceding analyses. Error bars indicate variability in the estimated importance, which was greater for exercise-induced angina than for most other predictors. Nearzero importance does not imply absent clinical relevance, since a variable’s predictive information may overlap with other features or add little beyond those already in the model. Importantly, permutation importance reflects each feature’s contribution to the fitted model’s predictive performance, not the direction of its association with oldpeak or a causal effect. The out-of-fold prediction plot shows that the SVR model achieved an MAE of 0.72 mm, an RMSE of 0.97 mm, and an R² of 0.21. Most predictions cluster between approximately 0 and 2 mm, reflecting the model’s tendency to predict within the central range of the observed data. However, points are dispersed around the red dashed identity line, indicating discrepancies between observed and predicted oldpeak, and the model generally underestimates higher observed values, particularly above 2 mm, where predictions remain mostly below 2 mm. This pattern suggests regression toward the central range, with limited ability to capture extreme values. The relatively low R² indicates that the model explains only about 21% of the variation in observed oldpeak despite a moderate average prediction error, and the vertical spread of predictions at similar observed values further indicates that it does not fully capture outcome variability. Negative observed values, if present, warrant checking, since oldpeak is typically non-negative in standard clinical definitions and such values may reflect coding or preprocessing issues. Figure 6 illustrates limited calibration across the full outcome range, especially for larger values, and helps explain why prediction errors persist despite performance better than the mean baseline (Figure 4,5&6).
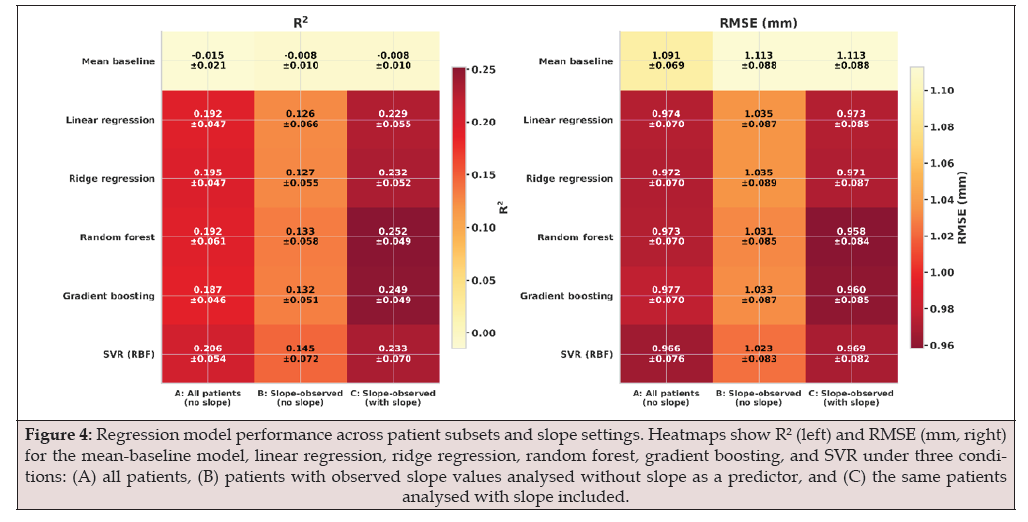
Figure 4:Regression model performance across patient subsets and slope settings. Heatmaps show R² (left) and RMSE (mm, right) for the mean-baseline model, linear regression, ridge regression, random forest, gradient boosting, and SVR under three conditions: (A) all patients, (B) patients with observed slope values analysed without slope as a predictor, and (C) the same patients analysed with slope included.
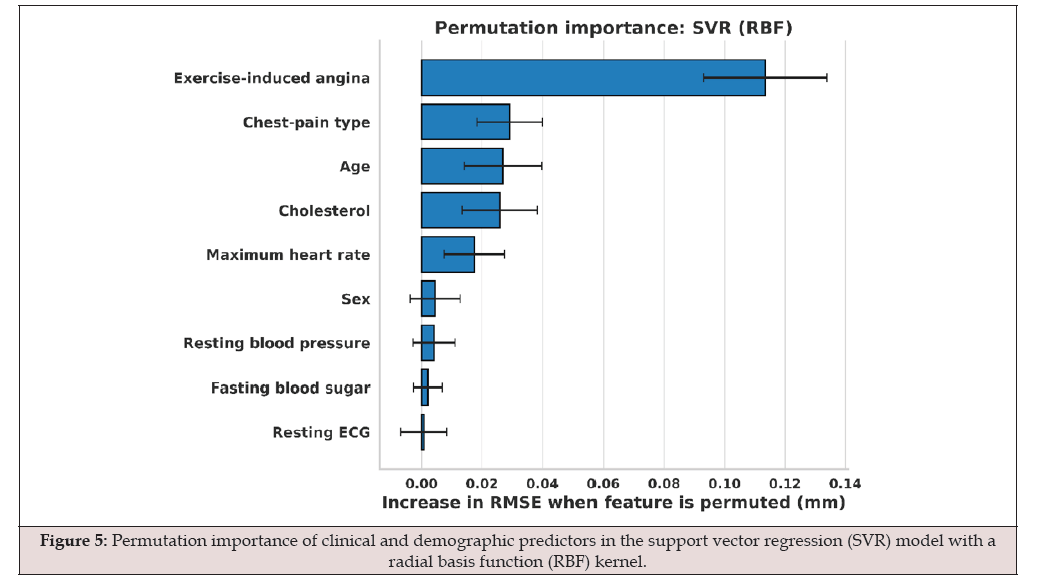
Figure 5:Permutation importance of clinical and demographic predictors in the support vector regression (SVR) model with a radial basis function (RBF) kernel.
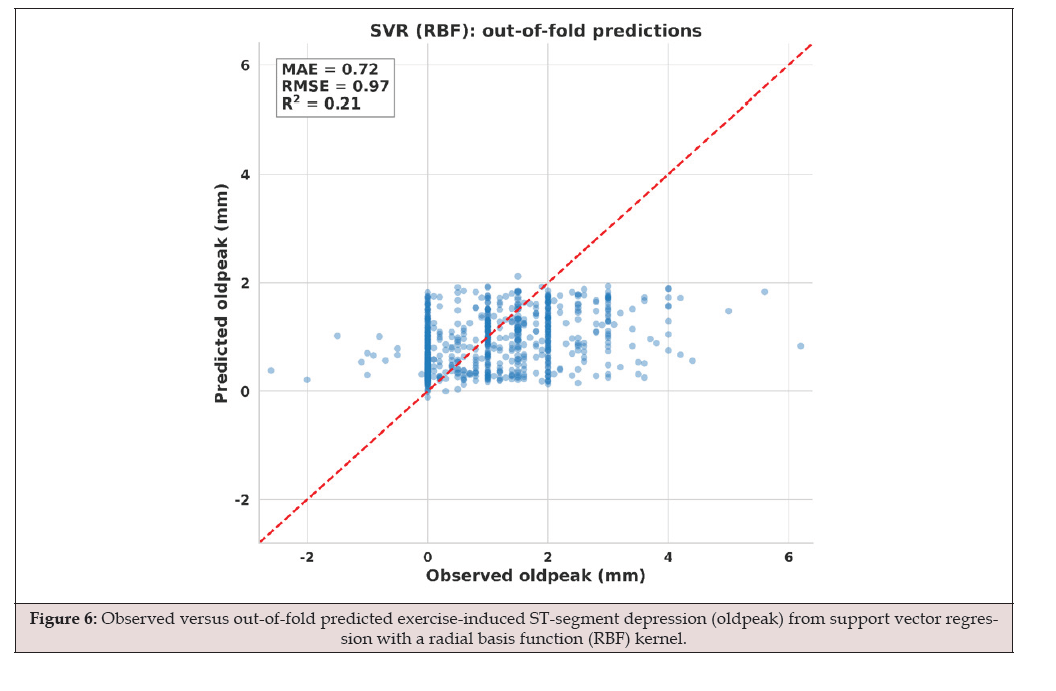
Figure 6:Observed versus out-of-fold predicted exercise-induced ST-segment depression (oldpeak) from support vector regression with a radial basis function (RBF) kernel.
Conclusion and Limitations
This study examined which routinely recorded clinical and demographic characteristics are associated with the magnitude of exercise-induced ST-segment depression and how accurately they can predict it. Older age, higher resting blood pressure, lower maximum heart rate, male sex, asymptomatic chest-pain presentation, resting ECG abnormalities, exercise-induced angina, and a downsloping ST segment were each associated with greater oldpeak, with exercise-induced angina, ST slope, and chestpain type showing the largest effect sizes. All regression models outperformed the mean baseline, and support vector regression achieved the lowest errors, but the improvement was modest: the best model explained only about one-fifth of the variation in oldpeak, the differences between models were small and uncertain, and higher values were systematically underestimated. Within the subset of patients with a recorded ST slope, including slope as a predictor improved performance; however, restricting the analysis to this subset also altered the sample composition, so this improvement cannot be attributed to slope alone. Routine clinical variables carry real but limited information about the magnitude of ST depression enough to describe who tends to develop greater depression, but not yet enough to predict an individual patient’s value reliably. These findings should be interpreted in light of few limitations. The analysis was a retrospective secondary analysis of a publicly available dataset pooled from four centres, lacking information on coronary disease severity, medication use, and exercise-test protocol, and ST slope was missing selectively, with most missing values occurring in patients without depression. The association tests describe marginal relationships without adjustment for confounding, validation was internal only, and the outcome captures a single summary measurement rather than the full time course of ST change. Future work should therefore pursue external validation in an independent cohort with standardised testing and more complete recording, assess calibration explicitly rather than inferring it from error metrics, and test whether a focused set of readily available predictors centred on exerciseinduced angina, chest-pain type, age, and ST slope performs comparably to the broader predictor set. Connecting prediction accuracy to clinical outcomes, rather than to oldpeak alone, would be the necessary next step before any clinical application could be considered.
Acknowledgement
None.
Conflict of Interest
None.
References
- Sinha A, Utkarsh Dutta, Ozan M Demir, Kalpa De Silva, Howard Ellis, et al. (2024) Rethinking false positive exercise electrocardiographic stress tests by assessing coronary microvascular function. Journal of the American College of Cardiology 83(2): 291-299.
- Piotrowska M, Paulina Okrzymowska, Wojciech Kucharski , Krystyna Rożek-Piechura (2021) Application of inspiratory muscle training to improve physical tolerance in older patients with ischemic heart failure. International journal of environmental research and public health 18(23): 12441.
- Wang J (2024) Multi-scale and multi-channel information fusion for exercise electrocardiogram feature extraction and classification. IEEE Access 12(1): 36670-36679.
- Gibbons RJ (2021) Myocardial ischemia in the management of chronic coronary artery disease: past and present. Circulation: Cardiovascular Imaging 14(1): e011615.
- Savchuk D, A Doroshenko (2025) Explainable AI methods to increase trustworthiness in healthcare, in Responsible and explainable artificial intelligence in healthcare Elsevier 55-89.
- Imazio M, Gabriele Barberi Squarotti, Alessandro Andreis, Alessandra Agosti, Michele Millesimo, et al. (2022) Diagnostic and prognostic role of the electrocardiogram in patients with pericarditis. Heart 108(18): 1474-1478.
- Vora KP, Ankur Kalra, Khalid Youssef, Kinjal Bhatt, Tejas Pandya, et al. (2025) Cardioprotective role of coronary collaterals in the development of intramyocardial hemorrhage in ST-segment elevation MI patients. JACC: Advances, 4(11_Part_1): 102169.
- Savonitto S, Joseph S Alpert, Holger Thiele, Gianluca Campo, Giampaolo Niccoli, et al. (2026) Non-ST-segment elevation acute coronary syndrome: understanding the full spectrum to guide management. European Heart Journal, 2026. 47(4): 423-437.
- Hussein DR, Ali Subhi Alhumaima, Hussein Alkattan, Mostafa Abotaleb (2026) Performance Evaluation of Logistic Regression, Random Forest, and SVM Models in Heart Disease Prediction. Journal of Transactions in Systems Engineering 4(1): 522-537.
- He Z, X Pu, L. Zeng (2026) Chest pain with elevated ST segment in lead V1: a case report. Frontiers in Cardiovascular Medicine 13(1): 1731030.
- Frosted R, Kathrine Kold Sørensen, Mikkel Porsborg Andersen, Christoffer Polcwiartek, Chaoqun Zheng, et al. (2026) Prevalence and cardiac risk of familial ST depression syndrome: a study of 12 million electrocardiograms. Heart Rhythm 23(2): 289-295.
- Gilani MT, Nabiolah Mafi, Leila Mashhadi, Samaneh S Asadi Kakhki (2026) Incidence and Associated Factors of ST-Segment Changes in Noncardiac Surgery Under General Anesthesia. Annals of Cardiac Anaesthesia 29(3): 352-358.
- Srivastava AP, M Khan (2025) Enhancing Cardiovascular Stroke Prediction with Feature Selection and Machine Learning Models. SGS-Engineering & Sciences 1(2).
- Ang X, Min Tang, Wu Liu, Shaoyang Cui (2026) Enhancing clinically cardiovascular machine learning model for risk prediction via sample augmentation. Frontiers in Medicine 13(1): 1849464.
- Praveen SP, Mohammad Kamrul Hasan, Siti N H S Abdullah, N S Koti M K Tirumanadham, Shayla Islam, et al. (2024) Enhanced feature selection and ensemble learning for cardiovascular disease prediction: hybrid GOL2-2 T and adaptive boosted decision fusion with babysitting refinement. Frontiers in Medicine 11:1407376.
- Tomar M, N Deo (2025) cardiovascular disease prediction using machine learning algorithms with Bernstein-type kernel functions: M. Tomar, N. Deo. The Journal of Supercomputing, 82(1): 5.
- Jose R, Anvin Thomas, Jennifer Guo, Robert Steinberg, Milan Toma, et al. (2024) Evaluating machine learning models for prediction of coronary artery disease. Glob Transl Med 3(1).
- Balaraju G, M Datta Sai Reddy, SR Manjunath, M Hemalatha, N Veena, et al. (2024) Heart Disease Prediction Using Classification Techniques of Supervised Machine Learning. in 2024 Second, International Conference on Networks, Multimedia and Information Technology (NMITCON) IEEE.
- Carluccio C, Francesco Bressan, Matteo Pizzolato, Amedeo De Antoni, Simone Ungaro, et al. (2026) Exercise Stress Testing in Clinical Cardiology: A Practical Guide to Performance and Interpretation. Journal of Clinical Medicine 15(4): 1656.
- Lamendola P, Nello Cambise, Antonio Di Renzo, Lorenzo Tinti, Antonio De Vita, et al. (2024) Assessment of the ischaemic effects of myocardial bridge by echocardiographic exercise stress test. European Cardiology Review 19(1): e09.
- Wang Y (2023) Risk assessment for heart failure using multiple linear regression model. in Second International Conference on Biological Engineering and Medical Science (ICBioMed 2022) SPIE.
- Liu J, Dan Zhu, Lingzhi Deng, Xiaoliang Chen (2025) Predictive modeling of heart failure outcomes using ECG monitoring indicators and machine learning. Annals of Noninvasive Electrocardiology 30(4): e70097.
- Kumar S, Aman Saundik, Soumya Sindhu, Amrita Chattraj, Rohitansh Pathania, et al. (2025) Predicting Heart Disease using Machine Learning Approach. in 2025 8th International Conference on Circuit, Power & Computing Technologies (ICCPCT) IEEE.
- Murphy SP, Margaret F Prescott, Alan S Maisel, Javed Butler, Ileana L Piña, et al. (2021) Association between angiotensin receptor–neprilysin inhibition, cardiovascular biomarkers, and cardiac remodeling in heart failure with reduced ejection fraction. Circulation: Heart Failure 14(6): e008410.
- Nadakinamani RG, A Reyana, Sandeep Kautish, A S Vibith, Yogita Gupta, et al. (2022) [Retracted] Clinical data analysis for prediction of cardiovascular disease using machine learning techniques. Computational intelligence and neuroscience 2022(1): 2973324.
- Al-Alshaikh HA, Prabu P, Ramesh Chandra Poonia, Abdul Khader Jilani Saudagar, Manoj Yadav et al. (2024) Comprehensive evaluation and performance analysis of machine learning in heart disease prediction. Scientific Reports 14(1): 7819.
- Cappelli F, Gianfranco Castronuovo, Salvatore Grimaldi, Vito Telesca (2024) Random Forest and feature importance measures for discriminating the most influential environmental factors in predicting cardiovascular and respiratory diseases. International journal of environmental research and public health 21(7): 867.




 We use cookies to ensure you get the best experience on our website.