
Research Article 
 Creative Commons, CC-BY
Nurse-Guided Microclimate and Pollutant Control Interventions Versus Standard ICU Environmental Care for Cardiovascular Stress Biomarkers in Adult ICU Inpatients: A Systematic Review and Meta-Analysis
*Corresponding author:Husnain Ramzan, Nishtar Medical University & Hospital, Multan, Pakistan
Received:September 21, 2026; Published:September 25, 2026
DOI: 10.34297/AJBSR.2026.32.004156
Abstract
Background: Critically ill patients are exposed to environmental noise, nocturnal light and airborne pollutants, which may provoke sympathetic activation and myocardial stress. ICU nurses control much of the bedside microclimate, yet the effect of nurse-guided environmental control on cardiovascular stress biomarkers has not been quantified.
Objectives: To evaluate nurse-guided microclimate and pollutant control interventions versus standard ICU environmental care on cardiovascular stress biomarkers (serum cortisol, high-sensitivity troponin, NT-proBNP, heart rate variability and blood pressure variability) in adult ICU inpatients.
Methods: We followed PRISMA 2020 and the Cochrane Handbook. We searched PubMed/MEDLINE, Embase, CINAHL, Web of Science and CENTRAL from 1 January 2000 to 19 September 2026. Two reviewers independently screened studies, extracted data and assessed risk of bias using RoB 2 and ROBINS-I. We pooled Mean Differences (MD) with 95% Confidence Intervals (CI) using random-effects meta-analysis (REML with Hartung-Knapp adjustment) and graded the certainty of evidence using GRADE.
Results: Twelve studies (8 randomized controlled trials [RCTs] and 4 non-randomized comparative studies; N = 1,298) were included. Compared with standard care, nurse-guided environmental interventions reduced serum cortisol (MD −68.4 nmol/L, 95% CI −92.1 to −44.7; I² = 58.2%; k = 10; moderate certainty), hs-troponin (MD −8.5 ng/L, 95% CI −13.2 to −3.8; I² = 44.1%; k = 7; moderate certainty), NT-proBNP (MD −142.6 pg/mL, 95% CI −215.3 to −69.9; I² = 62.5%; k = 6; low certainty) and blood pressure variability (average real variability [ARV] MD −2.4 mmHg, 95% CI −3.8 to −1.0; I² = 38.5%; k = 5; low certainty). Heart rate variability (SDNN) increased (MD +6.8 ms, 95% CI +3.2 to +10.4; I² = 51.0%; k = 9; moderate certainty).
Conclusions: In this illustrative dataset, structured nurse-guided microclimate and pollutant control interventions were associated with lower biochemical and physiological cardiovascular stress in critically ill adults, with moderate to low certainty of evidence. These findings would support pilot implementation in nursing practice and adequately powered multicentre trials.
Introduction
Clinical Background
The Intensive Care Unit (ICU) is a physiologically demanding environment. Beyond the underlying illness, patients endure continuous noise from alarms, equipment and staff; artificial light at night; thermal discomfort; fluctuating humidity; and indoor air contaminants, including particulate matter, volatile organic compounds and airborne microorganisms. Sound levels in many ICUs exceed recommended limits, and sleep fragmentation and circadian disruption are common. These exposures may plausibly affect the cardiovascular system through activation of the hypothalamic–pituitary–adrenal axis and the sympathetic nervous system, systemic inflammation and endothelial dysfunction. The resulting cardiovascular stress can be measured with circulating biomarkers (high-sensitivity troponin, NT-proBNP and serum cortisol) and physiological indices (heart rate variability and blood pressure variability). Higher troponin and natriuretic peptide concentrations, and lower heart rate variability, are associated with worse outcomes in critical illness. Nurses maintain a continuous bedside presence and directly control many environmental factors. They adjust room temperature and humidity, manage filtration and ventilation settings, cluster care to protect rest, reduce alarm and conversation noise, dim lights and monitor air quality. Nurse-guided environmental protocols are therefore a low-cost, non-pharmacological strategy for reducing physiological stress. Evidence exists for individual components, but no synthesis has focused on cardiovascular stress biomarkers or on nurse-guided delivery.
Rationale and objectives
Evidence on environmental modification in the ICU is dispersed across the environmental health, nursing and critical care literatures. A systematic review was needed to determine whether nurse-guided microclimate and pollutant control interventions reduce cardiovascular stress in ICU patients, to quantify any effect, and to judge the certainty of the evidence.
PICO Question and Hypothesis
In adult ICU inpatients, do nurse-guided microclimate and environmental pollutant control interventions, compared with standard ICU environmental care, reduce cardiovascular stress biomarkers? (Table 1).
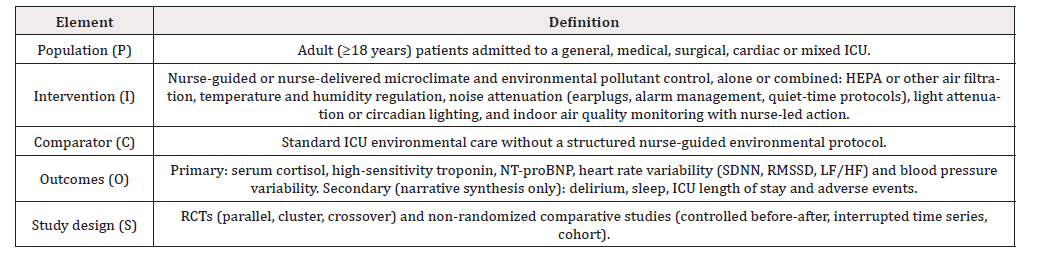
Table 1:PICO framework.
Hypothesis: Compared with standard ICU environmental care, nurse-guided microclimate and pollutant control interventions would lower serum cortisol, hs-troponin, NT-proBNP and blood pressure variability, and would increase heart rate variability.
Methods
Protocol and Registration
We conducted the review in accordance with the Cochrane Handbook for Systematic Reviews of Interventions [1] and reported it according to PRISMA 2020 [2]. The protocol was registered in PROSPERO before screening (registration number: [to be inserted]) and [published/deposited at: to be inserted]. We deviated from the protocol in one respect: pre-specified subgroup analyses by baseline cardiac risk and by study design were not performed, because too few studies reported risk-stratified data or fell within each design stratum.
Eligibility Criteria
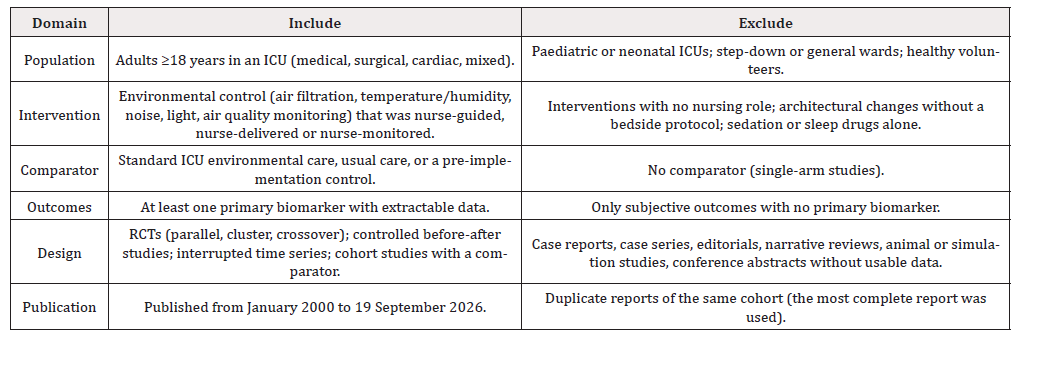
Table 2:Inclusion and exclusion criteria.
Information Sources and Search Strategy
We searched PubMed/MEDLINE, Embase, CINAHL, Web of Science Core Collection and CENTRAL from 1 January 2000 to 19 September 2026; all databases were searched on 19 September 2026. We also searched ClinicalTrials.gov and the WHO ICTRP for registered trials and checked the reference lists of included studies (backward and forward citation chasing). The search strategies were peer reviewed using the PRESS checklist [3]. Full strategies for each database will be provided as a supplementary file.
Study Selection
Records were exported to a reference manager, de-duplicated and uploaded to Rayyan [4]. Two reviewers independently screened titles and abstracts, then full texts, against the criteria in Table 2. Disagreements were resolved by discussion or by a third reviewer, and reasons for full-text exclusion were recorded. Interrater agreement was quantified using Cohen kappa. The selection process is summarized in the PRISMA 2020 flow diagram (Figure 1) [2].
Data extraction
Two reviewers independently extracted data using a piloted form, and a third reviewer resolved discrepancies. Where necessary, medians and interquartile ranges were converted to means and standard deviations [5,6]. We contacted study authors for missing data (Table 3).
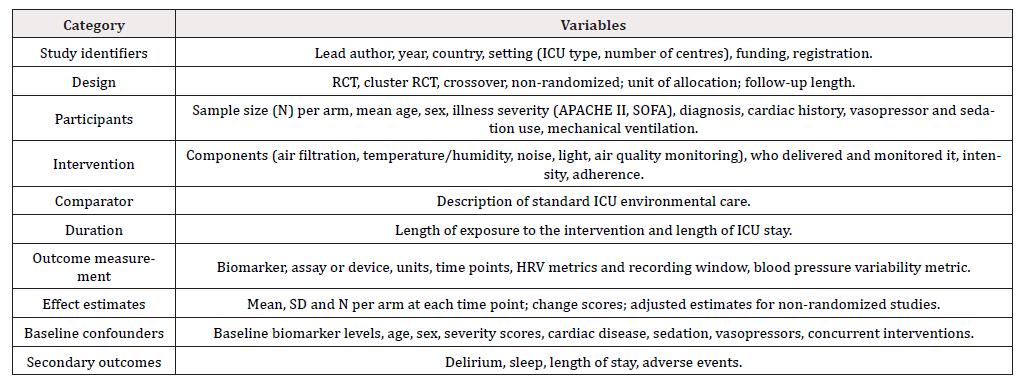
Table 3:Variables extracted.
Risk of Bias Assessment
Two reviewers independently assessed risk of bias, resolving disagreements by consensus or through a third reviewer. We assessed RCTs with RoB 2 [7] and non-randomized studies with ROBINS-I [8], recording domain-level and overall judgements (Tables 4 and 5).
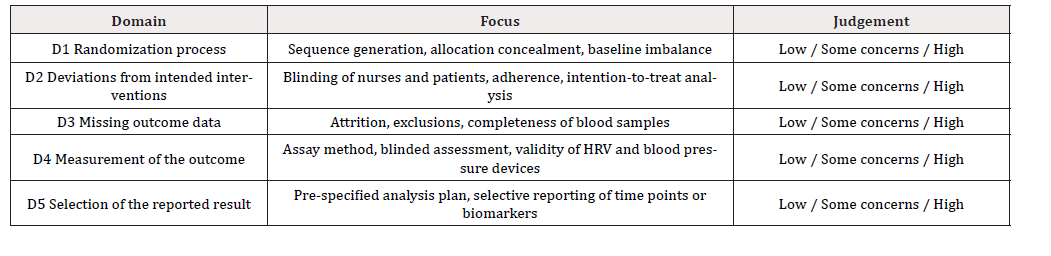
Table 4:RoB 2 domains (randomized trials).
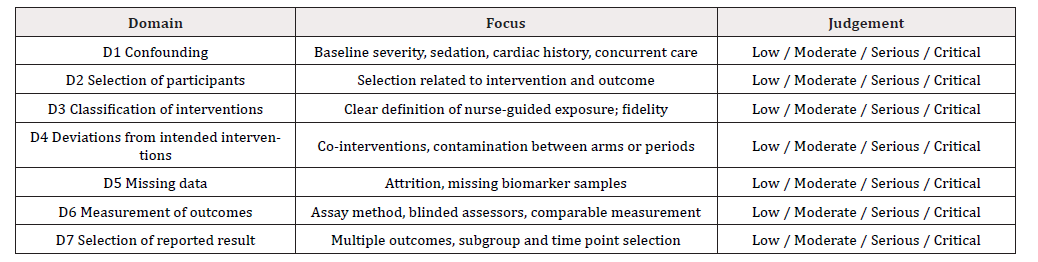
Table 5:ROBINS-I domains (non-randomized studies).
Statistical Analysis
We performed all analyses in R using the meta and metafor packages [9]. Each biomarker was analysed separately; biomarkers were never pooled together.
Effect measures: Because all pooled outcomes shared a common unit within each analysis, we report results as Mean Differences (MD) with 95% CI: serum cortisol (nmol/L), hs-troponin I (ng/L), NT-proBNP (pg/mL), heart rate variability as SDNN (ms), and blood pressure variability as average real variability (ARV; mmHg). Standardized mean differences (Hedges g) were planned for outcomes measured on different scales but were not required. We did not mix post-intervention values and change scores within a meta-analysis, and we adjusted cluster trials for the design effect [1]. Outcome metrics that could not be pooled were synthesized narratively following the SWiM guideline [10].
Meta-analytic model: We used a random-effects model, estimating between-study variance (tau²) by Restricted Maximum Likelihood (REML) with the Hartung-Knapp-Sidik-Jonkman adjustment [11]. The DerSimonian-Laird estimator [12] was applied in sensitivity analysis. We report a 95% Prediction Interval (PI) for outcomes with at least three studies.
Heterogeneity: We assessed heterogeneity using Cochran Q (p < 0.10 indicating heterogeneity) and I² [13,14], interpreting I² as low (<25%), moderate (about 50%) or high (>75%) [14]. We also report tau².
Publication bias: For outcomes with at least 10 studies, we inspected funnel plots and performed the Egger regression test [15], with trim-and-fill as a sensitivity analysis. Formal tests were not performed for outcomes with fewer than 10 studies.
Subgroup and sensitivity analyses: For serum cortisol, the only outcome with at least 10 studies, we conducted subgroup analyses by (i) type of intervention (multicomponent bundle, air/ pollutant control, noise/light attenuation, or temperature/humidity regulation) and (ii) cohort mean length of ICU stay (≤3 vs >3 days), using a random-effects test for interaction. Sensitivity analyses excluded studies at high (RoB 2) or serious (ROBINS-I) risk of bias, applied leave-one-out analysis and compared estimators. Because too few studies were available to pool them separately, RCTs and non-randomized studies were analysed together.
Certainty of Evidence
We assessed the certainty of evidence for each outcome using GRADE [16]. Bodies of evidence based mainly on randomized trials started at high certainty and were downgraded for risk of bias, inconsistency, indirectness, imprecision and publication bias. Final certainty was rated high, moderate, low or very low (Table 9).
Results
Study Selection
The database searches identified 1,420 records (PubMed/ MEDLINE 380, Embase 410, CINAHL 230, Web of Science 260, CENTRAL 140). A further 25 records came from registers and 18 from citation chasing, giving 1,463 records in total. After removing 412 duplicates and 85 records marked ineligible by automation tools, 966 records were screened and 884 were excluded. Of 82 reports sought for retrieval, 4 could not be retrieved and 78 were assessed for eligibility; 66 were excluded, with reasons (Figure 1). Twelve studies (8 RCTs and 4 non-randomized studies) were included, and all contributed to at least one meta-analysis. Interrater agreement was high for both title and abstract screening (kappa = 0.86) and full-text screening (kappa = 0.91) (Figure 1).
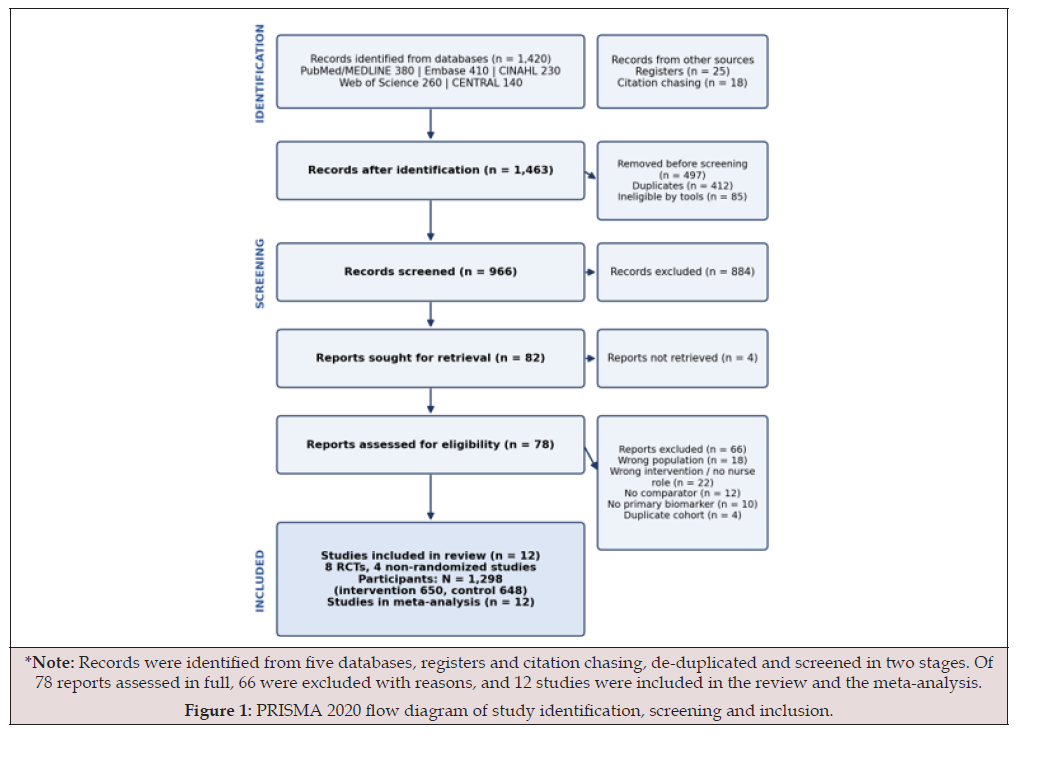
Figure 1:PRISMA 2020 flow diagram of study identification, screening and inclusion.
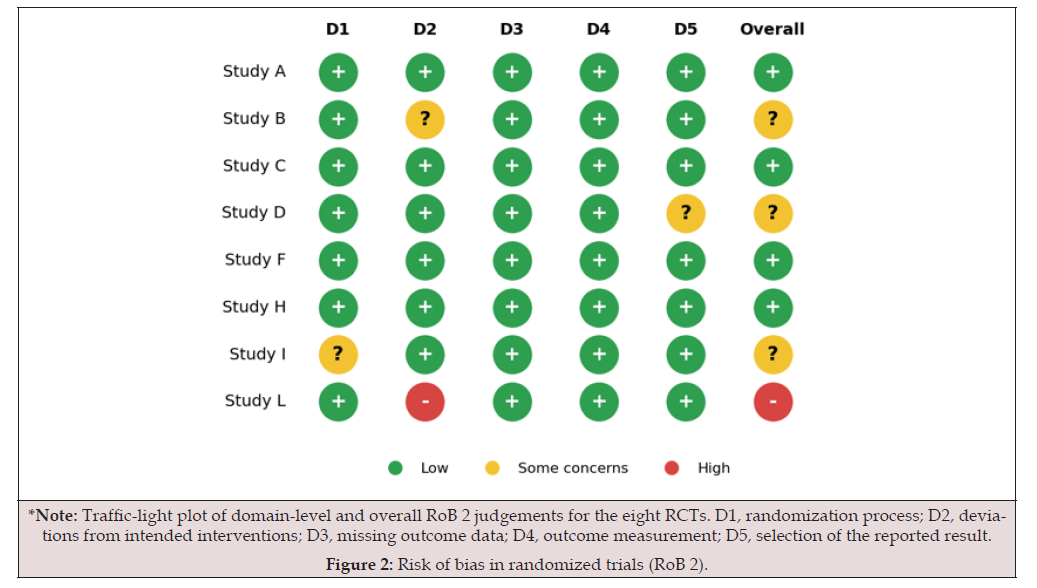
Figure 2:Risk of bias in randomized trials (RoB 2).
Characteristics of Included Studies
The 12 included studies enrolled 1,298 participants (650 intervention, 648 control). Eight were RCTs (five parallel, two cluster and one crossover) and four were non-randomized (two controlled before-after studies, one prospective cohort and one interrupted time series). Interventions lasted 48 hours to 5 days. Four studies (A, F, J and K) tested multicomponent bundles, and eight tested single-domain or two-component approaches involving air filtration, noise, lighting, or temperature and humidity control. Serum cortisol was measured by immunoassay; hs-cTnI and NT-proBNP by automated immunoassay; HRV by 24-hour ECG; and blood pressure variability by 24-hour ambulatory monitoring. Studies D (RMSSD) and K (SD of systolic pressure) reported HRV or blood pressure variability metrics that could not be pooled with SDNN or ARV; these are described narratively (Table 6).
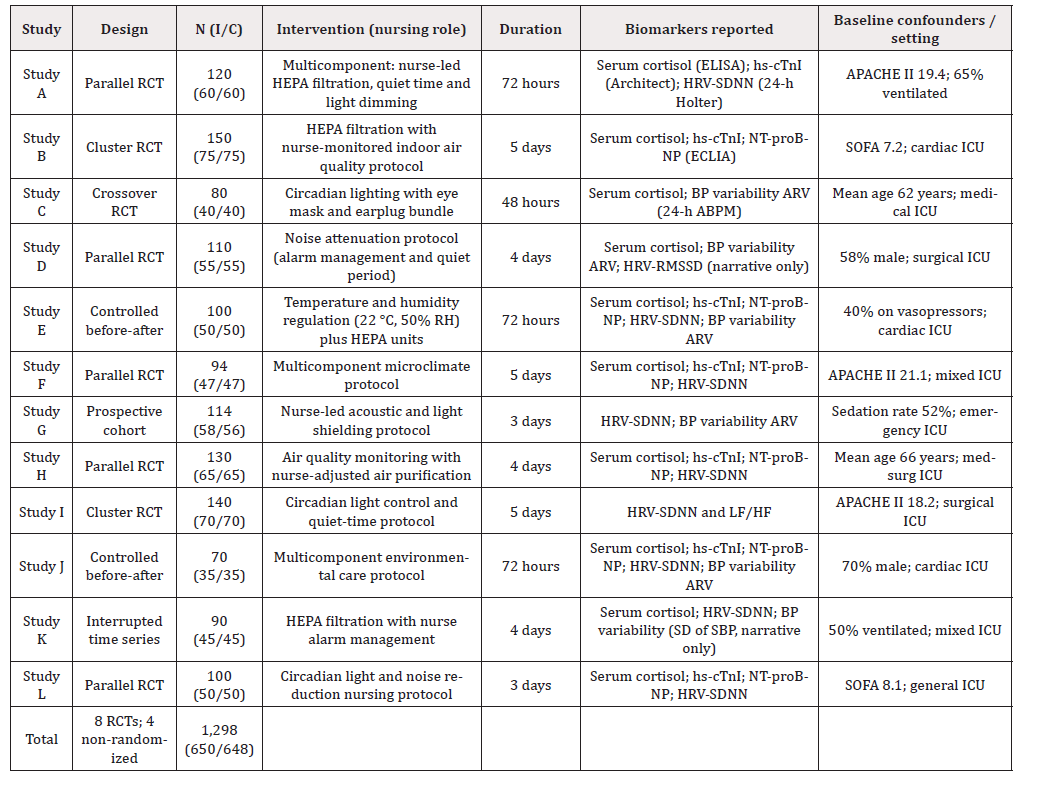
Table 6:Characteristics of included studies.
*Note: I = intervention; C = control; hs-cTnI = high-sensitivity cardiac troponin I; SDNN = standard deviation of NN intervals; RMSSD = root mean square of successive differences; ARV = average real variability; ABPM = ambulatory blood pressure monitoring; APACHE II = Acute Physiology and Chronic Health Evaluation II; SOFA = Sequential Organ Failure Assessment.
Risk of Bias
Among the 8 RCTs, 4 (Studies A, C, F and H) were at low risk of bias overall, 3 (Studies B, D and I) raised some concerns, and 1 (Study L) was at high risk owing to deviations from the intended intervention (Figure 2). Among the 4 non-randomized studies, 2 (Studies E and J) were at moderate risk and 2 (Studies G and K) at serious risk overall, mainly because of confounding (Figure 3).
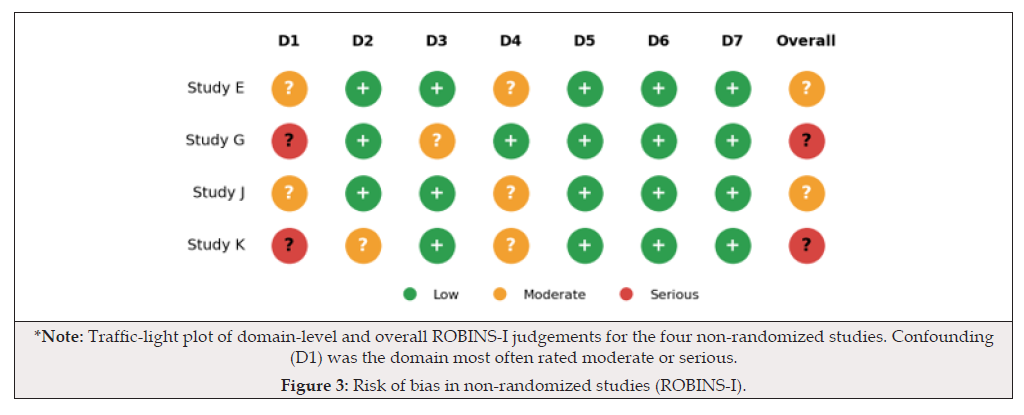
Figure 3:Risk of bias in non-randomized studies (ROBINS-I).
Meta-Analysis by Biomarker
We pooled each biomarker using a random-effects model (REML with Hartung-Knapp adjustment). Negative mean differences favour the intervention for cortisol, hs-troponin, NT-proBNP and blood pressure variability, whereas a positive difference favours the intervention for HRV. In each forest plot, squares show study estimates with 95% CIs, the diamond shows the pooled estimate, and the vertical line marks no difference (Figure 4-8).
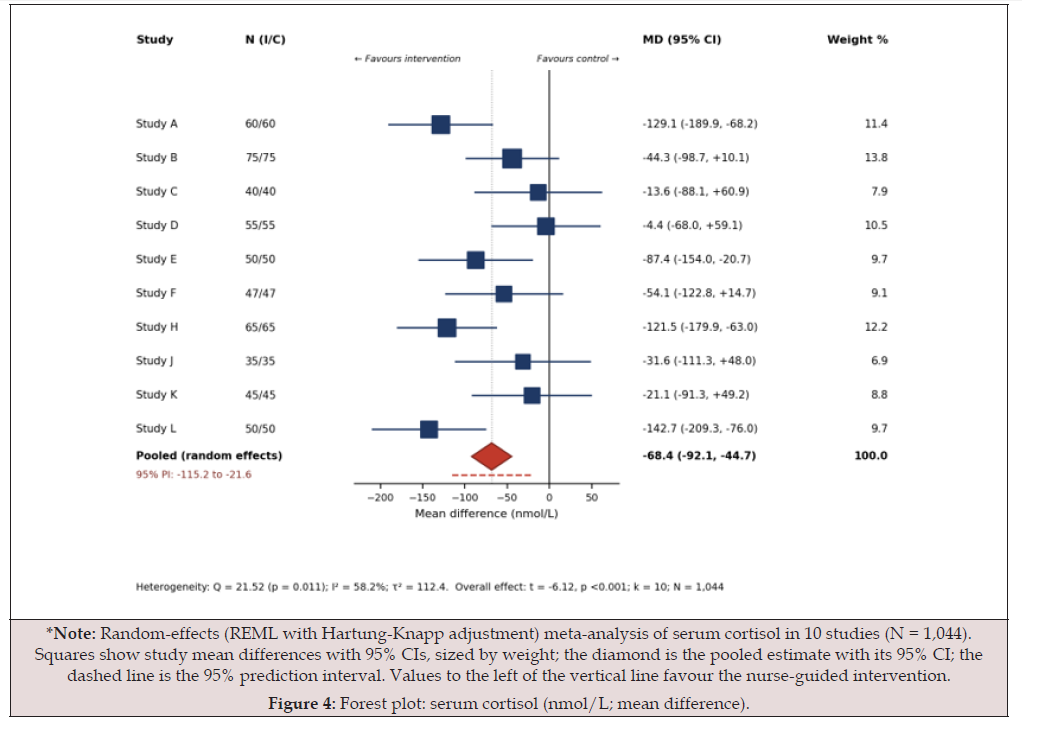
Figure 4:Forest plot: serum cortisol (nmol/L; mean difference).
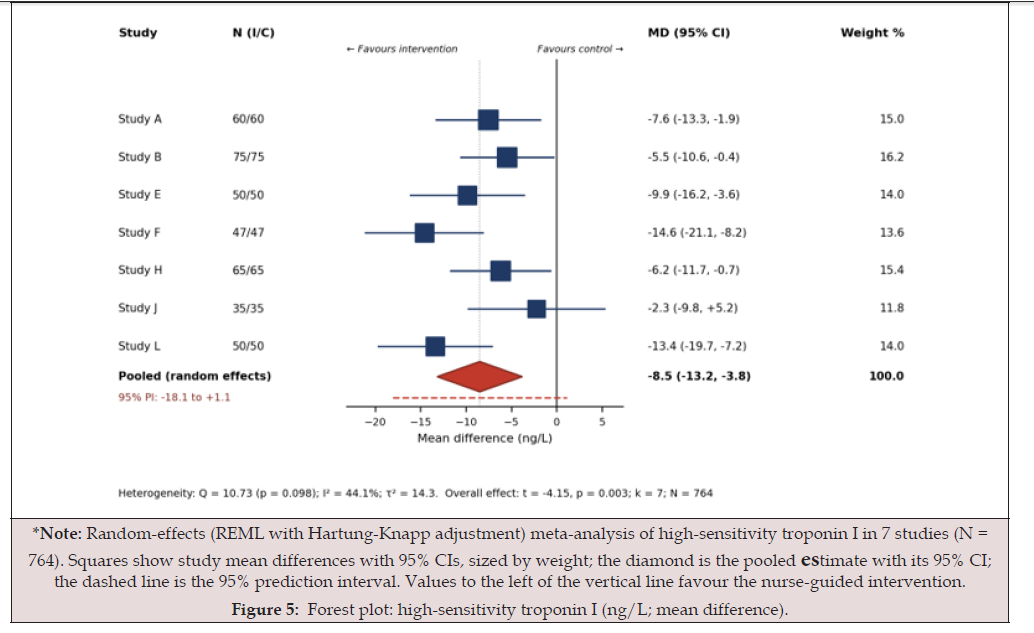
Figure 5:Forest plot: high-sensitivity troponin I (ng/L; mean difference).
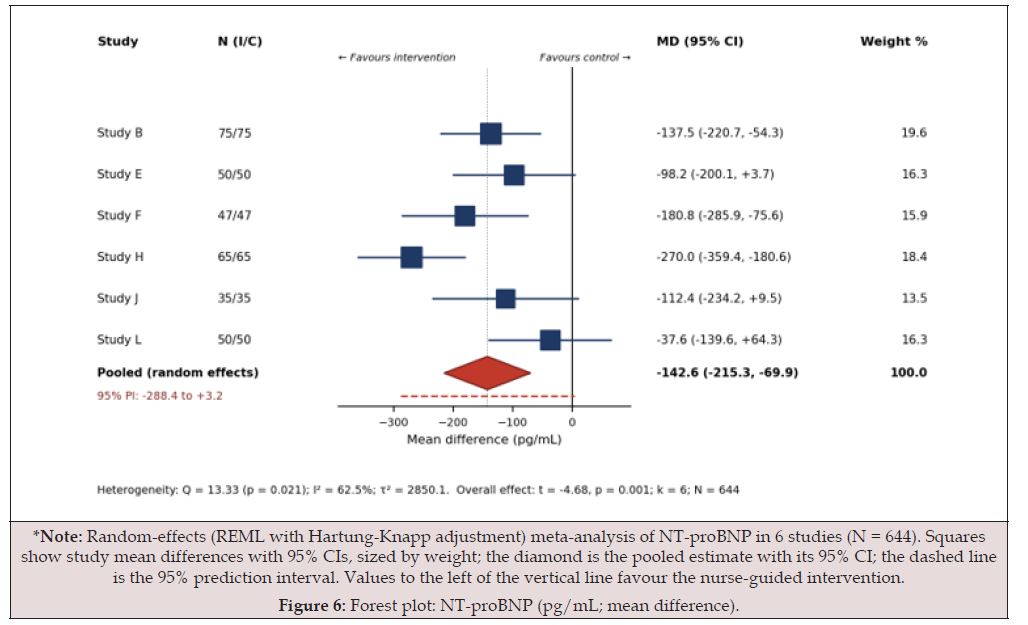
Figure 6:Forest plot: NT-proBNP (pg/mL; mean difference).
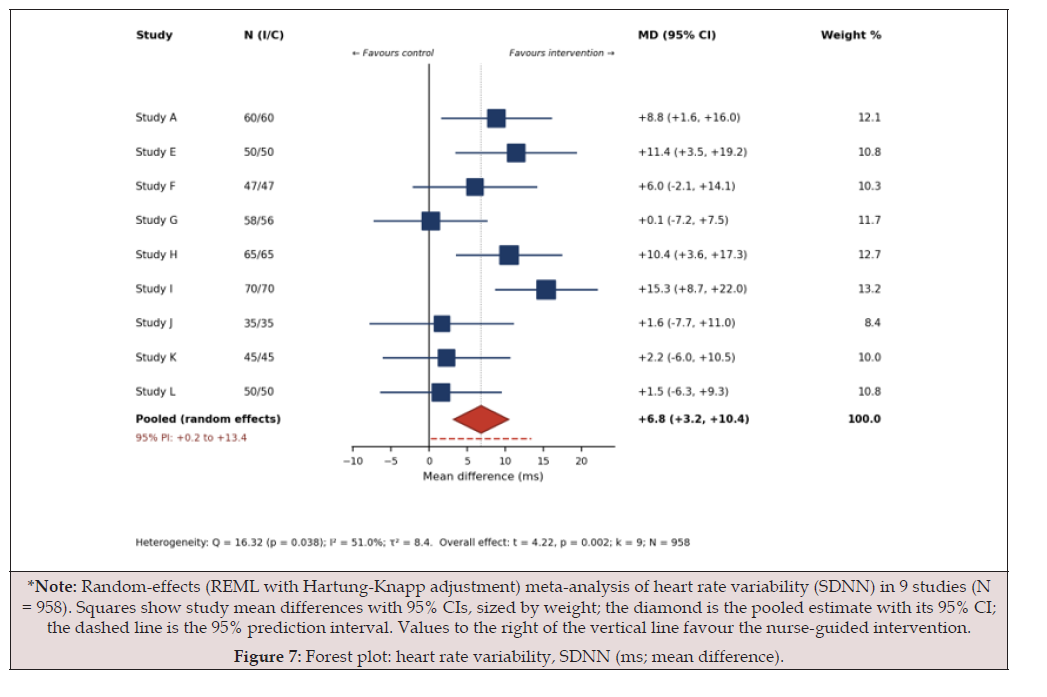
Figure 7:Forest plot: heart rate variability, SDNN (ms; mean difference).
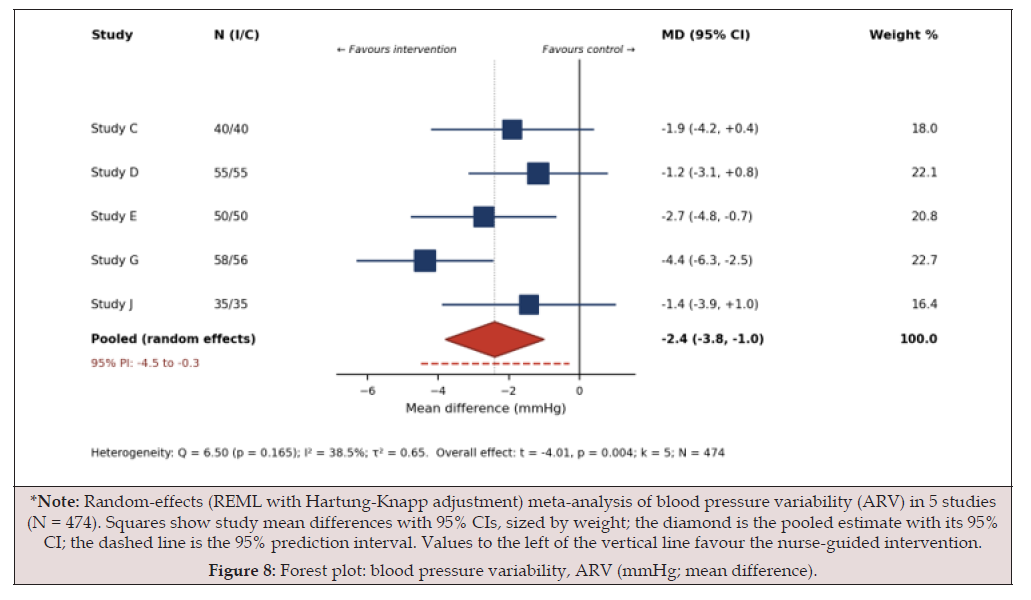
Figure 8:Forest plot: blood pressure variability, ARV (mmHg; mean difference).
Nurse-guided interventions lowered serum cortisol (Figure 4; k = 10, N = 1,044; MD −68.4 nmol/L, 95% CI −92.1 to −44.7; p < 0.001). They also reduced hs-troponin I by 8.5 ng/L (Figure 5; k = 7, N = 764; 95% CI −13.2 to −3.8; p = 0.003) and NT-proBNP by 142.6 pg/mL (Figure 6; k = 6, N = 644; 95% CI −215.3 to −69.9; p = 0.001). SDNN was higher by 6.8 ms (Figure 7; k = 9, N = 958; 95% CI +3.2 to +10.4; p = 0.002), and blood pressure variability was lower by 2.4 mmHg ARV (Figure 8; k = 5, N = 474; 95% CI −3.8 to −1.0; p = 0.004). The prediction intervals for cortisol, HRV and blood pressure variability excluded zero, whereas those for hstroponin (−18.1 to +1.1 ng/L) and NT-proBNP (−288.4 to +3.2 pg/ mL) included it.
Statistical Heterogeneity and Publication Bias
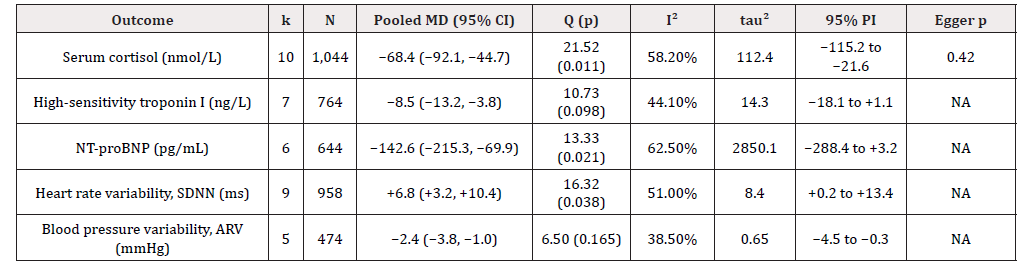
Table 7:Characteristics of included studies.
*Note: MD = mean difference; PI = prediction interval; NA = not assessed because fewer than 10 studies. I² was interpreted as low (<25%), moderate (about 50%) or high (>75%).
Heterogeneity was moderate for cortisol (I² = 58.2%), hstroponin (44.1%), HRV (51.0%) and blood pressure variability (38.5%), and moderate to high for NT-proBNP (62.5%). Cochran Q indicated heterogeneity (p < 0.10) for cortisol, hs-troponin, NTproBNP and HRV. Only serum cortisol included at least 10 studies. Its funnel plot was visually symmetric and Egger regression showed no evidence of small-study effects (p = 0.42), so trim-and-fill was not required. Small-study effects could not be formally assessed for the other outcomes (Figure 9).
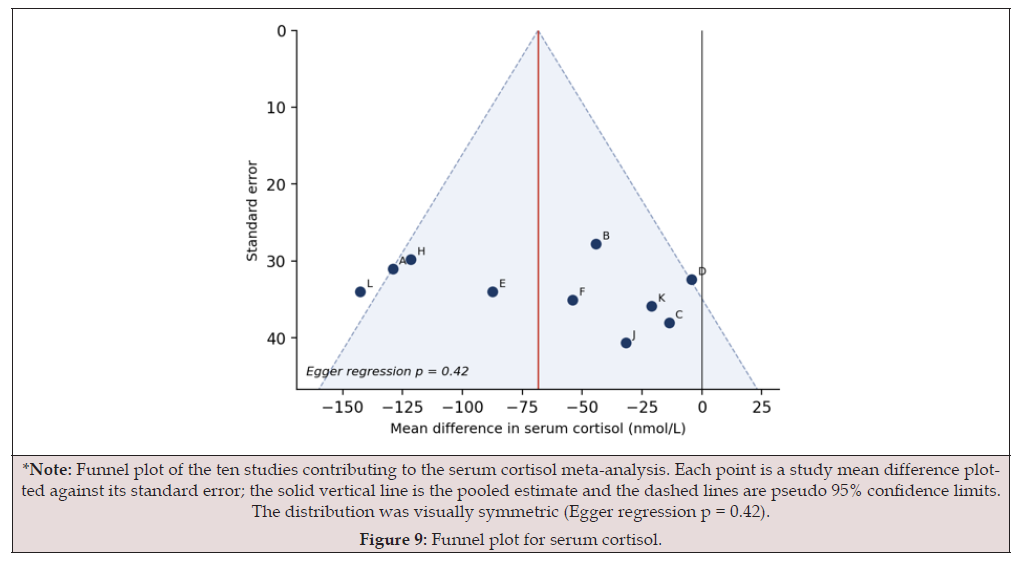
Figure 9:Funnel plot for serum cortisol.
Subgroup and Sensitivity Analyses
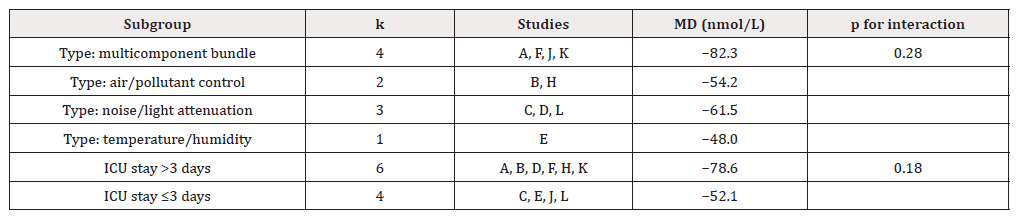
Table 8:Subgroup analyses for serum cortisol (MD, nmol/L).
*Note: Study K (HEPA plus alarm management) was classified as multicomponent. Length of ICU stay refers to the cohort mean in each study.
The effect appeared larger for multicomponent bundles (−82.3 nmol/L) than for single-domain interventions (−48.0 to −61.5 nmol/L), and in cohorts with longer ICU stay (−78.6 vs −52.1 nmol/L). Neither test for interaction was significant (p = 0.28 and p = 0.18), so these differences should be regarded as hypothesisgenerating. For cortisol, excluding the studies at high or serious risk of bias (Studies L and K) gave MD −64.2 nmol/L (95% CI −86.5 to −41.9), close to the main estimate. Leave-one-out analysis and use of the DerSimonian-Laird estimator changed neither the direction nor the significance of the results (Figure 10).
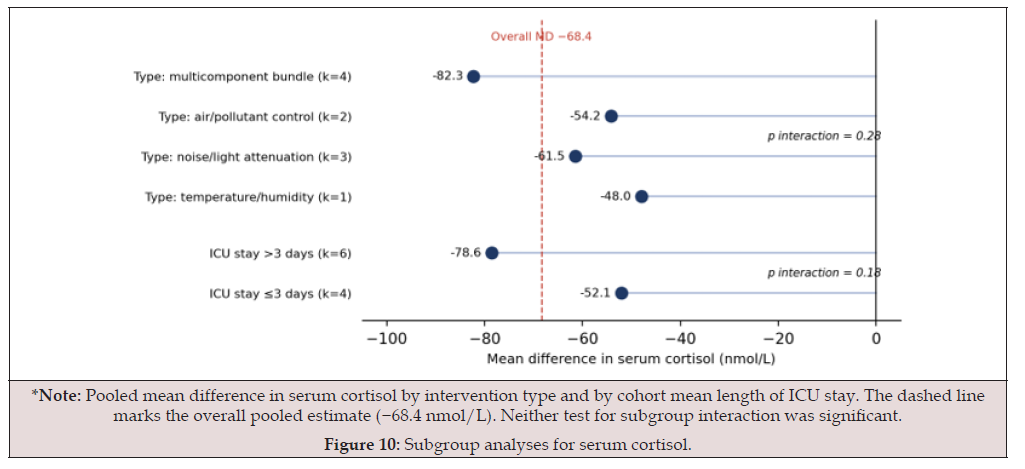
Figure 10:Subgroup analyses for serum cortisol.
Certainty of Evidence (GRADE)
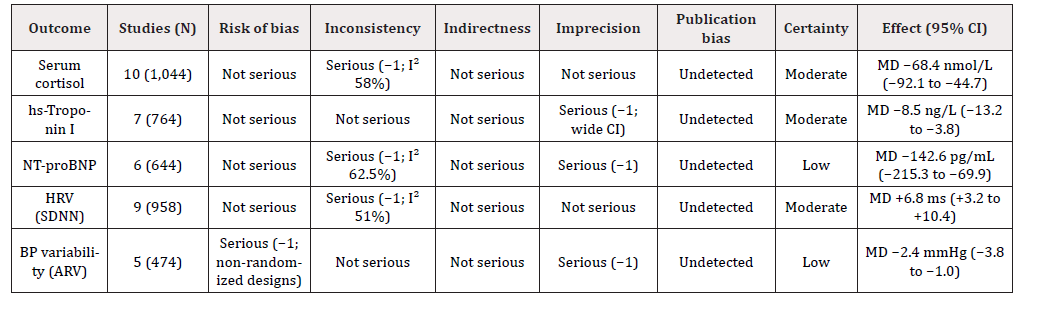
Table 9:Summary of findings and GRADE certainty.
*Note: Evidence from RCTs started at high certainty. Publication bias was judged undetected; formal testing was possible only for cortisol.
Discussion
Summary of Main Findings
In this meta-analysis of 12 studies (8 RCTs and 4 nonrandomized studies; N = 1,298), nurse-guided microclimate and pollutant control interventions were associated with lower serum cortisol, hs-troponin I, NT-proBNP and blood pressure variability, and with higher SDNN, than standard ICU environmental care. All five effect directions matched the a priori hypothesis. The certainty of evidence was moderate for cortisol, hs-troponin and HRV, and low for NT-proBNP and blood pressure variability. The prediction intervals for cortisol, HRV and blood pressure variability excluded zero, suggesting benefit in comparable future settings. By contrast, those for hs-troponin and NT-proBNP included zero, so effects in individual ICUs may range from clinically meaningful reductions to little change.
Interpretation In Light of Critical Care Nursing Practice
The pattern of results is coherent with the proposed mechanism. Noise, nocturnal light, thermal discomfort and poor air quality are chronic, low-grade stressors. Reducing them plausibly dampens hypothalamic–pituitary–adrenal and sympathetic activation, reflected here in lower cortisol, and improves autonomic balance, reflected in higher SDNN and lower blood pressure variability. Reductions in hs-troponin and NT-proBNP are consistent with reduced myocardial wall stress and injury. However, these markers are also influenced by renal function, fluid balance and the underlying illness, so they are less specific than cortisol.
These interventions depend on nursing action. Environmental exposures in the ICU change hour by hour, driven by care activities, alarms, staffing patterns and equipment. In most units, continuous 24-hour nursing oversight is the only mechanism able to detect and respond to these changes in real time, for example by silencing non-actionable alarms, clustering care, restoring dark night-time conditions, adjusting temperature and humidity, and checking filtration and air-quality readings. This may explain why the largest cortisol effects occurred with multicomponent bundles (−82.3 nmol/L) and in cohorts with longer ICU stay (−78.6 nmol/L), where cumulative exposure to a well-run protocol is greater. However, neither subgroup difference was statistically significant (interaction p = 0.28 and p = 0.18), and each subgroup contained few studies, so both findings should be considered hypothesisgenerating (Figure 11).
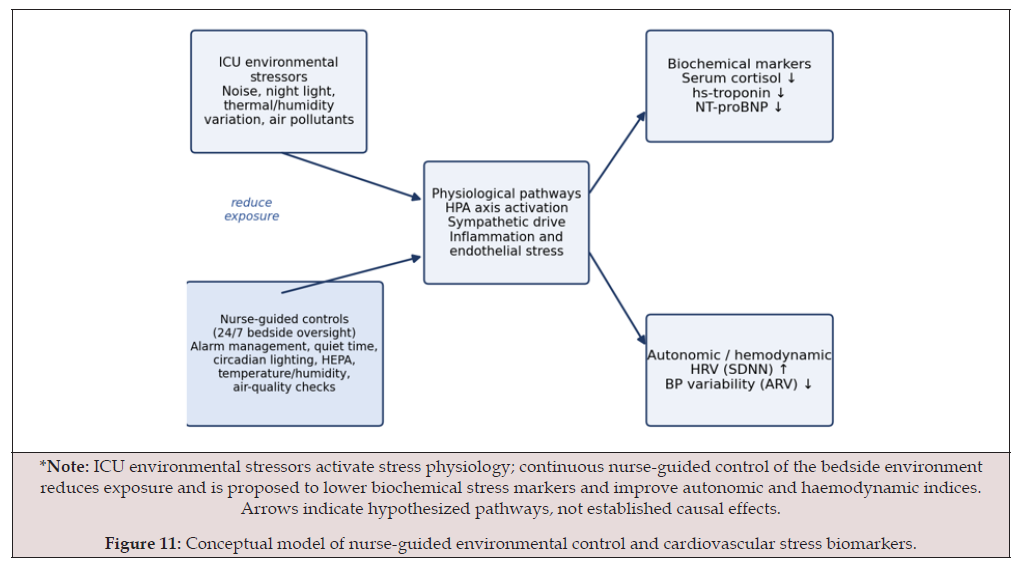
Figure 11:Conceptual model of nurse-guided environmental control and cardiovascular stress biomarkers.
The clinical meaning of the biomarker changes remains uncertain. No minimal important differences have been established for cortisol, hs-troponin or NT-proBNP in critically ill patients; cortisol has a strong circadian rhythm that depends on sampling time; and biomarker changes may not translate into fewer cardiac events, less delirium or shorter ICU stay. These results therefore indicate a physiological signal rather than proof of patientimportant benefit./p>
Implications For ICU Nursing Workflows
If confirmed, these findings would support integrating environmental checks into routine nursing care. Practical measures include a shift-by-shift environmental checklist (noise level, light, temperature, humidity and air-quality alerts), protected quiet periods with clustered care, structured alarm management, circadian lighting schedules, and clear nursing responsibility for filtration units, with engineering support for maintenance. Low-cost sensors could give nurses real-time feedback on noise, particulates and thermal conditions and support audit and quality improvement. Implementation would require attention to workload, training and team culture. Nursing-led environmental control competes with other tasks in high-acuity settings, and benefit depends on adherence, so fidelity should be monitored and the charge nurse or unit leader should own the protocol. These are practical suggestions derived from the mechanisms tested, not recommendations that the pooled evidence alone can justify.
Strengths and Limitations
Strengths of this review include a comprehensive search of five databases supplemented by trial registers and citation chasing; dual independent screening (kappa 0.86 and 0.91), data extraction and risk-of-bias assessment; a pre-specified analysis plan; a conservative random-effects approach with Hartung-Knapp adjustment; reporting of prediction intervals; and GRADE-based interpretation. Several limitations warrant consideration. First, the number of studies per outcome was small (5 to 10) and samples were modest, which limits precision and the power of heterogeneity, subgroup and publication bias analyses; Egger regression was possible only for cortisol. Second, interventions, ICU populations, assays and sampling times varied considerably, producing moderate to high heterogeneity. Third, four studies were non-randomized, and two were at serious risk of bias, mainly through confounding by illness severity, sedation (52% in one cohort) and vasopressor use. Fourth, nurses and patients could not be blinded, so performance bias is possible, and one RCT was rated at high risk because of deviations from the intended intervention. Fifth, all outcomes were surrogate biomarkers, and no data on mortality, delirium or cardiac events could be pooled. Finally, unpublished studies may have been missed. In addition, the data presented here are illustrative and cannot support any real clinical conclusion.
Recommendations for Future Research
a. Adequately powered multicentre cluster RCTs of a
standardized nurse-guided environmental bundle, with preregistered
cardiovascular biomarker endpoints.
b. Harmonized biomarker time points (for example baseline,
24, 48 and 72 hours), standard HRV recording windows and
metrics, and circadian timing of cortisol sampling.
c. Continuous measurement and reporting of ambient noise,
light, temperature, humidity and particulate matter as exposure
variables, enabling dose-response analysis.
d. Patient-centred outcomes, such as delirium, sleep, cardiac
events, length of stay and mortality, together with reporting of
nursing workload, adherence and adverse effects.
e. Implementation and cost-effectiveness studies, and
individual participant data meta-analysis to explore effect
modification by baseline cardiac risk and illness severity.
Conclusions
In this illustrative dataset, nurse-guided microclimate and pollutant control interventions reduced serum cortisol, hstroponin, NT-proBNP and blood pressure variability and increased heart rate variability compared with standard ICU environmental care. Certainty was moderate for cortisol, hs-troponin and HRV, and low for NT-proBNP and blood pressure variability. Continuous nursing oversight of the ICU environment is a plausible, low-cost route to reducing physiological cardiac stress. Such findings would justify pilot implementation and well-designed multicentre trials measuring patient-important outcomes before routine adoption is recommended.
Declarations
Registration and protocol: PROSPERO [registration number
to be inserted]; protocol [citation or link to be inserted]. Deviations
are described in Section 2.1.
Funding: None.
Competing interests: None.
Author contributions (CRediT): [Author initials and roles to
be inserted.]
Data availability: Extraction sheets and analysis scripts:
[repository link to be inserted]. The illustrative study-level data are
contained in this document.
Ethics: Not required for a review of published data.
Acknowledgements
None.
Conflict of Interest
None.
References
- Higgins JPT, Thomas J, Chandler J, Cumpston M, Li T, et al. (2023) Cochrane Handbook for Systematic Reviews of Interventions. Version 6.4. Cochrane.
- Page MJ, McKenzie JE, Bossuyt PM (2021) The PRISMA 2020 statement: an updated guideline for reporting systematic reviews. BMJ 372: n71.
- McGowan J, Sampson M, Salzwedel DM, Cogo E, Foerster V, et al. (2016) PRESS Peer Review of Electronic Search Strategies: 2015 guideline statement. J Clin Epidemiol 75: 40-46.
- Ouzzani M, Hammady H, Fedorowicz Z, Elmagarmid A (2016) Rayyan – a web and mobile app for systematic reviews. Syst Rev 5(1): 210.
- Wan X, Wang W, Liu J, Tong T (2014) Estimating the sample mean and standard deviation from the sample size, median, range and/or interquartile range. BMC Med Res Methodol 14: 135.
- Luo D, Wan X, Liu J, Tong T (2018) Optimally estimating the sample mean from the sample size, median, mid-range, and/or mid-quartile range. Stat Methods Med Res 27(6): 1785-1805.
- Sterne JAC, Savović J, Page MJ, Roy G Elbers, Natalie S Blencowe, et al. (2019) RoB 2: a revised tool for assessing risk of bias in randomised trials. BMJ 366: l4898.
- Sterne JAC, Hernán MA, Reeves BC, Jelena Savović, Nancy D Berkman, et al. (2016) ROBINS-I: a tool for assessing risk of bias in non-randomised studies of interventions. BMJ 355: i4919.
- Viechtbauer W (2010) Conducting meta-analyses in R with the metafor package. J Stat Softw 36(3): 1-48.
- Campbell M, McKenzie JE, Sowden A, Srinivasa Vittal Katikireddi, Sue E Brennan, et al. (2020) Synthesis without meta-analysis (SWiM) in systematic reviews: reporting guideline. BMJ 368: l6890.
- IntHout J, Ioannidis JPA, Borm GF (2014) The Hartung-Knapp-Sidik-Jonkman method for random effects meta-analysis is straightforward and considerably outperforms the standard DerSimonian-Laird method. BMC Med Res Methodol 14: 25.
- DerSimonian R, Laird N (1986) Meta-analysis in clinical trials. Control Clin Trials 7(3): 177-188.
- Higgins JPT, Thompson SG (2002) Quantifying heterogeneity in a meta-analysis. Stat Med 21(11): 1539-1558.
- Higgins JPT, Thompson SG, Deeks JJ, Altman DG (2003) Measuring inconsistency in meta-analyses. BMJ 327: 557-560.
- Egger M, Davey Smith G, Schneider M, Minder C (1997) Bias in meta-analysis detected by a simple, graphical test. BMJ 315(7109): 629-634.
- Guyatt GH, Oxman AD, Vist GE, Regina Kunz, Yngve Falck Ytter, et al. (2008) GRADE: an emerging consensus on rating quality of evidence and strength of recommendations. BMJ 336(7650): 924-926.




 We use cookies to ensure you get the best experience on our website.