Research Article 
 Creative Commons, CC-BY
Changes in Relative Height of Children in Northeast Asian Countries in Fifty Years Since 1960
*Corresponding author: Hiroshi Mori, Institute for Social Sciences, Senshu University, Kawasaki, Japan the0033@isc.senshu-u.ac.jp.
Received: December 09, 2019; Published: December 16, 2019
DOI: 10.34297/AJBSR.2019.06.001067
Abstract
Economies in Northeast Asia made rapid and steady progress in the past half century, since 1960. Food consumption improved remarkably. Total calorie intakes increased first, followed by steady increments in animal sourced foods. Children became appreciably taller in height. In the mid-2000s, teens in South Korea were the tallest, 3cm taller than their Japanese and Taiwanese peers. In terms of per capita consumption of animal products, S. Korea was apparently the lowest. Genetics, however, fails to explain. A century ago, young men in Korea were 2 cm taller than Japanese but 3 cm shorter than Taiwanese. Since the mid-1970s, S. Koreans have been taking 2-300 kcal/day more overall food calories and twice as much vegetables than both Japanese and Taiwanese.
Keywords: Body height; Standard of living; Animal-sourced foods; Vegetables; Japan; Taiwan; South Korea
Introduction
Stature is a net measure that captures not only the supply of inputs to health but demands on those inputs (Stature and the Standard of Living) [1]. Japan’s economy recovered from the war devastation to the pre-war level in 1955 and made rapid and steady growth toward the 1990s, despite the two world-wide oil-crises. The standard of living increased and food consumption improved appreciably in quantity and quality. Per capita meat consumption, for example, increased from 7-8 kg/year in the pre-war years to 27.5 kg in 1960, and 91.3 and 159.4 kg in 1970-74 and 1990-94, respectively [2] . Accordingly, children grew remarkably taller in height, i.e. mean height of boys in high school senior grade, 17 years of age, increased from 161.0 cm in 1930 and 161.8 cm in 1950, respectively to 165.0 cm in 1960, 168.8 cm in 1975, and 170.4 cm in 1990, respectively and ceased to grow significantly taller in the early 1990s.
Young men in Japan may have reached racial/genetic potentials. In 1980, young men, 20 years of age, in the Netherlands were 184 cm tall in mean height and 10 and 15 cm taller, respectively than those in France and Portugal. Some 100 years ago, in 1860-70, those in the Netherlands were 165 cm in mean height, only 1-2 cm taller than their peers in France and Portugal [3] . The author surmises that it should be too easy to attribute the differences in height observed at the given period of historical time between countries in the same region on the earth to racial or genetic traits. In terms of per capita caloric intakes from animal products, Portugal was 500 kcal/day, as compared to 1112 kcal/day for the Netherland in 1970 [4] , for example. It is widely recognized in the arena of human biology that consumption of “high-quality proteins” is highly correlated to human height [5, 6, 7]. Little questions remain about this. When the cases of three countries in Northeast Asia are examined, however, attributing human height developments to animal proteins alone seems to have proved empirically questionable [8, 9].
Secular Changes in Child Height in Japan, South Korea and Taiwan
School health surveys have been conducted on the nationwide scale since 1900 in Japan and since 1960, to the author’s command, in South Korea and Taiwan, respectively. (Table 1) provides mean height of boys in the elementary 1st grade (6 years of age), junior high school 1st grade (12 years old) and high school 3rd grade (17 years old) in Japan, S. Korea and Taiwan by 5 year-intervals from 1960 to 2010 [10-12]. Boys in the three countries grew significantly taller in height in the past 50 years since 1960. Fine details set aside, Japanese boys were 2-3cm taller, regardless of age groups, than their peers in S. Korea and Taiwan in the 1960s through the mid-1970s, only slightly, 1 cm or less, taller in the mid-1980s and then ceased to grow significantly taller in height, whereas boys in S. Korea and Taiwan kept growing taller appreciably to overtake their peers in Japan by 2 cm in the mid-1990s. Boys in S. Korea kept growing further to surpass their Japanese peers by at least 3cm in the mid-2000s. Boys in Taiwan, however, became slightly shorter since the late-1990s, to be as tall as their Japanese peers in the late- 2000s, for unidentifiable reasons.
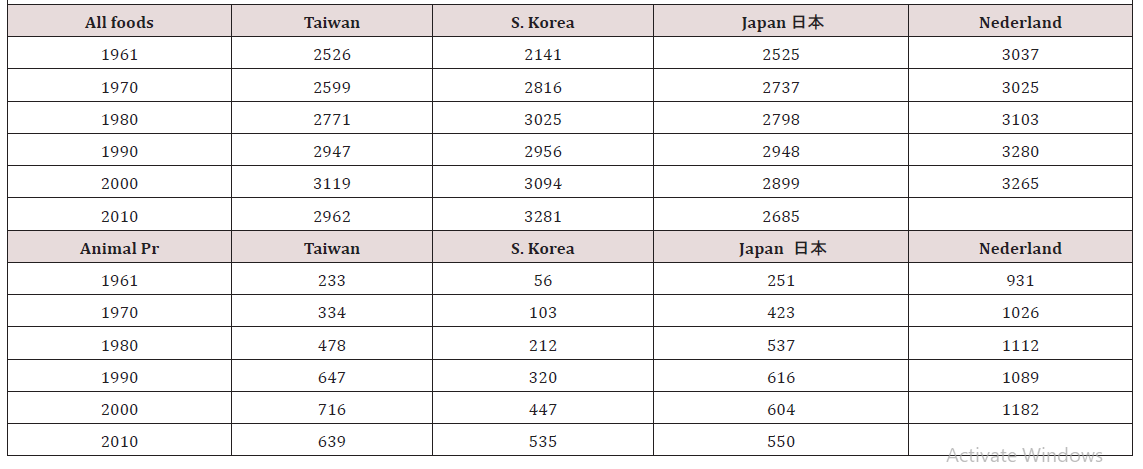
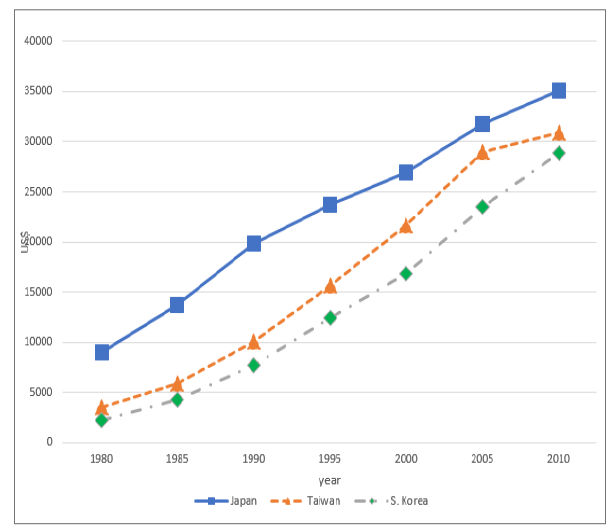
(Table 1a)As the economy grew, the inputs to health improved and stature increased accordingly. This happened unequivocally in the past half century in Northeast Asian countries. In respect of per capita GDP, however, Japan was the richest, followed by Taiwan, with S. Korea very far behind in the1980s. The bubble burst in Japan’s economy at the outset of the 1990s, followed by the decade long stagnation. In the beginning of this century, however, Japan was 25 % larger than Taiwan and more than 50% larger than S. Korea in per capita GDP (in purchasing parity US$), as shown in (Figure 1) [13] . (Table 2) demonstrates that per capita caloric intake from animal products in S. Korea was very low at 56 kcal/day in in 1961, as compared to 251 and 233 kcal/day in Japan and Taiwan, respectively (for reference: 931 kcal/day in Netherlands at the same time). Intakes from animal products rose sharply in S. Korea to 272 and 472 kcal/day in the mid-1980s and the mid-2000s, respectively, but remained substantially lower than 580 and 590 kcal/day, and 586 and 673 kcal/day, respectively in Japan and Taiwan over the corresponding period [4] .

Table 2: Changes in per capita caloric intakes from food products in Japan, Taiwan, and South Korea, 1961-2010 (kcal/day) [4].
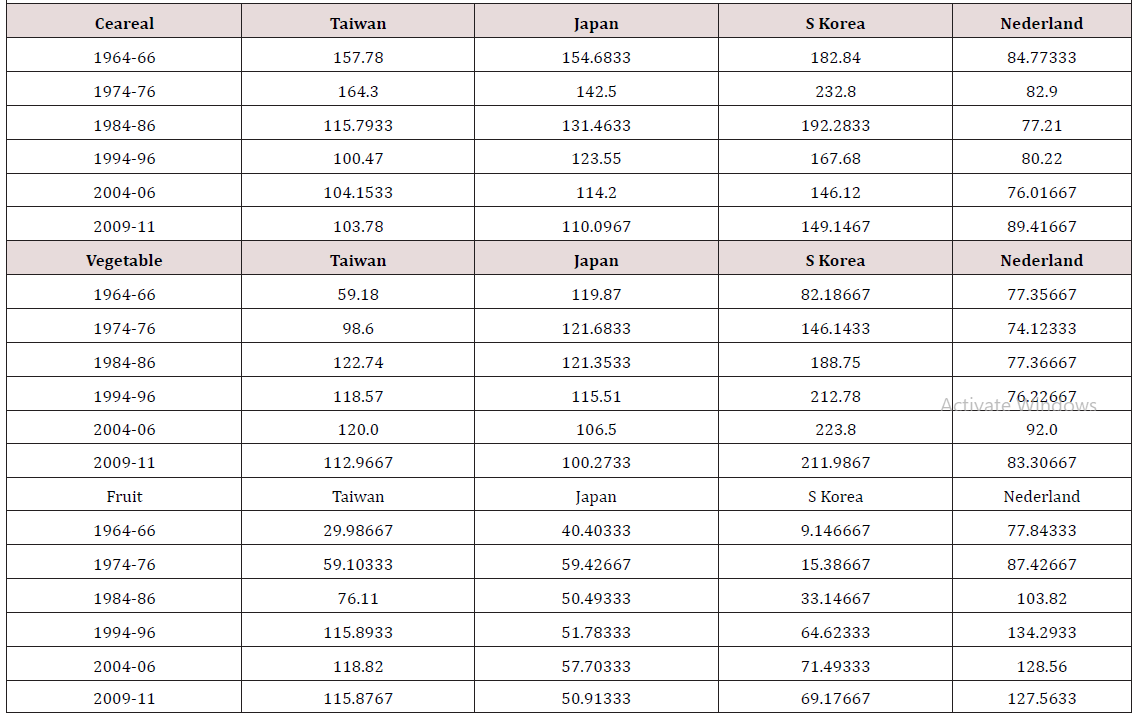
In respect of per capita milk consumption, S. Korea was extremely low at 5.4 kg/year, just one tenth that in Japan in the mid-1970s, rose to 26.0 kg in the mid-1980s, when South Korean children grew nearly equal in height as their Japanese peers, and then steadily increased to 49.5 kg in the mid-1990s and 56.9 kg in the mid-2000s, still 40% less than in Japan in 2005 [4] . On the other hand, South Koreans have long been eating substantially greater amounts of vegetables than either Japanese or Taiwanese. Per capita consumption of vegetables in S. Korea was 197.9 kg/ year in 1980, rose to 235.7 kg in 2000, whereas that in Japan was 122.6 and 112.8 kg/year and that in Taiwan was 130.2 and 134.4 kg/year, respectively in 1980 and 2000 [4] . Koreans eat a lot of rice with vegetables in all sorts of kimchi [14, 15]. As mentioned earlier, South Koreans have been taking 2-300 kcal/day more food calories than either Japanese or Taiwanese since the early 1970s and yet, obesity has not been a serious social problem in South Korea in the mid-2000s, as the author has heard of.
Per capita net supply (=consumption) of milk excluding butter for Republic of Korea is abnormally undercalculated by FAOSTAT, Food Balance Sheets, particularly for the period after the mid- 1980s. The author recalculated per capita milk consumption for the three countries, by dividing total supply by population as reported in Population, FAOSTAT (Table 3).
Steering Away from Fruit and Vegetables by Japanese Children
The author has been calling for attention to the wide-spread tendency of wakamono no kudamono banare in Japan (steering away from fruits by Japanese young) as a possible mal-impacts on child height growth. According to a few empirical cohort studies, consumption of fruit and vegetables have measurable impacts on bone mineral accrual for prenatal and growing children [16, 17, 18, 19]. Boys reach their maturity in height at age of 17-18 years and girls a little younger, 16-17 years of age. “Inputs to health”, or intakes of nutrients, both in quantity and quality, past these maturity ages rarely affect the human height development. When we discuss changes in child height between countries or over time, changes in per capita consumption by age groups, infants, pre-adolescence, and adolescence, and young adults, ---, should be desirable.
National Health and Nutrition Surveys by Japanese government Ministry of Health and Welfare started to publish daily nutrition intakes by age groups, 0~6, 7~14, 15~19, 20~29, --, 70~, in 1995 [20] . S. Korea’s counterpart, Korea National Health and Nutrition Examination Survey (KNHANES) was first published in 1998, followed by the 2nd survey in 2001, the 3rd one in 2005 [21] . Regrettably, these nutrition surveys, classified by exact age groups, seem to be too late in timing to identify child height development since 1960 to 2010. Cole and Mori (2017) state “most of the height increment seen in adults had already accrued by age 1.5 years” [22]; Mori (2019), reprising Cole and Mori, states “most of the height increment seen in high school senior graders had accrued by 1st-2nd graders in elementary school” [9] .
Starting in the early 1970s, Family Income and Expenditure Surveys (FIES) [23] , Japanese government the Bureau of Statistics publishes household purchases (=at-home consumption) of various goods and services, classified by age groups of household head (HH). The author and his associates designed a simple but robust model to derive per capita at-home consumption by household members by age from FIES annual data, by explicitly incorporating family age structure by HH age groups [24, 25]. Tables 4 and 5 provide the author’s estimates of per capita at-home consumption of fresh vegetables and fresh fruit by age groups of family members, from the early 1970s to 2010 in Japan.

Table 4: Changes in per capita at-home consumption of fresh fruit by age groups, 1971 to 2010, Japan (kg/year).Sources: derived from FIES by the author, using the TMI model.

Table 5: Changes in per capita at-home consumption of fresh veges by age groups, 1971 to 2010, Japan.Sources: derived from FIES by the author, using the TMI model.
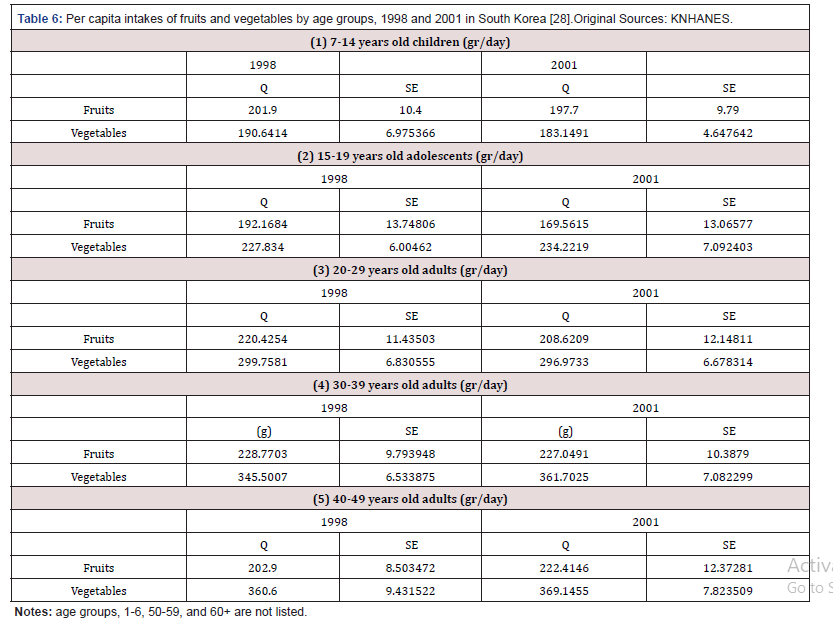
Per person household or at-home consumption of fresh vegetables gradually declined from 67.1 kg(/year) in the early 1970s to 58.3 kg in 1990 and then to 55.4 kg in 2010 in Japan. That of fresh fruit declined more sharply from 45.6 to 33.8 and 27.7 kg over the same period. In the early 1970s, teens ate at home 62.2 kg of vegetables, only slightly lower than national average, 67.1 kg but they began to decrease their at-home consumption of vegetables to 30.0 kg in 2000, whereas the older adults in their 50s and over kept their consumption at the initial level, some 80 kg. The case for fresh fruit is quite dramatic, i.e., teens ate 45.6 kg of fresh fruit at home in the early 1970s, comparable to the national average but they began to decrease their fruit consumption rapidly to 5.7 kg/ person, less than one tenth the level the older household members in their 60s and over in 2000. Children and young adults in Japan have drastically steered away from fresh fruit. Some of the industry experts claim that young students on the university campus do not care for fresh fruit, because they find it of nuisance to peel the skin off. Instead, they drink fruit juice [26] . This contention is not founded statistically. Total shipments of fruit juice and drinks declined from 2,000 kilo-litters in the early 1990s to 1,500 kilolitters in the late 2000s [27] . Todays’ Japanese children simply do not care for fruit, fresh or juice. In these regards, children and young adults in South Korea do not seem to have steered away from either vegetables or fruit in the turn of the century, as shown in Table 6 [28] . This statement does not imply the betterment or worsening in nutritional intakes past these early years of life has nothing to do with the final development of human height. See [2, 9].

Table 6: Per capita intakes of fruits and vegetables by age groups, 1998 and 2001 in South Korea [28].Original Sources: KNHANES.
Conclusion
Children in Northeast Asia have grown remarkably taller in height in the past half century, since 1960. Teens in South Korea have grown the most, i.e., 3cm taller than their Japanese and Taiwanese peers in the mid-2000s. The economic development has been fantastic in the three countries, with South Korea distinctly behind Taiwan and Japan in terms of per capita GDP. In respect of per capita caloric intakes from animal products, South Korea was distinctly lower than Japan and Taiwan. Are Koreans genetically taller than Japanese? Probably so. But young men in Korea were 3cm shorter than their peers in Taiwan a century ago, when the two countries were under Japan’s colonization.
People in South Korea have been taking 2-300 kcal/day more food calories than people in Japan and Taiwan and eating nearly twice as much vegetables in various forms of kimchi as people in both Japan and Taiwan since the mid-1970s. “Population consuming larger amounts of animal protein reach higher average height than countries with less animal protein consumption” [29] . “However, a high consumption of animal proteins alone does not result in increasing body height if the overall consumption of calories and other essential nutrients is insufficient” [30] . This statement could apply to Japan and Taiwan in contrast with South Korea in the past few decades. Japanese children may have been insufficient in consumption of “essential nutrients” from vegetables and fruit in the past few decades in contrast with South Korea.
References
- Steckel Richard H (1995) Stature and the standard of living. Journal of Economic Literature 33(4): 1903-1940.
- Mori Hiroshi (2018b) Secular trends in child height in post-war Japan: Nutrition throughout childhood. Recent Advances in Food Science 1(2): 75-84.
- Tuebingen University, Human Height.
- FAO of the United Nations. FAOSTAT. Food Balance Sheets, by country and year, online.
- Headey D, K Hirvonen, J Hoddinott (2018) Animal sourced foods and child stunting. Am J Ag Economics 100(5): 1302-1319.
- Hatton, Timothy F (2013) How have Europeans grown so tall? Oxford Economic Papers (Advance Access published in September 1), Oxford University Press p. 1-24.
- Grasgruber P, J Cacek, T Kalina, M Sebera (2014) The Role of nutrition and genetics as key determinants of the positive height trend. Economics and Human Biology 15: 81-100.
- Mori Hiroshi (2018a) Why Koreans became taller than Japanese? Annual Bulletin of Social Science, Senshu University 52: 177-195.
- Mori Hiroshi (2019) Secular trends in child height: Is genetics the key determinant? Am J Biomed Sci & Res 4(6): 228-240.
- Japanese Government. Ministry of Education. School Health Examination Survey, various issues, Tokyo.
- Hiroshi Mori (2018) Secular Changes in Child Height in Japan and South Korea: Consumption of Animal Proteins and “Essential Nutrients”. Food and Nutrition Sciences 9(12).
- Olds Kelly B (2019) Professor, Dept of Economics, National Taiwan University (Courtesy).
- World Bank, Data Base.
- Lee Jung Sug, Jeongseon Kim (2010) Vegetable intake in Korea: data from the Korean National Health and Nutrition Examination Survey 1998, 2001 and 2005. British Journal of Nutrition 103(10): 1499-1506.
- Kim EK, AW Ha, EO Choi, SY Ju (2016) Analysis of kimchi, vegetables and fruit consumption trends among Korean adults: data from the Korean Health and Nutrition Examination Survey (1998-2012). Nutrition Research and Practice 10(2): 188-197.
- Mc Gartland CP, PJ Robson, Murray LJ, Cran GW, Savage MJ, et al. (2004) Fruit and vegetable consumption and bone mineral density: Northern Ireland Young Hearts Project. Am J Clin Nutr 80(4): 1019-1023.
- Vatanparast H, A Baxter Jones, RA Faulkner, DA Bailey, SJ Whiting (2005) Positive effect of vegetable and fruit consumption and calcium intake on bone mineral accrual in boys during growth from childhood to adolescence: The University of Saskatchewan Pediatric Bone Mineral Accrual Study. Am J Clin Nutr 82(3): 700-706.
- Whiting S, H Vatanparast, Baxter Jones A, Faulkner RA, Mirwald R, et al. (2004) Factors that affect bone mineral accrual in the adolescent growth spurt. J Nutr 134(3): 696S-700S.
- Prynne CJ, GD Mishra, O Connell MA, Muniz G, Laskey MA, et al. (2006) Fruit and vegetable intakes and bone mineral status: A cross sectional study in 5 age and sex cohorts. Am J Clin Nutr 83(6): 1420-1428.
- Japanese Government. Ministry of Health, Labor and Welfare. National Nutrition Survey in Japan, various issues, Tokyo.
- Republic of Korea, Korea Centers for Disease Control and Prevention. Korea National Health and Nutrition Examination Surveys.
- Cole TJ, H Mori (2018) Fifty years of child height and weight in Japan and South Korea: Contrasting secular trend patterns analyzed by SITAR. Am J Hum Biol 30(1).
- Japanese Government, Ministry of General Affaires, Bureau of Statistics. Annual Report of Family Income and Expenditure Survey, various issues, Tokyo.
- Mori H, T Inaba (1997) Estimating individual fresh fruit consumption by age from household data, 1979 to 1994. Journal of Rural Economics 69(3): 175-185.
- Tanaka M, H Mori, T Inaba (2004) Re-estimating per capita individual consumption by age from household data. Japanese Journal of Rural Economics 6: 20-30.
- Iba Yoshiaki (2001) Professor of Horticultural Science, Utsunomiya University: Former Senior Fellow, National Institute of Fruit Tree Science: Chair, Stagnation of fruit consumption from age perspectives in Japan, H Mori eds. Cohort Analysis of Japanese Food Consumption, Tokyo, Senshu University Press p. 51-92.
- Soft Drinks Manufacturers Association (2013) Annual Statistical Report on Soft Drinks, Tokyo (in Japanese).
- Park Junghyun (2018) Dept of Nutrition, Gachon University, Courtesy.
- Baten J, M Blum (2014) Why are you tall while others are short? Agricultural production and other proximate determinants of global heights. European Review of Economic History 18(2): 144-165.
- Blum Matthias (2013) Cultural and genetic influences on the ‘biological standard of living’. Historical Method 46(1): 19-30.


 We use cookies to ensure you get the best experience on our website.