Research Article 
![]() Creative Commons, CC-BY
Creative Commons, CC-BY
The Drying of Spent Coffee Grounds in a Tray Drier
*Corresponding author: Enrico N Martinez, Davidson School of Chemical Engineering, Purdue University, 480 Stadium Mall Dr, West Lafayette Indiana 47907, USA.
Received: December 11, 2019; Published: December 17, 2019
DOI: 10.34297/AJBSR.2019.06.001074
Abstract
Biodiesel has become an important sustainable alternative to petroleum-based diesel. Spent coffee grounds as a starting material to produce biodiesel can be cost effective especially if the grounds are dried before extracting the coffee oil. This work is part of a comprehensive research project to develop a sustainable biodiesel production process and focuses on the drying of spent coffee grounds using a laboratory tray drier. The drying kinetics were studied using two and four samples with controlled geometries at three different air flow rates and temperatures of 28, 30 and 32°C. The experimental data were used to determine the critical transport parameters in the drying process. Effective diffusivities varied from 1.03x10⁻¹¹ to 8.11x10⁻¹⁰m2/s. The convective mass transfer coefficient was found to vary from 1.25x10⁻⁷ to 3.78x10⁻⁶m/s, while the heat transfer coefficient varied from eight to 31.2W/m2°C.
Keywords: Spent coffee grounds; Biodiesel; Drying kinetics; Effective Moisture Diffusivity; Convective transfer coefficients
Introduction
The strain on the global economy brought by fossil fuels is astounding. With global energy consumption more than doubling in the past forty years, the proportion of consumption via “finite fuels”; oil, coal, and natural gas, has decreased from 75.9% to a still sizeable 66.5% of all fuel usage [1] . As such, there is a wide area of demand for sustainable fuel sources. It is estimated that the 16.34 billion pounds of coffee produced each year can yield about 340 million gallons of biodiesel via extraction of necessary compounds from Spent Coffee Grounds (SCG), not to mention the average of 3.4% annual growth of coffee production over the last four years [2, 3]. Additionally, with the European Union and United States jointly contributing over half of the total world demand of coffee, utilization of this resource could be relatively easy, given the available manufacturing and processing prowess [3] .
In the overall process of biodiesel production from Spent Coffee Grounds, it is possible to obtain an oil yield of 10-20% from the SCG and then a near 100% conversion of that oil to biodiesel, with the finished product being stable for over one month when stored under proper conditions [2] . However, the moisture content of the SCG largely dictates the efficiency of this process, from transport concerns to the actual kinetics of the extraction. For example, the only study published so far on the drying of SCG, utilized SCG with starting and equilibrium moisture contents of about 1.41g moisture/ g dry mass and 0.0753g moisture/g dry mass, respectively [4] . Thus, properly drying SCG can more-than-double the rate of dry basis transport to treatment facilities for various uses including biodiesel production.
On the chemical side, dry SCG have about double the lipid yield of wet SCG (moisture content of 0.66ml/g) [5]. Therefore, drying the SCG also has impact in the efficiency of the process. The drying of solids has been studied extensively, however, there is only one published study on the drying of SCG [4]. The authors used SCG supplied by a local cafeteria in Jaen Spain but there is no mention about the particle size nor the type of coffee. The study was conducted at relatively high temperatures (100 to 250°C) in a convective drier and at a single drying air velocity. Under these conditions, the results did not show a constant rate drying period and therefore, only effective moisture diffusivities were determined, no heat nor mass transfer coefficients were obtained.
Extensive fruit and agricultural products drying studies have been published in which both moisture diffusivities and heat and mass transfer coefficients were determined. Pioneer work was published by Dincer and Dost in 1995 and 1996; in the first study [6], the authors developed an analytical model to determine the moisture diffusivities in geometrical solid objects (infinite slab, infinite cylinder and sphere). New correlations for the roots of the characteristic equations corresponding to these objects were developed; for a drying application, using the similarity between cooling and drying profiles, the drying coefficient and the lag factor are obtained. The model was verified using available data and the results showed that the model can be used to determine moisture diffusion coefficients in such solid objects in a simple and accurate manner for a variety of drying applications.
In the second publication [7], Dincer and Dost presented an effective analytical model to determine the moisture diffusivities and moisture transfer coefficients for solid objects, shapes mentioned above, as well as for irregularly shaped objects by using a shape factor for drying applications. The analytical model was verified using available experimental data and the results showed that the method can be used to determine the moisture diffusion coefficients and moisture transfer coefficients for such solid objects for a variety of drying applications. Later, in a relevant contribution, Dincer et al. [8] developed a new Biot number-drying coefficient correlation that is useful to determine the moisture transfer parameters in terms of moisture diffusivity and moisture transfer coefficient involved in the solids drying process.
In a later work, Dincer and Hussain [9] developed an even more useful and generalized Biot number-lag factor correlation applicable to predict moisture transfer parameters for three regular shaped solids, slab, cylinder and sphere. More recently, Mullen et al. [10] published results for the drying of apple slices in a tray drier at several temperatures and drying air velocities; moisture diffusivity and heat and mass transfer coefficients were reported that are in very good agreement with previous studies. Velic et al. [11] investigated the effect of airflow velocity in the range from 0.64 to 2.75m/s on the kinetics of convection drying of Jonagold apple, and on the heat transfer coefficient and on the effective diffusivity. The experiments were conducted in a convection tray drier at 60oC temperature using rectangle-shaped (20x20x5mm) apple samples. Kinetic equations were estimated by using an exponential mathematical model. Two well defined falling rate periods and a very short constant rate period at lower air velocities were observed.
The heat transfer coefficient and the effective diffusivity increased with increasing airflow velocity. The tray drier used in this work is very similar to the one used in the SCG drying experiments reported in our work. In another study with apple slices, Sacilik & Elcin [12] found the effect of drying air temperature and slice thickness (5 and 9mm) on the drying characteristics of cv. Starking apples in a tunnel drier designed and constructed specifically for this project. The effective diffusivity determined from the experiments conducted at temperatures from 40 to 60°C varied from 2.27x10⁻¹⁰ to 4.97x10⁻¹⁰m2/s, the air flow velocity was 0.8 m/s. Guine et al. studied the kinetics of the convective drying of apples to evaluate the mass transfer properties involved in the process, they found that the effective diffusivity increased with temperature from 4.4x10⁻¹⁰ at 30°C to 1.4x10⁻⁹ m2/s at 60°C, while the mass transfer coefficient increased from 307x10-10 to 7.4x10⁻⁹m/s in the same temperature range [13, 14].
The purpose of the following experimental pursuit is to understand the drying properties of SCG in order to extrapolate fundamental properties about said process for application in the practical production of biodiesel from SCG. Additionally, the findings from this study can be applied to facilitate the transport of coffee grounds for any specific use.
Materials and Methods
Materials

Figure 1: Schematic of the tray drier.
Spent Coffee Grounds (Arabica Coffee Beans) - Seattle’s Best Blend Level 3 Medium Roast were provided courtesy of Beans Cafeteria located in the Materials and Electrical Engineering Building at Purdue University. The grounds were kept in plastic jars and stored in a refrigerator prior to use. The drying apparatus is a duct-like machine that blows air parallel to the trays used for drying. From the control console, the user can set analog values for inlet airflow rate and temperature. The system comes with a scale to measure the total weight of the system, and, using external tools, the user can measure airflow speed, temperature, and humidity upstream and downstream from the sample. The flow rate can be measured at any point along the direction perpendicular to airflow at one-half the length of the duct. A schematic of the drier is shown in (Figure 1).
Experimental set-up and procedure
The drying experiments were carried out in the Hampden Model H-6180 Tray Drier Demonstrator. Two different series of experiments were done, in the first series, two sample cakes of wet coffee grounds were used, 50 grams each. The cake dimensions were 3.5 x 5 x 1.5cm (width/perpendicular to air flow x length/parallel to air flow x height/perpendicular to air flow). The samples were placed in the middle of the air duct for 200 minutes. Recordings of mass along with upstream/downstream dry bulb temperature, wet bulb temperature, humidity, and air flow were taken every ten minutes (except in the case of 23-Feb, which took measurements every five minutes to see if the decreased time interval increased the amount of useful data per sample or increased the accuracy of the final results).
The temperature and humidity values were measured using a hand-held thermo-hygrometer. An anemometer was used to measure flow velocity and it was important for to insert the flowmeter with the same depth each run, in order to obtain reliable data. While the temperature was set to 100°F, the temperature at the point of sample content was 10-20°F lower; this is probably due to heat loss through the sides of the duct. However, it is assumed that this heat loss does not affect the temperature profile of the air that interacts with the sample. As for the air flow, mean inlet air flow seemed weakly-dependent if not independent of the position of the analog, mark-less dial used to set it after a certain point (“noon”).
The dry basis for each coffee grounds cake was found by putting them in an Isotemp 100L Convective Oven (Fisher Scientific) at 70°C for 24 hours and measuring the weight of the dry sample cakes. An average moisture content of 68.2% (wet basis) was determined. The same procedure was used to determine the equilibrium moisture content that was 7% (wet basis) for an ambient air with a 37% relative humidity at 22°C. The trays relate to the digital scale that displays the weight of coffee grounds. The precision of the mass balance is +/- 0.5 grams
Results and Discussion
Assumptions
The airflow is assumed to be well mixed; bulk flow is unidirectional and parallel to the walls of the duct. The only process occurring is the evaporation of water into a passing airstream. Despite the relatively poor precision of the balance inside of the duct dryer (+/- 0.5g), it is assumed that the precision is enough to allow identification of possible constant rate drying periods. During a given constant rate drying period, it can be assumed that the interface temperature is equal to the downstream wet bulb temperature [8]. When calculating the convective heat transfer coefficient, assume that the upstream flow properties are more descriptive of the actual contact system than those downstream.
Control of Environmental Variations
While an ideal system would reach a stable steady state throughout the duration of the experiment, the apparatus has an on/off control of the heater. In short, falling a few degrees below the temperature of interest would activate the air heater, and exceeding a similar amount of degrees above the temperature of interest shuts down the heater. This results in a sinusoidal fluctuation in temperature-dependent variables, including the dry bulb temperature, wet bulb temperature, humidity, and, to an extent, the flow rate. Therefore, a uniform approach to collecting measurements was needed while still accounting for the overall trend. In order to account for the fluctuation, a two-minute video recording of each oscillating measurement was taken after the measuring device had been within the steady-state dryer long enough to not be affected by anything except for the dryer.

Figure 2: Graphical representation of the MATLAB-computed least squares fit of sinusoidal experimental data. See Figure A for scatterplots of recorded data. A: Measuring fluctuations in dry bulb temperature. The standard error for this fit is about 0.893°F. B: Measuring fluctuations in wet bulb temperature with a standard error of 1.278°F. C: Measuring fluctuations in flow rate*. D: Measuring fluctuations in humidity. The standard error for the plotted set above is 17.50%.

Table 1: Sinusoidal Fits to Calibration Data.
All devices used updated their readings about every second, so every data value across the two-minute video was recorded and plotted. With this data, it is possible to use MATLAB to fit a sinusoidal equation to the curve, by establishing the function of interest and then minimizing the least-squares function of that curve (Figure 2) [9]. Considering the standard errors in (Table 1), as well as the graphical representations, the temperature fluctuations have the most stability, and flow rate and humidity have low stability in terms of their periodic trend. What this means is, that when accounting for error in calculations for the drying of coffee grounds, it is possible to, not only predict where most of the error is coming from (air speed and humidity) but also why that category has a significant amount of error (irregular airflow, which may also affect the humidity in terms of flow patterns).
The shifts within all the sine functions are specific to the calibration data. The important values worth noting are:
A. The pre-sinusoidal coefficient (amplitude), which states how far typical measurements could range from the mean.
B. The period, which gives an idea of how frequently the system oscillates (note how the denominators of the period are all approximately the same within about 4%).
C. The y-intercept, which is the mean of the function, not of the experimental data (although the two are almost the same). However, it is possible to approximate the mean for a given periodic variable by measuring the variable’s value at its maximum at any given interval and then subtracting the corresponding amplitude above from that value. This method was used for all four categories above.
Equations and Results
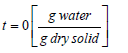
In the coffee drying process, heat and mass transfer occur simultaneously. Heat transfer occurs through conduction, convection, and radiation. In this case, heat transferred via radiation is neglected given the low temperatures involved. To calculate the drying rate of the spent coffee grounds, the sample weight is measured at regular time intervals and the weight of the dry solid was experimentally determined by placing the used coffee grounds in a drying oven at 70°C for 24 hours. The moisture content at any time was computed by using the following equation:
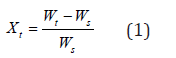
Xt = moisture content at time 
Wx = dry solid weight [g]
The dimensionless moisture ratio is calculated using the following equation:
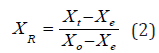
XR = dimensionless moisture ratio at time t
Xt = moisture content at time 
Xe = equilibrium moisture content 
X0 = moisture content at 
After calculating moisture content using equation (2), this was plotted as a function of time, as shown in (Figure 3). The drying rate was calculated by determining the slopes of the drying curves for small increments of time for the Constant Rate Drying Periods (CRDP).(Figure 4) shows these CRDP’s for both experimental runs. The following method and equations were used to find the experimental mass and heat transfer coefficients.

Figure 3: Time-dependent moisture content (Equation 4) of spent coffee grounds with fit exponential equations.

Figure 4: Constant rate drying periods.
The mass transfer coefficient was calculated using the following equation

Where:
DR = Experimental drying rate in 
km = mass transfer coefficient 
a = sample surface area to volume ratio [m-1]
Hsat air= humidity of downstream saturated air 
Hair = humidity of downstream air 
The heat transfer coefficient is calculated using the following equation:
Where:
λvap = heat of vaporization of water 
h = heat transfer coefficient [W]/m2 °C
A= sample surface area [m2]
Tdry bulb = dry bulb temperature of outlet air [°C]
Twet bulb = wet bulb temperature of inlet air [°C]
The mass transfer calculation via the use of correlations begins with plotting dimensionless moisture content ratio versus drying time. The plot is shown in (Figure 5) below. The data is fitted to an exponential function as follows [7]:

Figure 5: Relationship between dimensionless Moisture Ratio and Time.
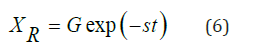
Where:
XR = dimensionless moisture content ratio
G = lag factor
S = drying coefficient [s-1]
t = drying time [min]
The lag factor is used in the following equation to determine the Biot number [7]:
Bi = 0.0576G26.7 (7)
Where:
Bi = Biot number
G = lag factor
The definition of the Biot number can be used to solve for the mass transfer coefficient:
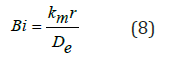
Where:
km = mass transfer coefficient 
r = characteristic dimension [m]
r = characteristic dimension [m]
De = effective moisture diffusivity 
To obtain the moisture diffusivity in the coffee grounds cakes, we can describe the process by means of Fick’s second law of diffusion applied to the one-dimensional mass transfer in an infinite slab geometry [4], and taking only the first term of the series solution to the differential equation as follows:
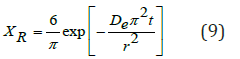
Taking the natural logarithm on both sides in equation (9):
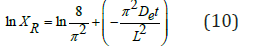
Where:
XR = dimensionless moisture content ratio
De = moisture diffusivity 
t = drying time [min]
L= thickness of the cake [m]
The equation above shows that the diffusivity, De, can be obtained from the slope of the graph in (Figure 6) below.

Figure 6: Graphical method used to determine diffusivity [4].
The Nusselt number can be used to calculate the Heat transfer coefficient [8]:
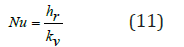
Where:
Nu = Nusselt number
h = heat transfer coefficient 
r = characteristic dimension [m]
Kv = thermal conductivity 
An empirical correlation is used to relate the Nusselt number with the Reynolds and Prandlt numbers as follows [8]:
Where:
Re = Reynolds number
Pr = Prandtl number
Equations 11 and 12 are used to calculate the heat transfer coefficient.
A table with the summary of experimental results obtained for each run in the first series of experiments is shown in (Table 2). It is worth noting that the “experimental” heat transfer coefficient for these results was calculated using the following correlation for the drying of solids in a tray drier [15]:

Table 2: Summary of Experimental Results.
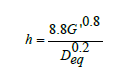
Where:
G’ = Mass velocity of air, kg/m2
Deq= Equivalent diameter of the drier channel, m
Evidently, there is a considerable difference in the effective diffusivity found in this study in comparison with the result published by Gomez-de la Cruz et al. [4]. The sample thickness was the same in both cases but clearly, the air temperature and flow rate were higher in the published study. Heat and mass transfer coefficients are comparable to those published for apple drying studies in the same laboratory tray drier [8]. It is evident that the experimental conditions were very limited, only one air temperature was tested, and the range of airflow rate had very little variation.
Therefore, a new series of experiments was planned, and performed, by a team of three researchers, in contrast with the original experiments that were run by a single researcher. In this case, four wet SCG cakes 5.08cm in diameter by 2.54cm thick and weighing 25 grams each were placed in the four trays inside the drier; the surface area available for drying was effectively increased in this series of experiments. Four experimental runs were carried out and the results are shown in (Figure 7) , the experimental conditions are given in the (Table 3).
(Figure 8) shows the plot of equation 10 for the data from run 3, the effective diffusivity, De, can be obtained from the slope of the straight line..

Figure 7: Drying curves from experiments with four-cake samples.

Table 3: Experimental conditions for four-cake samples.

Figure 8: Graphical determination of Effective Diffusivity.
(Table 3) is a summary of the mass and heat transfer parameters obtained from the experimental results, with a comparison against the calculated parameters using common correlations. In general, the drying rate increases with temperature and flow rate. The effective diffusivity follows the same trend, except for the case of the highest temperature and flow rate. Again, the diffusivity is lower, by one order of magnitude, than the one reported by Gomez et al. [4] who measured their diffusivities at 100 °C whereas the highest temperature in this study was 32 °C. The values of the heat transfer coefficient are about two times higher than the ones reported in (Table 1) corresponding to the first series of experiments with two-cake samples. The mass transfer coefficients are one order of magnitude higher than those reported in (Table 1). Considering the precision of the digital balance in the tray dryer, it is evident that increasing the surface area of the sample improves the experimental results in general (Table 4).

Table 4: Experimental conditions for four-cake samples.
There are no published results for heat and mass transfer coefficients in the case of drying of SCG. Some comparison can be made against values obtained in the drying of fruits [8, 13]. Such values are included in (Table 3) to show that our results compare very closely to them. The experimental values of mass and heat transfer coefficients show a significant difference with those calculated from correlations. This may be due to differences in the experimental drying equipment and in the samples dried. The reference used to calculate the correlation values of mass transfer coefficients was for a different kind of sample that was not SCG, it was developed for drying of several foodstuffs, such as onion slices [7]. The correlation used to calculate the values of heat transfer coefficients was developed for drying Indian Gooseberries [11].
Conclusions and Future Directions
Despite the setbacks, there are still a notable number of positive yields from the above experiments. First, this entire report describes, in detail, the calculations used and the order in which they were used, allowing future interests in this area to be more quickly carried out. Secondly, this analysis also includes a thorough approach in accounting for the periodic variance in dual-threshold systems that also assists in isolating possible sources of error or irregularity (in this case, the flow speed). Performing this analysis allows for a data set that is better suited to the properties of the environment averaged across time.
The effective diffusivity obtained using the same method as the most recent literature source produced a somewhat different result than the published value. However, this makes sense given the difference in environment between our experiments and those previously published [4]. Moreover, it is worth noting that the temperatures used in the study by De la Cruz et al. [4] were so high that there is the possibility for evaporation of other components besides water from the SCG samples, something that might contribute to the observed differences in diffusivities.
The convective heat and mass transfer coefficients are the first to be determined experimentally for the drying of SCG and the values obtained are in a reasonable agreement with those reported for the drying of fruits and foodstuff. These transfer coefficients are useful to design industrial size driers, such as continuous tunnel driers or tray driers, depending on the volume of SCG to dry. In building upon the above findings, there are several pertinent areas to consider. First, particle size is of large concern because the grounds swell depending on their water intake.
In other words, as a particle loses water, it decreases in size, not to mention it is less prone to clumping together with other particles. While particle size was briefly studied using sieve trays of various sizes, time was quickly allocated to other experiments when it became apparent that pinpointing particle size to a specific moisture content would prove difficult. In other words, a sample would lose up to half of its starting weight throughout the duration of a single particle size test because the water would quickly evaporate at ambient temperatures due to the largely increased surface area of drying.
Additional testing could be more mindful of the limitations of the equipment. By selecting lower analog settings for the air flowrate, it would then be possible to perform tests at airflows that consistently differ from other trials if the lower settings all work within the capacity of the apparatus. Improvements concerning particle size study and proper airflow bounding were not implemented in the above analysis due to time constraints, but they are certainly feasible in the future.
Nomenclature
a : sample surface area to volume ratio [m-1]
A : Sample surface area [m2]
Bi_ : Biot number for mass transfer [dimensionless]
C : Constant [dimensionless]
De : Effective moisture diffusivity [m2/s]
Deq : Deq=Equivalent diameter of the drier channel, m
Di : Dincer number [dimensionless]
DR : Drying Rate [g/g-s]
G’ : Mass velocity of air, kg/m2s
h : Convective heat transfer coefficient [W/m2·°C]
Hair : Humidity of downstream air [g/kg]
Hsat air : Humidity of downstream saturated air [g/kg]
km : Mass transfer coefficient [dimensionless]
k : Drying constant [1/s]
L : Thickness of the SCG cake [m]
G : Lag factor [dimensionless]
Kv : Thermal conductivity of humid air [W/m·°C]
m_ev : Moisture evaporated [kg]
MR : Moisture ratio [dimensionless]
n : Constant [dimensionless]
Nu : Nusselt number [dimensionless]
Pr : Prandlt number [dimensionless]
Q_e : Rate of heat utilized to evaporate moisture [J/ m2·s]
r : Characteristic dimension [m]
Re : Reynolds number [dimensionless]
t : Time [s]
T(dry bulb) : Dry bulb temperature [°C]
T(wet bulb) : Wet bulb temperature [°C]
U : Flow velocity of drying air [m/s]
W : Total product weight at time t [kg]
Wo : Initial total product weight [kg]
Ws : Dry solid weight [kg]
X : Free moisture content [kg water/kg dry solid]
XR : Relative moisture
Xe : Equilibrium moisture content [kg water/kg dry solid]
Xt : Moisture content at time t [kg water/kg dry solid]
Greek Letters
λ : Latent heat of vaporization [J/kg]
References
- World Energy Statistics (2015) International Energy Agency, OECD/IEA.
- Narashimharao K, Mohapatra SK, Misra M (2008) Spent coffee grounds as a versatile source of green energy. J Agric Food Chem 56(24): 11757-11760.
- Annual Review-International Coffee Organization (2018) London, UK.
- Gómez-de La Cruz FJ, Cruz-Peragón F, Casanova-Peláez PJ, Palomar-Carnicero JM (2015) A vital stage in the large-scale production of biofuels from spent coffee grounds: The drying kinetics. Fuel Proc Technol 130: 188-196.
- Caetano NS, Silva VFM, Melo AC, Mata TM (2013) Spent coffee grounds for biodiesel production and other Applications. Chem Eng Trans 35: 1063.
- I Dincer, Dost S (1995) An Analytical Model for Moisture Diffusion in Solid Objects During Drying. Journal of Drying Technology 13(1-2): 425-435.
- Dincer I, Dost S (1996) A modelling study for moisture diffusivities and moisture transfer coefficients in drying of solid objects. Int J Ener Res 20(6): 531-539.
- Dincer I, Hussain MM, Yilbas BS, Sahin AZ (2002) Development of a new drying correlation for practical applications. Int J Energy Res 26(3): 245-251.
- Dincer I, Hussain MM (2004) Development of a new Biot number and lag factor correlation for drying applications. Int J Heat & Mass Transf 47(4): 653-658.
- S Mullen, B Rogers, H Worman, EN Martinez (2018) The Drying of Apples in a Laboratory Tray Drier. Chem Eng Ed 52(1): 9.
- Velic D, Planinic M, Tomas S, Bilie M (2004) Influence of airflow velocity on kinetics of convection apple drying. J Food Eng 64(1): 97-102.
- Sacilik K, Elcin AK (2006) The thin layer drying characteristics of organic apple slices. J Food Eng 73(3): 281-289.
- Curve Fitting to a Sinusoidal Function (2014) MATLAB Answer, MathWorks.
- McCabe WL, Smith JC, Harriott P (2001) Unit Operations of Chemical Engineering (6th edn), McGraw-Hill, Boston, USA, p. 785.
- Anwar SI, Singh RD (2012) Convective Heat Transfer Coefficient of Indian Gooseberry (Emblica Officinalis) Dried in Three Different Forms Under Forced Convection Mode. J Eng Sci & Technol 7(5): 635-645.


 We use cookies to ensure you get the best experience on our website.