Research Article 
 Creative Commons, CC-BY
Assessment of Brain Metabolic Score (BMS) In Vivo Based on Mitochondrial Activity in Neuropathology
*Corresponding author: Avraham Mayevsky, The Mina & Everard Goodman Faculty of Life-Sciences and the Leslie & Susan Gonda Multidisciplinary Brain Research Center, Bar-Ilan University, Ramat-Gan, 5290002, Israel.
Received: January 06, 2020; Published: February 10, 2020
DOI: 10.34297/AJBSR.2020.07.001136
Abstract
The initial and significant event developed in ischemic stroke and other brain pathologies is the sudden decrease in blood flow and oxygen supply, leading to dysfunction of the mitochondria. We review a unique optical approach to evaluate brain mitochondrial function and microcirculatory blood flow, volume and oxygenation in real time in vivo. Four monitored physiological parameters are integrated into a new Brain Metabolic Score (BMS) calculated in real time and is correlated to Brain Oxygen Balance. The technology was used in experimental and clinical situations. Few models of brain monitoring during partial or complete ischemia were developed and used in naive animals or under brain activation protocols. It was found that mitochondrial function/dysfunction is the major and dominant parameter affecting the calculated Brain Metabolic Score. Using our monitoring system and suggested protocols will provide direct information regarding the ability of the tested brain to provide enough oxygen consumed by the mitochondria in the “resting” or in the “activated” brain in vivo and in real-time. Our studies indicated that testing the pathophysiology of the brain is a promising approach that may provide significant results to the R&D studies of ischemic stroke and other neuropathologies related to mitochondrial function.
Keywords: Brain Monitoring; Neurophotonics; Cortical Spreading Depression; Hyperoxia; Neurosurgical Patients
Abbreviations: BMS: Brain Metabolic Score; TBF: microcirculatory blood flow; TBV: blood volume; HbO2: hemoglobin saturation level; NADH: Nicotine amide adenine dinucleotide; DPNH: Diphosphopyridine nucleotide; PN: pyridine nucleotide.
Introduction
The discovery of oxygen occurred toward the end of the 18th Century (1771-1775) by three scientists including Carl Wilhelm Scheele, Joseph Priestley and Antoine de Lavoisier. It took more than 100 years to discover the intracellular organelle, named mitochondrion by Carl Benda in 1898 [1], that utilized 90-95% of the oxygen taken up and consumed by the body of patients as summarized by Waltemath in 1970 [2].
The aim of the current review is to describe the historical R&D process of using light in order to study brain biochemical and physiological activities. I will deal with the function and regulation of oxygen in supplying energy to this unique central organ of the body. The relationship between the activities of the brain and using optical technologies are presented in (Figure 1). Most of the information on mitochondrial function has been collected using in vitro studies. Small portion of publications dealt with monitoring in vivo of brain mitochondrial function in real-time. Prof. Britton Chance was the leader in the field of using the light, seen in (Figure 1) in studying mitochondrial function (Figure 1) especially the brain under in vivo conditions. The study of mitochondrial function in vivo was expanded later by our group that developed the multiparametric monitoring system used as seen in (Figure 1) [3, 4, 5]
Historical Overview
The functional capacity of any tissue, and especially the brain, is related to its ability to perform its work. The assessment of this ability could be done by checking tissue oxygen balance, i.e. the ratio of oxygen supply to demand. As seen in (Figure 2) a similar description was made by Barcroft 105 years ago [6].
He showed the relationship between tissue activity, oxygen consumption as well as increase in blood supply serving as a compensation mechanism. This observation that was published in 1914 was and is supported by many studies published since then. Presentation of the balance between tissue oxygen supply and demand in a typical organ is shown in (Figure 2). Oxygen supply is dependent upon the microcirculatory blood flow (TBF), blood volume (TBV) and the hemoglobin saturation level (HbO2) in the small blood vessels, namely, the microcirculation. The saturation of the hemoglobin in the microcirculation is affected by 2 factors, namely, oxygen consumption by the mitochondria and the microcirculatory blood flow. The demand for oxygen is affected by the specific activities taking place in each organ as seen in the right side of the figure. The mitochondrial NADH (the reduced form) level is a parameter directly related to the oxygen balance.
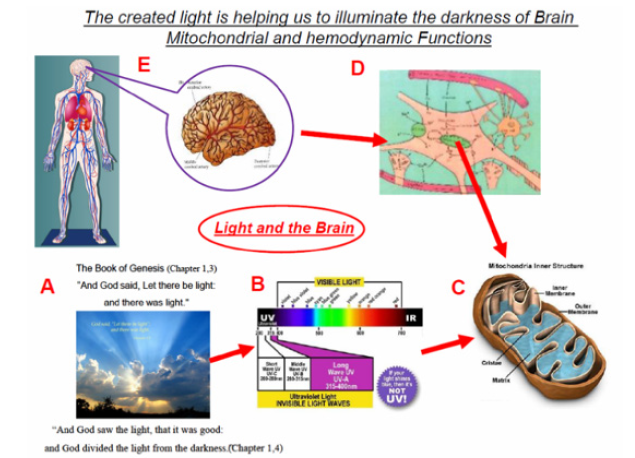
Figure 1: The story of brain bio-photonics. A - Citation regarding the creation of light. B - The use of the UV part of the spectrum as a tool for the monitoring of mitochondrial function (C). D - Schematics of the elements that represent part of the brain tissue seen in part E.
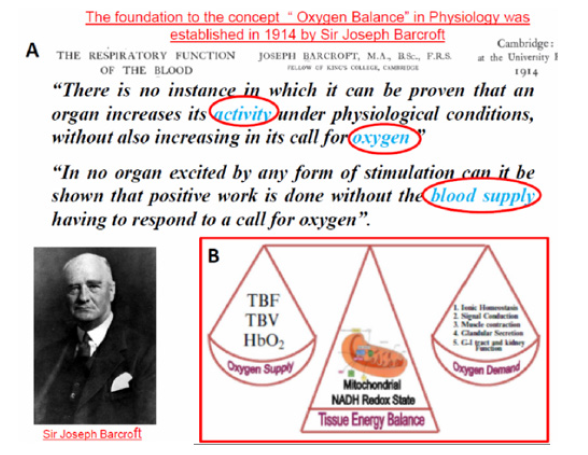
Figure 2: The “hypothesis” formulated by Barcroft in 1914 regarding the connection between organ activity, oxygen consumption and blood flow (6). B - Presentation of tissue oxygen balance related to the energy supply and demand. Oxygen supply could be evaluated by measurement of tissue blood flow (TBF), blood volume (TBV) and hemoglobin saturation (HbO2). Oxygen demand varies between different tissues and include Ionic Homeostasis, Signal Conduction, Glandular Secretion, Muscle Contraction, and G-I tract and kidney function. Mitochondrial NADH serve as an indicator for tissue oxygen balance (16).
(Figure 3) shows the gradient of oxygen levels between air inspired to the lungs, heart, large arteries and small arterioles to the brain intracellular compartment and finally the mitochondria. The various points of patients’ clinical monitoring are shown. As seen the largest gradient of oxygen occur between the oxygen level in the large arteries and the microcirculation. The delivery of oxygen is done in the microcirculation, therefore the level of oxygen in large arteries is very high (about 100 mmHg). The last usual parameter, in the oxygen gradient, that is monitored clinically is the pulse oximeter that measures the saturation of hemoglobin in the systemic arteries. At this point the HbO2 is highly saturated as indicated in point 1 at part A of the figure. The saturation of the HbO2 at the microcirculation is depending on the organ that is evaluated. In the brain, heart or kidney (very active organs), the saturation will be in the range of 50%-60% and in the resting muscle it will be around 80%. Monitoring of the microcirculation and especially mitochondrial function in vivo is not a standard approach in daily clinical activities.
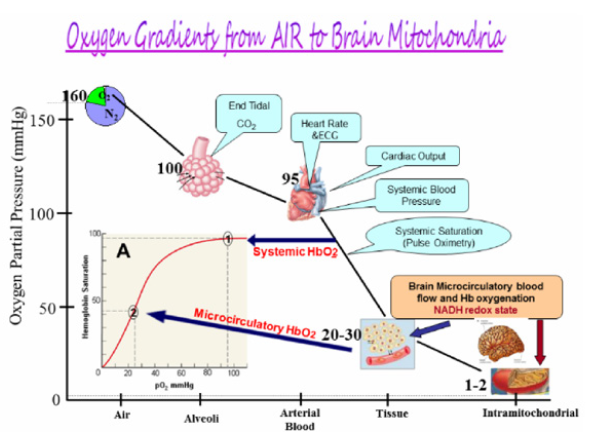
Figure 3: The gradient of O2 from air to the mitochondria in nervous system. Monitoring of patients include various parameters along the oxygen gradient (96). In the insert A, the dissociation curve of O2 and hemoglobin is presented.
The historical milestones in the development of mitochondrial NADH monitoring after its discovery in 1906 by Harden and Young are listed in (Table 1). Most of the milestones were achieved by Prof. Chance. The collaboration with the physiologist, Prof. Jobsis, led to many studies where various organs in vitro or in vivo were monitored. Most of the studies published in this field were expanded by the team working with Prof. Chance in Philadelphia and then moved to other universities around the world.
(Figure 4) shows the pictures of the 5 scientists who affected significantly the development of the theoretical and experimental technology for the monitoring of mitochondrial NADH function in vitro and in vivo.
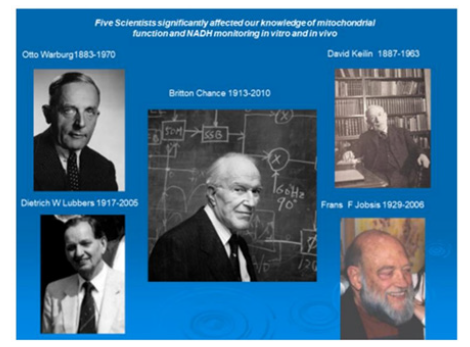
Figure 4: The scientists contributed significantly to our knowledge on mitochondrial function and NADH monitoring under in vitro and in vivo conditions.
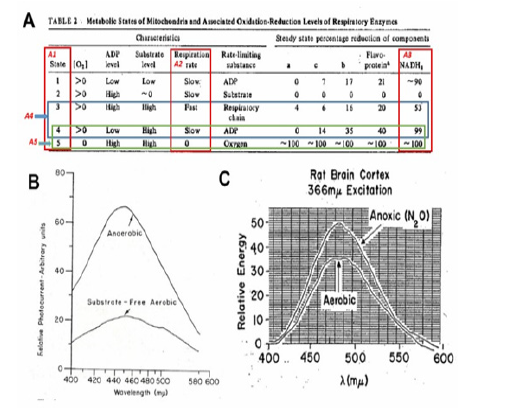
Figure 5: A - Mitochondrial metabolic state, defined in vitro, by Chance and Williams, and opened up a new era in measurements of respiratory chain enzyme’s redox state in vitro as well as in vivo (43). B - The fluorescence emission spectrum showing the difference between an anaerobic an d an aerobic suspension of liver mitochondria) .The excitation wavelenght was 353nm (97). C - The emission spectra of rat cerebral cortex under aerobic conditions (lower trace) and under anoxic conditions (upper trace) (98).
It is now more than 60 years since the pioneering work of Chance & Williams on mitochondrial metabolic state in vitro shown in (Figure 5), was published [7, 8, 9, 10]. Harden & Young described the pyridine nucleotides almost 110 years ago [11, 12] followed by the description of its full structure by Warburg and collaborators 30 years later [13]. All those studies initiated the first detailed experiments, by Chance et al. [14], in which NADH (Nicotine amide adenine dinucleotide) fluorescence, was used as a marker of mitochondrial function of the brain and kidney in vivo in the anesthetized animals.
Principles of Monitoring NADH Fluorescence
Monitoring of NADH by the difference in the absorption spectrum of its reduced form, led to a limitation of that technique to the study of mitochondria in vitro, and in very thin tissue samples (e.g. muscle) or in cell suspension. More specific and better method is fluorescence spectrophotometry in the near-ultraviolet range (UVA).
The discovery of the optical properties of reduced Nicotineamide Adenine Dinucleotide – NADH (earlier names: DPNH - diphosphopyridine nucleotide, or PN - pyridine nucleotide), led to an intensive research activity since the early 1950’s. The reduced form of this molecule, NADH, shown in Figure 6A1 & 6A2 [15], absorbs light at 320-380 nm (Figure 6) and emits fluorescent light at 420-480 nm range (Figure 6) [16]. The oxidized form NAD+ does not absorb light in the UV range, therefore it was possible to measure the redox state of the mitochondria by monitoring the UV absorbance or Blue fluorescence of NADH. (Figure 6) present NADH fluorescence spectra monitored from the brain of anesthetized rat exposed to anoxia as described in detail [17].
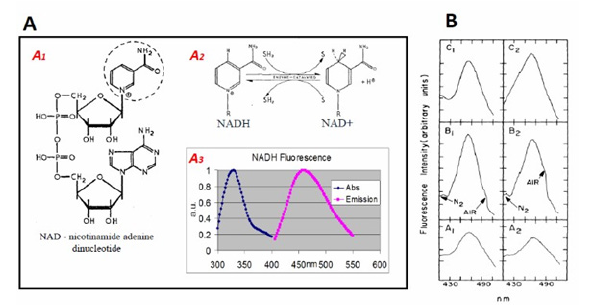
Figure 6: A. The structures of NAD+. The nicotinamide group (broken ring) is the “functional” part of both molecules (A1) i.e. the portion of the molecules where oxidation and reduction take place (15,99). A2. The transition between oxidized and reduced NADH. A3. Excitation and emission spectra of NADH (16). B. Emission spectra of the brain under excitation of 366 nm light (A1, B2, B1, B2, and C1) or laser 324 nm light (C2). C1 and C2 were measured from a dead brain (23).
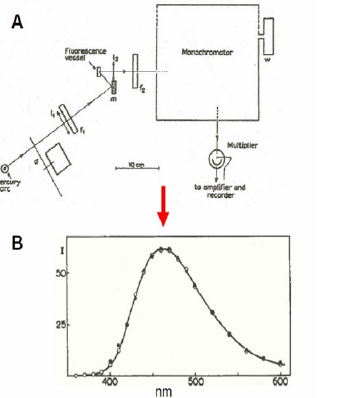
Figure 7: A. Apparatus for measurement of “fluorescence spectra”. The wavelength drum was driven by a synchronous motor. A sectioned disc d, mounted on another synchronous motor, modulated the incident light. The a.c. component of the current, caused by the light falling on the iP 21 multiplier, was amplified, rectified and fed into the recorder. B. Fluorescence spectra of NADH. The open circles are for excitation by wavelength 313 mμ, the black ones for excitation by 366 mμ. The spectrum for 313 mμ has been multiplied by a certain factor to make its maximum of equal height as the maximum of the spectrum excited by 366 mμ. The spectra appear to be identical; the maximum is at about 462 mμ (22).
The first model of fluorescence recorder was described by Theorell & Nygaard [18, 19] and Theorell, Nygaard and Bonnichsen [20]. Boyer & Theorell in 1956 showed that the fluorescence of DPNH was shifted and the intensity was increased upon combination of DPNH and liver alcohol dehydrogenase-ADH [21]. The 1st study using fluorescence spectrophotometry of NADH in intact Baker’s yeast cells and Algae cells, was published in 1957 [22] as seen in (Figure 7) .
The features of NADH fluorometers consist of the 4 components:
a. A light source (including appropriate filters).
b. An optical path to the monitored object and back to the detection unit.
c. Signal detection and processing units.
d. Signal recording and data storage units.
In our 1984 review, we specified the light-guide-based fluorometry used in our studies [23]. Ince et al. [24], included many other technical aspects of the methodology in their review. Duysens & Amez [22] schematized the first fluorescence spectrophotometer used for intact cells. They utilized the “classical” light source – the mercury arc – providing a very strong band at 366 nm, even though not at the maximal NADH absorption peak of NADH (340 nm). Using a monochromator, they were able to obtain the NADH fluorescence spectrum in baker’s yeast cells and photosynthesizing cells. They concluded that “the fluorescence excited by 366 nm can be used for measuring reduced pyridine nucleotide in vivo”.
Chance & Legallais [25] described a differential fluorometer that opened a new era in monitoring NADH fluorescence in vivo. They used a microscope, serving as the fluorometer basis, with two light sources: tungsten and mercury lamps with appropriate filters. Chance & Jobsis [26] and Chance [27] showed that mechanical muscle activity ends up with NADH oxidation measured in excised muscle. This study was the bridge from the subcellular (mitochondria) and cellular (intact cell) monitoring approaches toward actual in vivo applications.
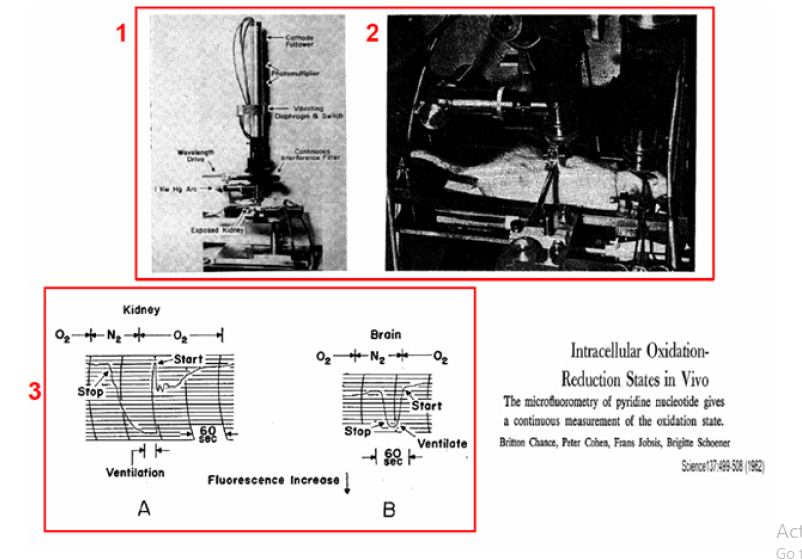
Figure 8: 1 - Microspectrofluorometer developed and used in the 1960’s. In addition to the interference filter, a Wratten type 2C filter is also placed in the back aperture of the objective. The wave-length-range of the interference filter is 400-700 mμ, and the specification on its spectra interval is 30-40 mμ. Other features of the high pressure mercury arc excite the fluorescence of the specimen at 366 mμ by means of an ‘Eppendorf’ primary filter. Fluorescence excitation and emission pass through the Leitz Ultrapak objective and a ocular (98). 2 – Experimental setup for microfluorometry of brain and kidney cortex in the rat measured simultaneous. Two microfluorometers were focused on the exposed surfaces of the 2 organs. The oxidation-reduction level of the intracellular pyridine nucleotide was altered by changes in ventilation and the corresponding fluorescence changes was recorded by the two microfluorometers. For the kidney fluorometer, the water-cooled lamp housing attached to the Leitz “Ultrapak” illumination system is shown. 3 –Recordings of the kinetics of increases in fluorescence observed in oxygennitrogen transition for kidney (A) and brain (B) cortex of anesthetized rats. The increases in fluorescence are recorded as a downward deflection. The times when gas in the tracheal cannula was changed from oxygen to nitrogen and the times when breathing stopped and started again are indicated.
The in vivo NADH monitoring system was introduced during in the late 1950’s and early 1960’s. The effects of scattered light and tissue absorption due to blood were not evaluated or measured when NADH fluorescence was measured. The first results of in vivo NADH fluorescence measurements appeared in 1962 [14]. These “classical” papers described two microfluorometers that were modifications of previous designs [25, 28]. This micro fluorometer (Figure 8) type employed Leitz “Ultrapack” illumination, which had been used for many years until the development of UV transmitting optical fibers. To avoid movement artifacts, rats were deeply anesthetized, and their heads were fixated in a special holder on the operation table. The same instrumentation was used in other in vivo studies, including those of Chance’s group and other investigators cited in a previous review [17].
The effect of blood on NADH fluorescence was discussed early by Chance et al. [14]. In order to monitor NADH in vivo, it was necessary to avoid large blood vessels in the monitored area which interfere with the emission and excitation light. The monitoring of a second parameter in tissue fluorometry in vivo was reported in 1963 [29]. It was shown that “changes due to the deoxygenation of oxyhemaglobin do not interfere with measurement of the time course of fluorescence changes in the tissue studies”. The addition of a second monitoring signal, namely, tissue reflectance at the excitation wavelength was reported in 1968 [30]. It was based on a previous model described by Jobsis et al. in 1966 [31]. In another two papers [32, 33] , the measurement of 366 nm reflectance was used for the correction of the NADH fluorescence signal from the brain. The reflectance signal was subtracted from the fluorescence signal. The same type of fluorometer was used in by Gyulai et al. [34].
In studies of the cerebral cortex the skull was removed carefully in order to minimize bleeding; about 25 square millimeters of the cortex was exposed. The dura was left intact. The head was held similarly to that used in stereotaxic studies of the brain and was kept sufficiently motionless for continued observation of a small area between major blood vessels. In a few studies, measurements were made simultaneously on the cortex of the brain and on the kidney by means of two independent microfluorometers. In such cases the kidney was held in a clamp on the back of the animal. The apparatus is seen in Figure 8-1 & 8-2.
Areas of the brain and kidney were selected which showed a bright and uniform distribution of fluorescent material. Areas containing large blood vessels were avoided. On the brain cortex a field was selected in which the number of visible capillaries was minimal. Since continuous viewing is possible during photoelectric measurement of the fluorescence, these positions were monitored to make sure that mechanical artifacts were avoided. Figure 8A (lower left side) show the response of the kidney. The increase in fluorescence observed at the time respiration ceases is 11 percent of the total increase during anoxia. As soon as a plateau is reached, the lungs are ventilated with oxygen three times. Three seconds after ventilation is ended an abrupt decrease in fluorescence is observed and breathing starts as the decrease reaches its peak. Irregularities in the extent of oxidation in the fluorescence signal are observed for the next 0.5 minute, but the fluorescence remains above the initial value for 2½ minutes.
A Figure 8B illustrates the response of the brain cortex. No fluorescence changes are observed for 30 seconds after the inspired gas is changed from oxygen to nitrogen. A small but consistently observed diminution of fluorescence occurs, and 10 seconds thereafter hyperventilation was observed. After a plateau is established, ventilation with oxygen is commenced, and 3 seconds thereafter an abrupt decrease in fluorescence reaches its plateau, breathing commences.
These results indicate that similar fluorescence changes under anoxia in vivo, were observed in excised slices, and in isolated mitochondria.
Fiber Optic based Fluorometer/Reflectometer
A flexible means was needed to connect the tested brain to the fluorometer in order to monitor of Brain NADH fluorescence in intact anesthetized or unanesthetized animals. This happened in 1972, when UV transmitting quartz fibers became available (Schott Jena Glass, Germany). The light-guide-based fluorometer for in vivo monitoring of the brain [35, 36] subjected to anoxia or cortical spreading depression was developed and used.
Laboratory device
The development of light-guide-based fluorometry-reflectometry is shown in (Figure 9). The original fluorometer reflectometer was based on the time-sharing principle (Figure 9). Four filters were placed in front of a 2 arms light guide. Filters 1 and 3 enabled the measurement of NADH fluorescence, while filters 2 and 4 were used to measure tissue 366nmreflectance. The reflectance trace was used to correct the NADH signal for possible hemodynamic artifacts, and to indicate relative changes in the blood volume of the monitored tissue.
In this system, one photomultiplier tube was used to detect the two signals namely fluorescence and reflectance. Figure 9B presents the first in vivo brain monitoring time sharing setups, connected to the brain [36]. In order to simplify the system, the time-sharing approach (AC mode) was replaced by splitting the light emitted from the tissue into two unequal fractions for the measurement of fluorescence and reflectance signals. This was achieved by using 2 photomultipliers. This device, named the DC fluorometer, contained two arms light guide probe. In the two configurations, the reflectance signal was used for the correction of the fluorescence signal (see details [17]). This model was used in studying the brain [46, 47, [48, 49, 50], the kidney [41] and the heart [42].
The responses of the rat brain to anoxia using two size diameters of the fiber optic bundle are shown in (Figure 9) . When the brain was exposed to concentrated KCl solution, repeated cycles of NADH oxidation (decreased signal) as seen in (Figure 9). The MitoViewer Another type of fluorometer/reflectometer device (MitoViewer) was developed in 2007 by - Prizmatix Ltd as seen in (Figure 10) & B.
Another type of fluorometer/reflectometer device (MitoViewer) was developed in 2007 by - Prizmatix Ltd as seen in (Figure 10) & B.
The MitoViewer
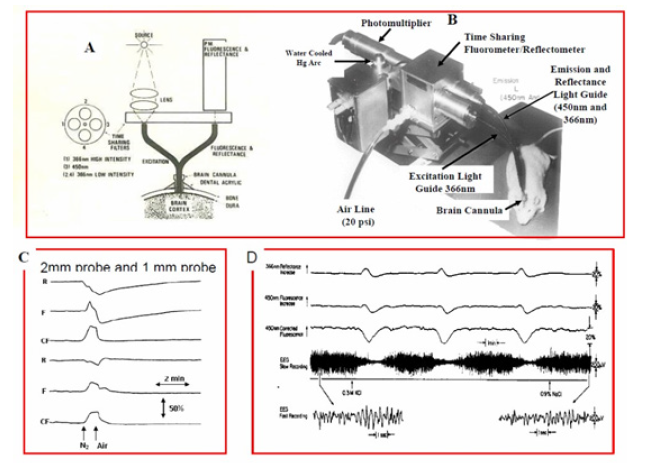
Figure 9: The time sharing fluorometer reflectometer and B - The brain of a small animal connected to this time sharing device. Ex - Excitation, Em - Emission optical fibers for the monitoring of NADH redox state. H.V. - high voltage, PM-photomultiplier. C - The effect of the monitored tissue volume (the diameter of the fiber optic probe) was tested under anoxia as shown in C upper 3 traces (2 mm diameter) and C lower 3 traces (1 mm diameter). (A+C - (23), B - (47), D - The responses of NADH fluorescence and reflectance to cortical spreading depression initiated by exposing the cortex to 0.3M KCl (39).
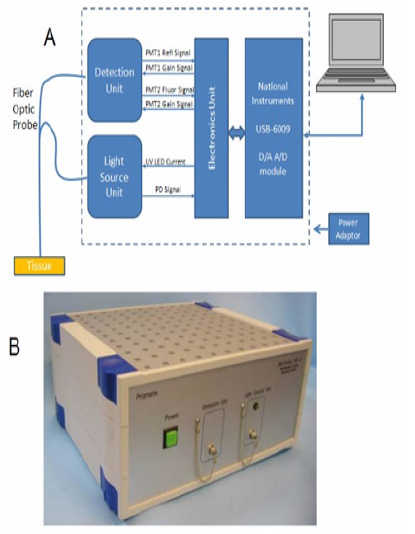
Figure 10: A. The MitoViewer fluorometer uses 365 nm UV LED for excitation of the NADH fluorescence (Fluor signal). This excitation wavelength is also used for the correction of hemodynamic artifacts by measuring the reflection light intensity (the Refl signal). The light is transmitted from and to the device by means of a flexible fiber optic bundle. The software displays the Reflectance, Fluorescence and the NADH corrected fluorescence signal B. The view of the MitoViewer.
System overview
The MitoViewer device comprises the following subunits:
Light Source Unit: Provides UV light at 365nm for NADH excitation and tissue reflectance measurements. Also included is a reference photodiode that enables correction of signals in cases of intensity changes of the LED during measurement.
Fiber Optic bundle: Transmits the UV light from the Light Source to the measured tissue and transmits the collected light (the reflection (Refl) and the fluorescence (Fluor) from the tissue, to the Detection Unit.
Detection Unit: Provides detection to transform the Refl and Fluor light into electrical signals which are transmitted to the electronics circuit for amplification.
Detection Unit: Provides detection to transform the Refl and Fluor light into electrical signals which are transmitted to the electronics circuit for amplification.
USB-6009 module: Provides A/D conversion for the Refl and Fluor signals and D/A conversion for control signals sent from a PC to control the function of the MitoViewer.
PC: Personal Computer controlling of the MitoViewer operation using the MitoViewer software.
Power Adaptor: Provides the DC voltage for operation of the MitoViewer.
The fiber optic probe of the MitoViewer is connected to the surface of the brain via an appropriate holder cemented to the skull with acrylic cement. Rats (200-250 grams) anesthetized and operated as discussed in our various papers cited in the attached list.
Typical responses of the brain to oxygen depletion by exposing the rat to 100% nitrogen are presented in (Figure 11) . The Fluor signal (blue) is elevated due to inhibition of the respiratory chain activity. The Refl signal (green) is decreasing, as expected under this anoxic condition, due to the elevation in blood volume in the monitored tissue. The corrected NADH (black) shows a symmetrical increase and decrease signals during the anoxic cycle. The effects of the increase in energy utilization, were induced by exposure of the brain to Cortical Spreading Depression (by high level of potassium.) as seen in (Figure 11) . Since the oxygen supply is not limited, the Fluor (blue) and the NADH (red) decreased due to the oxidation of NADH. Under this stimulation the ATP turnover was dramatically increased, and the extra oxygen supply was provided by an increase in microcirculatory blood flow (not measured in this animal). The effects of hypoxia (6% oxygen) and hyperoxia (100% oxygen) are presented in(Figure 11).
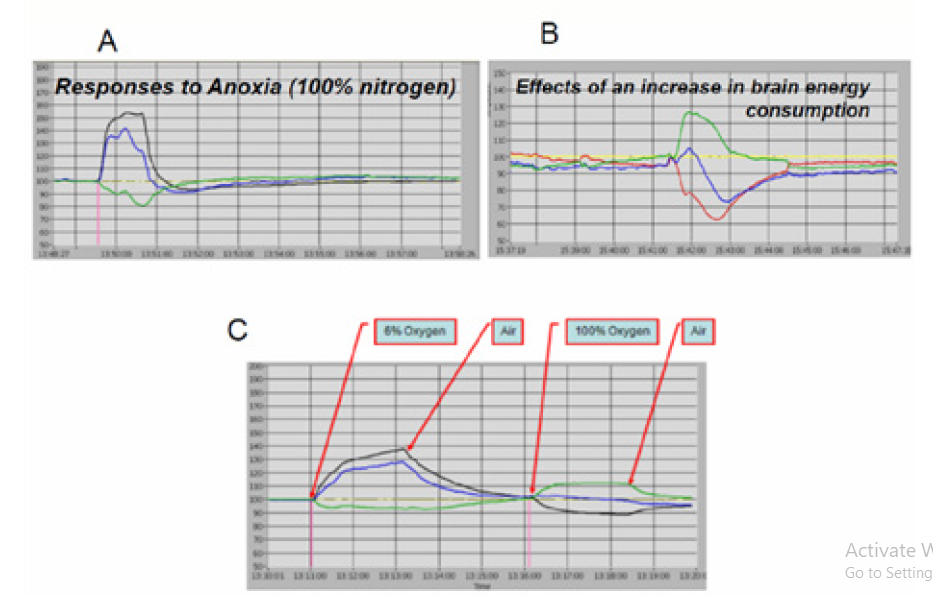
Figure 11: Typical responses to metabolic perturbations measured in the rat brain using the MitoViewer. A - Responses to Anoxia; B - Effects of cortical spreading depression; C –The effect of hypoxia (6% oxygen) and hyperoxia (100% oxygen) on the measured signals.
Animal Preparation for NADH monitoring
An operation table and probe holding device was used to perform brain as well as other body organs preparation for the measurement period. The table for the operation procedure is shown in (Figure 12). The head is connected to a special head holder for the period of the brain operation (20-30 minutes) and then could be released, for the monitoring period, as shown in (Figure 12) . If needed, the other monitored organs i.e. muscle, kidney or liver, must be held by a micromanipulator during the measurement period. The cerebral cortex was the main organ monitored by other investigators as well as in our group.
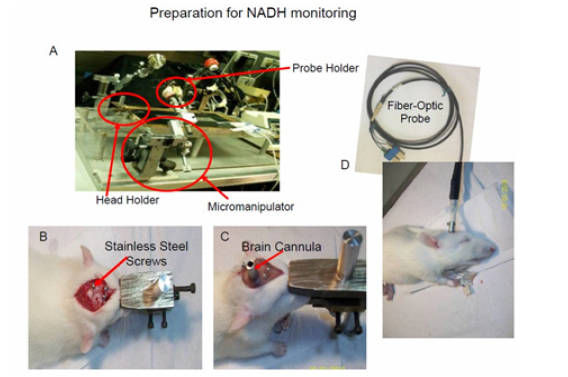
Figure 12: A –The surgical system used to prepare and measured up to 4 organs simultaneously including the brain. The same system enables to perform a craniotomy while the animal is connected to a special head holder. B+C Stages in the preparation of the rat brain for NADH monitoring. B – The location of screws needed for the fixation of the light guide holder to the skull by dental cement. C - The view of the head at the end of the operation. D - The fiber optic probe is inserted to its holder and the animal is ready for monitoring (16).
The entire protocol of the preparation of the rat is given here. Adult male Wistar rats (180–250g) were anesthetized by intraperitoneal (IP) injection of Equithesin solution (each ml contains: Pentobarbital 9.72 mg, Chloral Hydrate 42.51 mg, Propylene Glycol 44.34%, Magnesium Sulfate 21.25 mg, Alcohol 11.5% water) 0.3 ml/100g body weight. A midline incision is made in the skin in order to expose the skull. Three holes were drilled in the skull and appropriate screws were inserted to the skull as shown in (Figure 12) . The craniotomy (3-5 mm in diameter) was drilled in the right or left parietal bone for the fixation of a light guide holder. The light guide holder and the 3 screws were then fixated to the skull using acrylic cement (Figure 12) . Ten minutes later the head was released from the holder and the fiber optic probe was inserted to the appropriate depth and fixed by a set screw (Figure 12) .
From Single Parameter to Multiparameter Monitoring Approach
(Figure 13) illustrates the various experimental and clinical perturbations used in our laboratory during the last 45 years. (Table 2) lists the studies published by Mayevsky and his collaborators on brain NADH fluorescence. The papers are classified according to the type of perturbation used. In all those papers published in the period of 1973 and 1978 we monitored the mitochondrial NADH as a single parameter monitoring system. For the physiological interpretation of the changes in NADH measured in vivo, it was necessary to move from a single parameter monitoring system to the multiparametric monitoring approach) MPA).
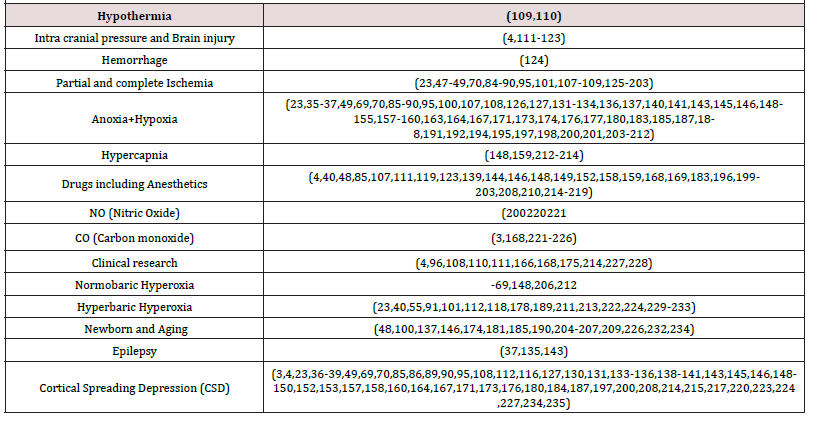
Table 2: Classification of the papers on brain NADH monitoring published by Mayevsky et al (1973-2017).
As described in (Figure 25) the redox state of NADH represent also the balance between oxygen demand and supply. Therefore, the multiparametric monitoring system results could provide better understanding of the pathophysiological processes developed. The term “Brain physiological mapping” based on the various parameters that could be monitored in vivo using a minimally invasive techniques presented in (Figure 14)(Figure 15) [5].
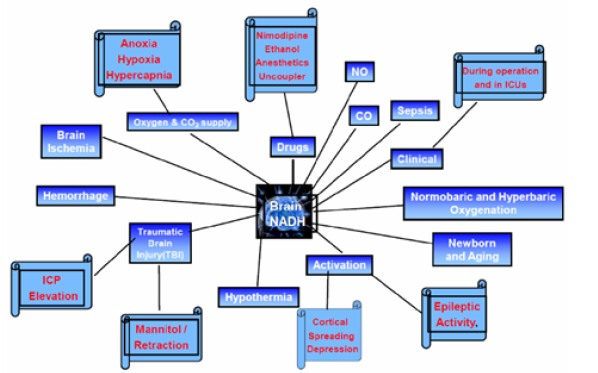
Figure 13: Presentation of the various perturbations used in monitoring brain NADH fluorescence in experimental animals and patients.
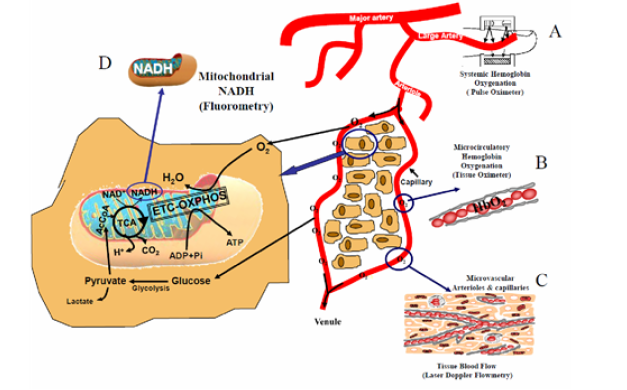
Figure 14: The technology developed for real time evaluation of energy metabolism at the tissue level. Part A shows the coupling between the macro-circulation measured by Pulse oximetry and the microcirculation. B-D The main monitoring technique of cellular and intracellular compartments (16).
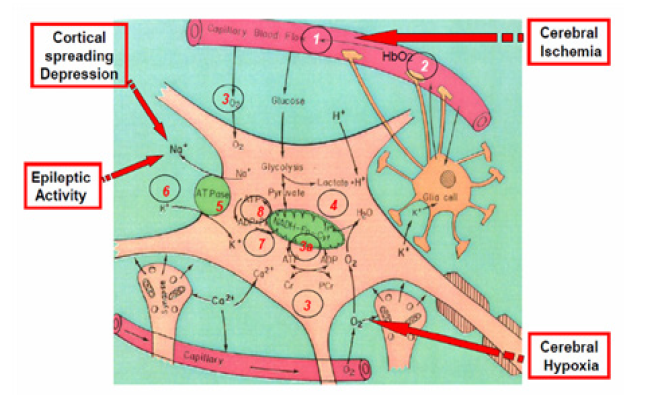
Figure 15: Schematic presentation of the “basic building stones” of a typical cerebral cortex tissue. During an ischemic or other 3 events shown, the sequence of the 8 early responses developed are presented in numbered circles.
The aims are to monitor, a small volume of the cerebral cortex containing all the tissue elements that are part of a typical functioning brain tissue. The interest is in the microenvironment of the brain tissue containing neurons, glial cells, synapses and the microcirculatory elements (small arterioles and capillaries). During the process we pursued the goal of being minimally invasive to the cortical tissue itself. It was obvious that the various probes could not monitor the same volume of tissue due to the size of each probe used. Therefore, we minimized the diameter of the various probes placed in the multiparametric assembly (MPA) that had a 5-6 mm contact area with the cerebral cortex. In many perturbations used, (global ischemia, anoxia, hypoxia or hemorrhage), most of the areas in the cortex will respond in the same way. The development of the MPA after the establishment of the fiber-optic-based NADH monitoring system in 1972 when the first UV transmitting fibers appeared [36]. The connection of the brain to the fluorometer via optical fibers enabled us to monitor, for the first time, the monitoring unanesthetized brain. The initial data using this technology appeared in 2 papers [35,36]. All details of the technological aspects and animal preparation appear in the original relevant publications; our approach was to develop a new upgraded version of the monitoring system and present initial preliminary results. In the next step a large well-designed study on few groups of animals were done and the data was analyzed for its statistical significance.
Responses of Brain NADH Fluorescence to various Experimental Conditions
In the current section, the effects of various experimental treatments in animal models on brain NADH will be describe in detail. It is important to note that most of the published data on NADH monitoring, have been accumulated from the cerebral cortex.
Changes of Oxygen supply in vivo
Introduction: Chance and Williams [9, 43], found that the complete depletion of O2 from the mitochondria inhibits oxidative phosphorylation terminates ATP production. This situation affects the normal function of the tissue, and cell death can ensue. We defined anoxia as a complete deprivation of O2 caused by breathing 100% N2. Under Hypoxia the deprivation of O2 from the breathing mixture is partial and ranges between 21% (normal air) and 0% (anoxia). Under Ischemia the decrease in O2 supply is due to a decrease in blood flow to the monitored organ. The level of ischemia can vary from a full absence of flow (complete ischemia) to different levels of blood flow (partial ischemia). Although oxygen deficiency is the main event in each of the three experimental conditions (anoxia, hypoxia and ischemia), other physiological factors may differ as well. For example, brain microcirculatory blood flow is decreased under ischemia, but increases under brain hypoxia. Thus, changes in the tissue due to other blood flow related factors are not identical.
Hypoxia and Anoxia: The responses to hypoxia and anoxia are very similar; therefore, they will be discussed together. According to Chance & Williams [8, 9], a shift toward State 5 in the metabolic state of the mitochondria, involves an increase in NADH proportional to a decrease in O2 supply. Figure 16A shows the response of the brain NADH to anoxia in vivo [44, 45]. At those days the fluorescence was measured and displayed without correction for hemodynamic artifacts which was developed later in time. A clear increase in NADH fluorescence was recorded under the deprivation of oxygen. Similar responses of the kidney to anoxia are presented in the lower part of A.
In 1972, we used UV transmitting optical fibers and applied the quartz fibers to the in vivo monitoring of NADH fluorescence in the brain. It was assumed that the response of NADH fluorescence to hypoxia or anoxia, induced in vivo, should be very similar to the response of isolated mitochondria that were investigated until those days.
(Figure 16) presents an interesting two responses of the brain to anoxia. NADH and the electrical activity of the brain were measured [37]. In these experiments the rats were slightly anesthetized by Equithesin. The nitrogen was applied via a nasal mask. In part B1, the duration of the anoxia was 70 sec and in part B2, 100 sec. (Figure 16)1 shows the effect of N2 on the NADH fluorescence, reflectance, EEG and blood pressure. The top trace shows the reflectance which in all animals decreases during the N2 cycle. This decrease of reflectance was in two phases. The first decrease was small (in comparison to the second one) and occurred while the animal was breathing spontaneously. A second decrease occurred after the animal stopped breathing (SB). The recovery of the reflectance to the baseline occurred about 10 min after the rat started breathing again. The second trace from the top, the fluorescence, shows a large increase in NADH fluorescence during the first phase of the N2 cycle. In order to correct for hemodynamic artifacts induced by various treatments, we used the correction technique suggested by Jobsis et al. [32, 33] and Harbig et al. [46]. The reflectance signal at 366 nm was subtracted from the fluorescence signal at 450 nm at a 1:1 ratio. The difference between the fluorescence and reflectance signals is shown in the third trace, the ‘corrected’ fluorescence. After the cessation of respiration, a large decrease in reflectance occurs; an apparent decrease in fluorescence (oxidation) is observed which is almost undetectable in the corrected trace. The small decrease shown in the corrected trace is due to imperfection of the correction factor in this special animal. After the N2 administration had been discontinued (SN), artificial respiration (AR) was applied to induce spontaneous breathing. After the animal started breathing, a fast decrease of NADH is observed in the uncorrected fluorescence as well as in the corrected fluorescence signal. The recovery of the NADH level to the baseline was very fast in comparison to the recovery of the reflectance. The EEG of both hemispheres reaches low amplitude when the NADH level reaches 80-90% of the maximum increase during the N2 cycle. The response of the two hemispheres was identical. The recovery of the EEG follows the NADH recovery to the normoxic level. (Figure 16) shows the response of the same animal to a longer N2 cycle. The animal was exposed to N2 for 100 sec. The main differences between the two cycles are that after the recovery of the NADH to the normoxic level a further decrease in NADH occurred (third trace) and at this time the EEG was depressed and recovered to normal only later. This oxidation of NADH following the N2 cycle was observed in many animals after exposure to a long N2 cycle. The pattern of changes in reflectance, fluorescence and the corrected traces were similar to those observed in the cortical spreading depression (SD) elicited by KCl as shown also in (Figure 9)(Figure 11).
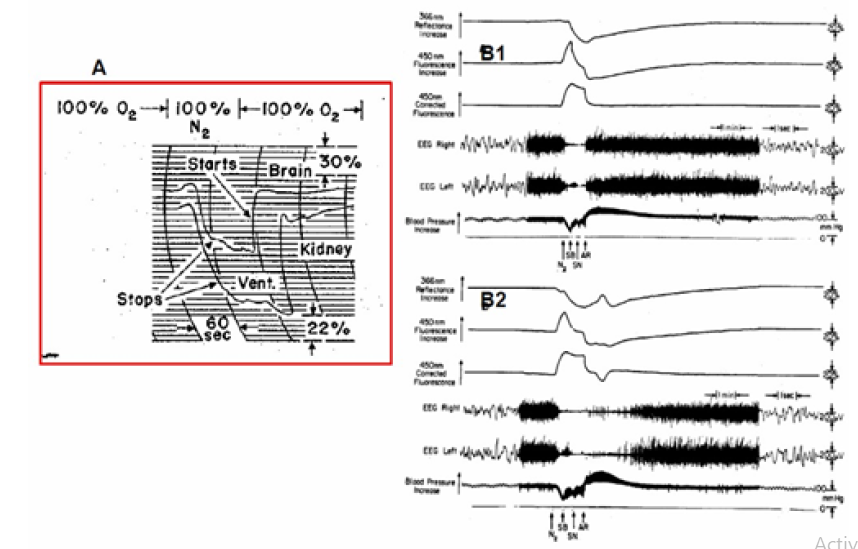
Figure 16: A - Simultaneous recordings of fluorescence changes in rat brain and kidney in the same cycle of anoxia. Fluorescence increases are indicated in a downward direction (45). B1+B2 - The effects of anoxia on brain NADH fluorescence, 366 nm reflectance, EEG, and blood pressure. SB, the animal stopped breathing; SN, stop nitrogen; AR, short artificial respiration (37).
(Figure 17) shows the responses of a dog/puppy brain to graded hypoxia (A-C) and to brain anoxia (D) [17]. As seen, the changes in the corrected fluorescence signals (CF), which represent the NADH redox state, were inversely correlated to the decrease in FiO2 levels (from 6% to 0% O2). In four records, the intensity of the decrease in the reflectance trace was also correlated with the level of hypoxia.
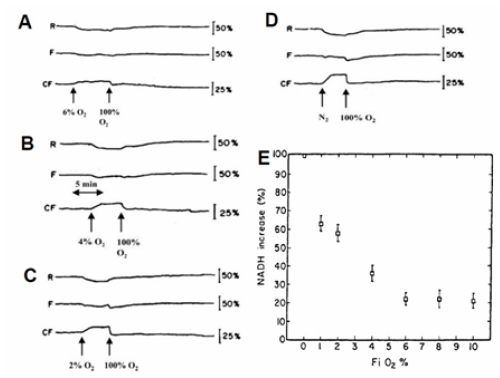
Figure 17: A - Simultaneous recordings of fluorescence changes in rat brain and kidney in the same cycle of anoxia. Fluorescence increases are indicated in a downward direction (45). B1+B2 - The effects of anoxia on brain NADH fluorescence, 366 nm reflectance, EEG, and blood pressure. SB, the animal stopped breathing; SN, stop nitrogen; AR, short artificial respiration (37).
The correlation between the NADH fluorescence and the FiO2 levels are presented in (Figure 17) . It was found that the FiO2 had a significant effect on the NADH redox state (F = 113.6, df = 6, p < 0.0001). However, age did not significantly affect the NADH response (F = 0.25, df = 4, p < 0.91). The NADH response of the puppies to various oxygen concentrations could be divided into four levels of hypoxia which are statistically different from each other:
In order to understand better the response of the mitochondrial NADH to anoxia/hypoxia it was necessary to monitor more physiological parameters from the same brain simultaneously. The results obtained when the multiparametric monitoring system was used are presented in (Figure 18) . The effects of complete deprivation of oxygen (anoxia) on the brain were detected when the animal was exposed to hypoxia as shown in Figure 18B [23]. The rat was exposed to 10%, 5% or to 100% N2. The decrease in oxygen supply resulted in a gradual decrease in brain pO2, as well as in an increase in NADH. The ECoG showed a clear response only to 100% N2. This response corresponded to a slight increase in extracellular K+.
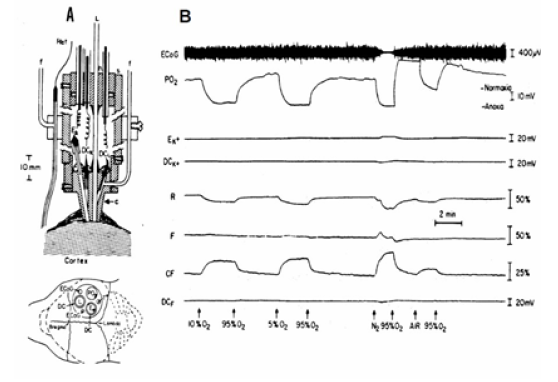
Figure 18: A – The Multiprobe Assembly (MPA) used in hyperbaric chamber. The relative location of various probes above brain are in the lower part of A. Ref, reference; Ag-AgCl electrode; f, refill tube for Ref or DC electrode; c, Lucite cannula; s, Plexiglas sleeve; L, light guide; h, cable holder; Ek, K+ electrode; DCk, DCL, Ag-AgCl electrode; PO2, O2 electrode; ECoG, electrocorticography electrode (91). B - The effects of hypoxia (10% O2, 5% O2) and anoxia (100% N2) on the metabolic, ionic and electrical activities of the rat brain. In this animal the oxygenation of the brain responses to breathing air as compared to 95% O2 are shown (23).
Partial and complete Ischemia: Under partial or complete ischemia, blood flow to the monitored organ is decreased and, as a result, O2 delivery is limited or even abolished. The use of ischemia in animal models provides information relevant to clinical situations such as brain stroke. The primary factor starting the pathological state is the decrease in O2 supply, making the tissue energy balance negative.,
In the early 1960’s, Chance [45] tested the effect of irreversible ischemia on brain NADH using the decapitation model. As shown in (Figure 19), about 8 secs were required between the start of NAD reduction and the attainment of half-maximal reduction. In an attempt to observe the time for NAD reduction in ischemia, we have employed a decapitation technique with the mouse; the optical system is arranged so that the slight mechanical artifact occurring on decapitation would not disturb the fluorescence excitation.
Using the fiber optic based fluorometer, we measured, in 1976, the effect of decapitation on NADH and ECoG in the awake rat and typical response is shown in (Figure 19) [47].
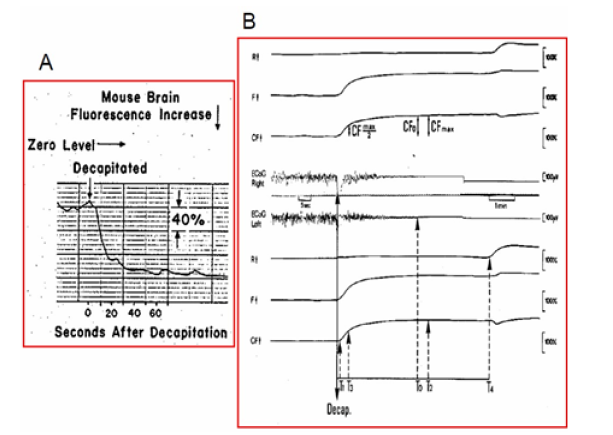
Figure 19: A. Fluorescence changes of the mouse brain cortex in ischemia caused by decapitation. (45). B – Metabolic, reflected-light and electrical responses to decapitation (measured bilaterally). The upper four traces were measured from the right hemisphere and the lower four from the left hemisphere. R = reflectance; F = fluorescence; CF = corrected fluorescence (F –R); ECoG = electrocorticogram.
Later, we tested the effects of age on NADH redox state in the awake and anesthetized rat exposed to decapitation [48]. The NADH was monitored from the two hemispheres of the rat brain. Here we are presenting the four upper traces that were measured from the right hemisphere. The differences in the responses between the two hemispheres were insignificant in most cases. The 366 nm reflected light (R) shows a very small initial response to the decapitation (Figure 19) . However, a very large secondary reflectance increase was recorded
1-2 min after ECoG = 0 when NADH reached its maximal level. The uncorrected (F) and corrected (CF) 450 nm fluorescence signals were like those described previously. In order to analyze the effects of age on the responses to decapitation, various parameters were measured and calculated from the analog signals, as shown in Figure 19B.
The definitions for the various parameters are as follows:
T0 = Time (sec) when electrical activity was very low and close to 0.
T1 = Interval between decapitation and the point when corrected fluorescence started increasing.
T2 = Time when the maximum level of NADH was reached after decapitation.
T3 = Time when NADH reached a level which is half of its maximum increase (CFmax/2).
T4 = Time when a large increase of the reflectance was measured (SRI = secondary reflectance increase).
CFmax = Maximum percentage increase of NADH above baseline after decapitation.
CFo = Percentage increase of NADH above baseline when ECoG = 0.
= Percentage of NADH increase when ECoG = 0 in proportion to the maximum increase measured in the same rat.
CFN2 = Percentage increase of NADH above baseline in nitrogen environment (anoxia).
The same type of data analysis could be used in other models of ischemia such as blood vessel reversible occlusion. It was clear that under severe ischemia a hemodynamic response was measured after reaching the maximal level of NADH. We named it “Secondary Reflectance Increase” (SRI), which appears at time T4 shown in Figure 19B.
In the late 1980’s a new technique enables the monitoring of microcirculatory blood flow (laser Doppler flowmetry) was incorporated into our MPA monitoring system as seen in Figure 20A [49].
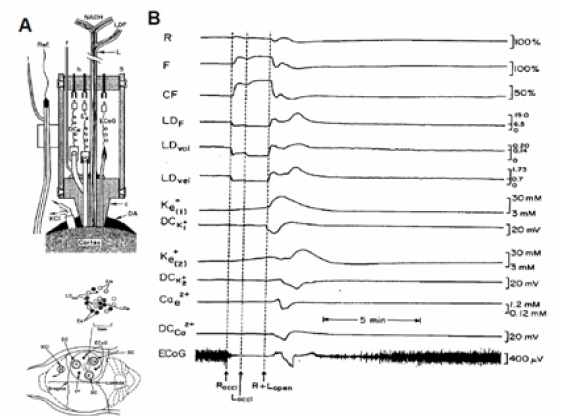
Figure 20: A - The experimental setup used. LG - Light guide for the monitoring the NADH redox state and CBF (LDF), ECoG - Electro Corticography electrodes, K, Ca, - Minielectrodes for Potassium and Calcium monitoring, To - Thermistor probe, DC - DC steady potential electrodes, DA - Dental acrylic cement, Ref - Reference electrode, KCI - cannula for KCI application. ), Ex, Em - Excitation and Emission fibers of the fluorometer, LDin, LDout - Fibers connected to the Laser Doppler flowmeter, C - Plexiglass probe holder, h - connectors holder, s - Plexiglass sleeve, f - feeling tube of reference electrode. B - The effects of unilateral (Roccl) and bilateral (Loccl) carotid occlusion on the metabolic, hemodynamic, ionic and electrical activities in the gerbil brain. R 366 nm reflectance F -450 nm fluorescence CF -NADH corrected fluorescence, LDF LDvol LDvel - Laser Doppler flow, volume and velocity. K+e(1), K+e(2), Ca2+e - Extracellular potassium and calcium electrodes. DCK+l DCK+2, DCCa2+ - DC steady potential measured concentric to the three electrodes, ECoG – Electrocorticogram (49).
(Figure 20) shows typical responses to unilateral (ROCCl) and bilateral (LOCCl) in CBF (LDF) and an increase in NADH levels (CF). During the period of ischemia, accumulation of K+ in the extracellular space was recorded (K1+, K2+) but the DC steady potential and the Ca2+ levels remained unchanged during the occlusion period. The ECoG reached the isoelectric level very soon after the second occlusion. During the reopening of the carotid arteries a fast reperfusion was recorded together with the oxidation of NADH. A spontaneous wave of SD was developed during the recovery phase, characterized by a large increase in K+e and a decrease in Ca2+e together with a negative shift in the DC steady potential. During the recovery from the SD wave a large increase in CBF (300%) was recorded accompanied by an oxidation wave of the NADH.
Hyperoxia (increase in FiO2): In order to expose an organ in vivo to elevated oxygenation
hyperoxia, it is possible to use one of the two options:
a. Normobaric hyperoxia the animal breathes elevated FiO2, between 21% O2 to 100% O2 at atmospheric pressure.
b. Hyperbaric hyperoxia (HBO) A hyperbaric chamber, in which oxygen pressure is elevated while the animal is located in the chamber, was used.
Providing animals or man with elevated oxygen will lead to the development of “oxygen toxicity.” The development of this toxic event is inversely proportional to the level of oxygenation, namely the higher the pO2, the shorter the time. Providing more O2 may be beneficial in conditions such as carbon monoxide toxicity, body oxygenation pathology. Therefore, it became necessary to understand the relationship between the level of oxygenation and the function of the mitochondria in vivo. Chance and collaborators [50, 51, [52, 53, 54] developed the setup that enabled the exposure of various types of mitochondria or the entire small animal to the hyperbaric chamber. They found that the NADH of the brain, liver and kidney became more oxidized under hyperbaric oxygenation, and this effect was correlated with a decrease in NADH measured by biochemical analysis of fixed tissue. Figure 21A shows the system that enabled the monitoring of NADH under in vitro or in vivo exposure to hyperbaric oxygenation. This technique was used also when various organs of the rat were exposed in vivo to HBO as seen in (Figure 21) [52].
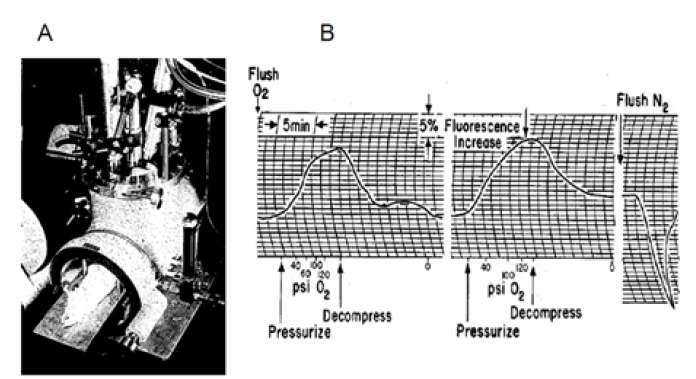
Figure 21: A - Apparatus for the fluorometric measurement of changes in NADH redox state in the organs of an anesthetized rat. The fluorometer components are mounted on the top of the window of the hyperbaric chamber. The compensating photomultiplier is show in the left, center is the excitation lamp, and right is the measuring photomultiplier (52). B - Responses of rat liver to repetitive compression and decompression with oxygen. The sensitivity for measuring fluorescence changes is also indicated (52).
Rat Liver in vivo. As found previously, the fluorescence of reduced NADH observed at the surface of the rat liver decreased at high oxygen pressures. In further support of No distinctive plateau in the relationship between fluorescence decrease and oxygen pressure was observed up to oxygen pressures of 10 atm. When pressurization was rapid, the tank artifact mentioned earlier became apparent and was followed by the slower biochemical response of the liver. More satisfactory results were obtained with pressurization through a needle valve. With this method of pressurization, the oxidation of the nucleotides appeared to “keep pace” with the increase in pressure, so that little further effect was observed after final pressure was reached.
(Figure 21) demonstrates that the cycle of oxidation of the pyridine nucleotides is reversible and can be repeated. This pressurization technique was used in later experiments where the effects of uncoupling agents or amobarbital on the hyperbaric response were studied. Depending upon the susceptibility of the animal to irreversible oxygen poisoning and the final pressure of the exposure, two to four such reversible cycles can be obtained. Analyses of results for 14 animals in which such compression cycles were obtained gave decreases of 13±1% of the initial fluorescence level at pressures of 120-150 psi. The response to anoxia in rat livers, also shown in (Figure 21) , was transient, and the maximum fluorescence increase was approximately 60% of the anoxic response in this preparation.
Using the light-guide-based fluorometry, we exposed an awake brain to hyperbaric oxygenation as seen in (Figure 22) .
Results recorded from the unanesthetized rat brain exposed to 75 psi (6ATA) of oxygen are shown in (Figure 22) [55]. The reflectance at 366 nm increases during the pressure elevation period, and a few minutes later a large decrease of reflectance was recorded. The third trace from the top-the corrected fluorescence – represents the difference between the fluorescence emission at 450 nm and the reflectance at 366 nm. This correction technique is now used by several investigators [36, 39, [46, 56, 57]. During the compression, an oxidation of NADH of 10% of the normoxic fluorescence level is observed, which is maintained for 15 min. A series of oxidation-reduction cycles of NADH were recorded. About ten minutes before the animal stops breathing, the NADH increased by 50-60% at the end.
The fourth and fifth traces of Figure 22B present the EEG measured from the two hemispheres. The two hemispheres of the brain respond to HBO in the same way. A few minutes after compression, the EEG changes from the typical ‘awake’ pattern to the activated pattern, and then the seizures activity appear. The number of bursts of convulsive activity differs between animals. The EEG becomes flat just before the animal stops breathing, and the increase of NADH was recorded.
A quantitative analysis of the signals was made as seen in Figure 22C including the number of convulsions and oxidation cycles. The three parameters shown in Part B left side [55] are probably connected to each other and in most conditions occurred in the same order Between 30 and 60 psi the slopes of the changes of all three parameters were very sharp, whereas between 60 and 150 they were moderate. Thus, the 60-psi pressure is a breaking point of the line. The other three parameters shown in part C right side, are affected differently by the pressure. The maximum effect was observed at 60 psi, and the curves had a bell shape. The differences between the 60-psi point and the 30- or 150-psi level are statistically significant (P<0.005), as calculated by the Student’s t test.
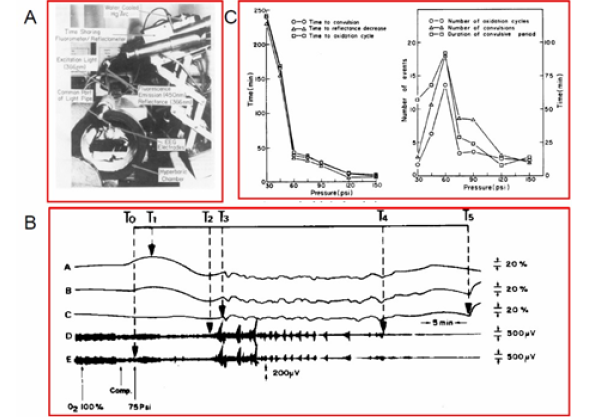
Figure 22: A – The Time-sharing fluorometer/reflectometer is attached to the hyperbaric chamber for the measurement of NADH from the cortex of the awake rat exposed to HBO (40). B - Effects of pressure level during hyperbaric oxygenation on hemodynamic, metabolic, and electrical activity of the brain. C - Effects of pressure level on electrical activity and its concomitant phenomena of convulsions and spreading depression (55).
Responses of NADH Fluorescence to Increase in Energy Consumption
Chance and Williams showed that the activation of the mitochondria by increased ADP is coupled with oxidation of NADH (decreased NADH levels) and is known as the State 4 – State 3 transition in isolated mitochondria [15, 31]. As shown in (Figure 2) , the demand for energy (ATP) by various tissues is dependent on the specific tasks of each organ or tissue. Nevertheless, the stimulation of mitochondrial function is common in all tissues in the body. The effects of tissue activation on NADH fluorescence under normoxic conditions as well as during limitation of O2 supply (hypoxia, ischemia) is presented.
Effects of Cortical Spreading Depression (CSD): Brain Cortical Spreading Depression [58] was
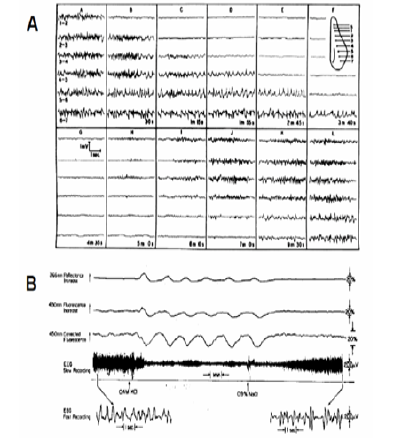
Figure 23: A - The first publication described the development of cortical spreading depression. Gradual spread of depression from A to F. Electrodes arranged as shown in the inset. A. Before stimulation L. 7 min after K. Unless otherwise mentioned, the stimuli were induction shocks at “tetanizing” frequency, applied for 3 to 5 sec. through electrodes S (58). B - Repetitive responses of the cerebral cortex to spreading depression evoked by application of 0.4 M KCI on the dura. The third trace is on an expanded amplitude scale. The arrow direction shows an increase in the optical signals. (39).
discovered by Aristides Leao in 1944 (Figure 23), After cortical electrical stimulation he recorded a wave of EEG depression propagated from the stimulation point to the rest of the hemisphere. In parallel to the EEG depression, the steady electrical potential shows a negative shift [59]. I The wave of depolarization passing through the tissue increases energy consumption [58]. In another study Leao described the effects of CSD wave on the diameter of the blood vessels on the brain surface [59]. The involvement of the microcirculation in the response to CSD was described by Van Harreveld et al few years later [60, 61]. In other studies, the The PO2 in the brain had indicated that demand for energy and oxygen consumption increased during the CSD wave [62, 63, 64]. Bures and Krivanek [65] used a special approach to check ion shift in the rat cortex and showed that extracellular potassium is elevated [66]. In the early 1970s, Vyskocil et al. used a potassium-selective microelectrode and showed clearly that extracellular K+ was elevated significantly and lead to increase in oxygen consumption [67].
When dealing with CSD and hypoxia or ischemia it is important to define the situations clearly. The discovery of the CSD event happened when rabbits’ brain was exposed to electrical stimulation in order to elicit “experimental epilepsy”. Oxygen supply to the brain was normal. Under ischemia, the EEG is also depressed as soon as the oxygen supply to the brain is limited but the mechanism behind the EEG depression is different from that operated in CSD (Figure 31).
The effects of CSD on brain mitochondrial NADH was first described in 1973, by Rosenthal and Somjen, where a clear oxidation wave was recorded [68]. In the same year [36] our team showed the same NADH oxidation response to CSD in the rat brain (Figure 09). A year later, we demonstrated the coupling between the elevated extracellular K+ induced by CSD and the NADH oxidation needed to recover the normal ionic homeostasis by the mitochondria [38]. Also, we studied in detail the nature of the NADH response to CSD as seen in (Figure 23) [39]. In order to initiate a wave of spreading depression (SD), KCl solution was passed through one of the pairs of tubes located above to the Dura mater. At threshold (~0.1 M KCl) only one wave of SD developed, while at maximum (~0.4 M KCl) many cycles were recorded. (Figure 23) represents the latter condition, in which six SD waves developed by 0.4 M KCl were terminated by washing the brain surface with 0.9% NaCl. The oxidation of NADH is corresponding to states 4-3-4 transitions and are related to the changes in energy demand during the SD cycle.
In order to show that the CSD wave recovery is dependent on the availability of oxygen another experiment performed and the results appear in (Figure 24). If energy production is in the normal range, the pumping of potassium into the cells starts immediately and its level recover back to the normal value- 3 mM. When energy production is inhibited, the pumping of K+ is inhibited, as shown in (Figure 24) [69]. In this animal, waves of CSD developed spontaneously after a few hypoxic episodes and the left side of the figure shows the regular response to CSD. The efflux of K+ reached a level of 14-15 mM and was then pumped back into the cells and the NADH (CF) shows a clear oxidation cycle as shown also in Figure 23B. In the second CSD cycle shown in (Figure 24) , hypoxia of 4% oxygen was induced at the beginning of the recovery period and the recovery process was inhibited until 100% O2 was provided again to the rat.
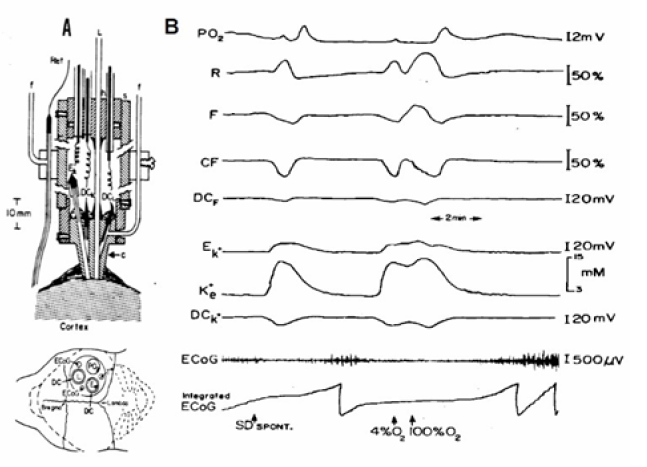
Figure 24: A - The experimental setup used (see details in (Figure 18)). B - The effects of hypoxia (4% O2) on the metabolic, ionic and electrical responses to cortical spreading depression developed spontaneously in the rat brain. Abbreviations are as in Figure 18 (69).
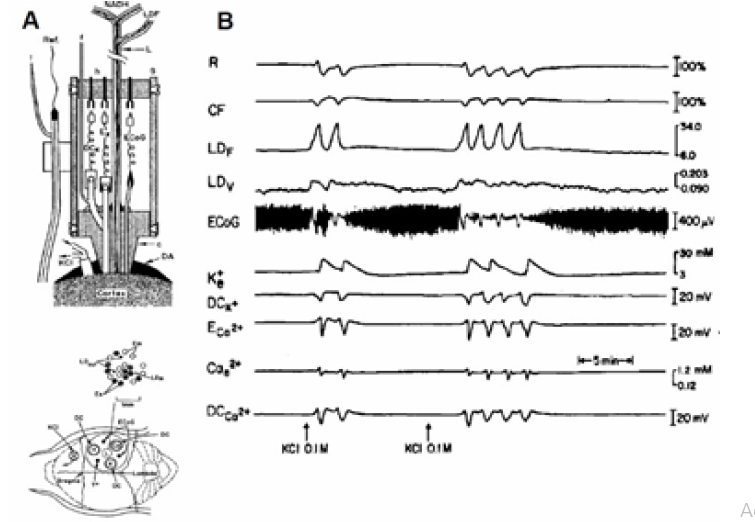
Figure 25: A - Presentation of the experimental setup used to study brain cortical spreading depression (see details in (Figure 20)). B - Metabolic, hemodynamic, ionic and electrical responses to CSD. The MPA used in this study contained two different bundles of fibers for monitoring the relative CBF and NADH redox state. R, CF - reflectance and corrected fluorescence; LDF LDv - Laser Doppler flow and volume monitored from another optic fiber located in the MPA; ECoG - electrocorticogram; K+e , ECa2+, Cae2+ - corrected potassium, uncorrected and corrected calcium ion concentrations, respectively; DCK+, DCca2+ - DC steady potential around the K+ and Ca2+ electrodes (49).
(Figure 25) shows a laser Doppler flowmeter added in order to record microcirculatory blood flow [70]. Part B shows two sets of responses to CSD recorded after 0.1M KCl application 2 mm anterior to the MPA. A clear correlation between the oxidation of NADH (CF) and large increase in relative CBF can be seen during the six cycles recorded. The changes in relative CBF are calculated in relation to the control values before the waves were initiated, The cycles of CSD were not so clear on the volume trace and we suspect it was a reading problem, since in other studies a clear connection between flow and volume was found using the same laser Doppler flowmeter.
Effects of Epileptic activity: Jobsis et al. in 1971 [32] described the influence of epileptiform activity on brain mitochondrial NADH redox state. Using anesthetized cats exposed to an epileptogenic drug (Metrazol or Strychnine), a marked expected oxidation of NADH was recorded. The changes in the electrical activity, increased the demand for energy in order to restore ionic homeostasis during the epileptic activity. The connection between the concentration of K+ and the oxidation of mitochondrial NADH was shown in cat hippocampus [71]. The effect of seizures on mitochondrial NADH was investigated later by other groups, [72, 73, [74, 75, 76, 77, 78, [79, 80, 81]. Vern et al. showed that epileptic activity, induced in hypotensive cats, caused an increase in NADH instead of a decrease [80].
In 1975, we described the mitochondria NADH responses to epileptic activity measured in non-anesthetized rats [37]. The Metrazol (100 mg/ml) was applied epidurally, to the surface of the rat brain, using a special cannula [37]. The typical response to Metrazol occurs 3-5 min after the administration of the drug and the results are shown in Figure 26-part A. The Metrazol was applied to the right hemisphere and the left one served as a control. An increase in electrical activity was recorded together with an oxidation of NADH which was in the range of 5-10% of the normoxic level. After a period of a very intense activity, the EEG became isoelectric while the NADH showed a very large oxidation cycle A different response was recorded in other animals as. In these cases, the small oxidation under Metrazol effect was recorded but the recovery to the normoxic level showed no large oxidation cycle (data not shown).(Figure 26) presents the progression of seizure activity in a special strain of gerbils [[84], developing epileptic effects as a result of monotonic noise. As seen in the (Figure 26) the exposure of the awake gerbil to noise resulted in the development of epileptic activity followed by a CSD wave [17]. The coupling between the two pathological events is clear and manifested by the electrical activity (ECoG) as well as extracellular K+ levels and NADH redox state. During the epileptic stage, extra cellular potassium increased and started to recover to the baseline, but then a larger elevation was recorded. There is a clear correlation between the various parameters during epilepsy and CSD. The decrease in NADH was smaller during the first stage, followed by an oxidation cycle typical for CSD.
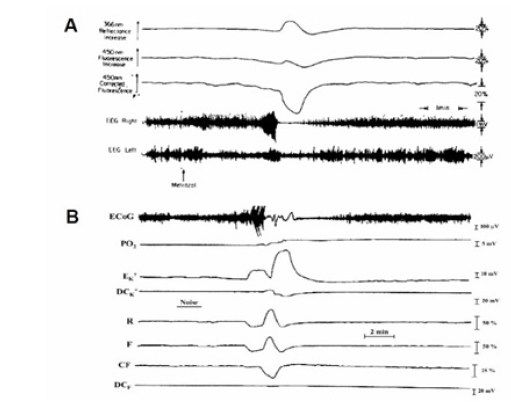
Figure 26: A - The effects of topical application of Metrazol on brain NADH fluorescence, reflectance and the EEG of the two hemispheres. Note that the amplitude of the EEG calibration in the right hemisphere is 1 mV (37). B - The development of epileptic activity followed by cortical spreading depression (CSD) wave in the brain of a seizure-prone gerbil. ECoG, electrocorticogram; PO2, partial pressure of O2; EK+, DCK+, extracellular potassium and DC steady potential measured around the K+ electrode; R, F, and CF, reflectance, NADH fluorescence, and corrected NADH fluorescence (17).
NADH responses to activation of the brain under restriction of oxygen supply: We used 2 ways to decrease oxygen supply to the brain while exposing it to an increase in oxygen demand by local brain ischemia or systemic hypoxia.
In order to study the effects on the metabolic response of the brain resulting from the limitation of its blood supply, the carotid artery ligation technique was used. The common carotid arteries were dissected in the neck, and loops of ligature were placed around the vessels. Measurements of NADH redox state were taken by a light guide holder located above the right hemisphere. Initiation of cortical spreading depression (CSD) cycles was initiated by flushing KCl solution through a small push-pull cannula implanted above the right hemisphere so that NADH fluorescence measurements were taken at the same time. KCl was applied topically to the cortex and NADH fluorescence and ECoG measurements were taken.
This, response represents the normal brain and served as a control. Three hours after the operation when the animals were fully awake, the carotid arteries were ligated.
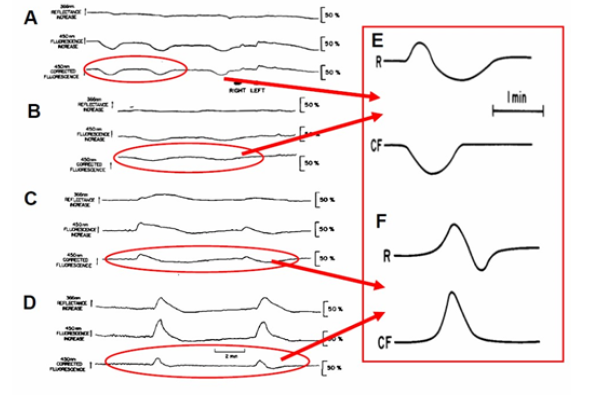
Figure 27: A - The effect of acute bilateral carotids occlusion on the metabolic response to cortical spreading depression (SD). Parts B, C and D were measured 15 min, 90 min and 18h after occlusion, respectively (85). E -The metabolic responses of the normoxic and ischemic (F) brain to a wave of CSD R-366 nm reflectance, CF-NADH change(101).
(Figure 27) shows the response of an awake brain to a bilateral carotid artery ligation and CSD [85]. Before ligation, 0.5 M KCl was applied to the cortex and the normal metabolic response to CSD was recorded (Figure 27) . The bilateral ligation of the carotid arteries caused an increase in NADH, and since the KCl remained on the cortex during this period (about 3 min), the response to SD was immediately apparent. In this animal, the duration of the oxidation cycle became very long after the ligation, as a response to spreading depression. A similar long oxidation cycle was recorded again later (lower Part-B), but within 2h the metabolic response to SCD disappeared (not shown).
In this set of experiments 10 rats were involved. Figure 27 shows a typical response of the brain to acute bilateral carotid arteries ligation. Parts B, C and D show the response of NADH to spreading depression elicited 15 min, 90 min and 18h, respectively, after the ligation. In this animal the changes of the reflectance (upper trace in each part) was minimal during the CSD cycles. In part D, a very long biphasic cycle of the reflectance was recorded. The effect of the ligation on the NADH was transient, namely, that a small increase was recorded during the ligation, but within two minutes it recovered to the base line. The main effect of the ligation is on the response of the brain to CSD which increases oxygen utilization. During the first 60 min after ligation the oxidation cycle can be detected as a response to CSD, but the amplitude of the oxidation (decrease) was diminished and the duration of the cycle became much longer. The qualitative change in the response of the brain to CSD started several hours after the ligation. In part C, the response to CSD was recorded 90 min after the ligation. A biphasic response of NADH to CSD was recorded. At the beginning of the cycle an increase in NADH was recorded, while afterwards the NADH decreased below the base line level. In part D (18h after ligation) the response of the brain was completely opposite to what was measured before the ligation (part A). Instead of an ‘oxidation cycle’ as a response to CSD, we found a ‘reduction cycle’ namely an increase in NADH redox state. (Figure 27) -right side illustrate schematically the difference in response to CSD recorded in normoxic (E) and ischemic brain (F).
The effects of hypoxia on the response to epileptic activity induced by Metrazol is shown in (Figure 28) [37]. Matrazol was applied under hypoxic condition. The animal was exposed to air (A), 10% O2 (B), 7.5% O2 (C), and 5% O2 (D). The line N.L. represents the normoxic level of NADH. In all oxygen concentrations, an increase in activity followed by a flat EEG was recorded. The changes in NADH are the same as in Figure 26A, namely, that two phases in the oxidation were found. By giving the animal lower concentrations of O2 the baseline shifted to a more reduced level depending on the O2 level.
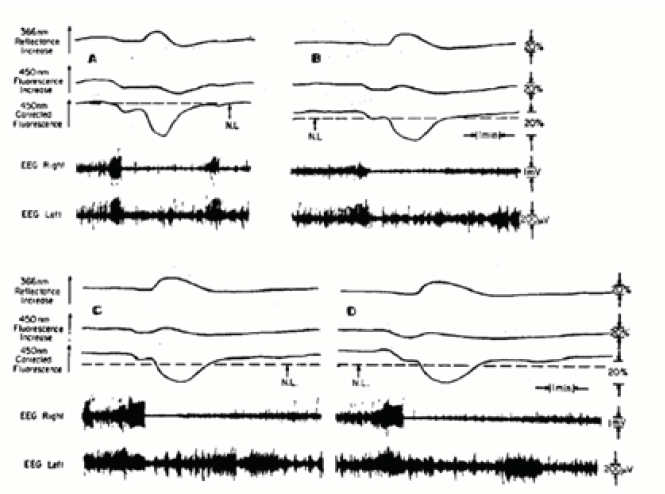
Figure 28: The effects of graded hypoxia on the response of the awake brain to local application to Metrazol. The fluorescence responses occur 3-5 min after the application of Metrazol. The levels of O2 were in A, air; B, 10%; C, 7.5%; and D, 5% (37).
In order to test the validity of the 2 types of NADH responses to CSD induced in the normoxic and ischemic brain we used a different approach. We constructed and tested a mathematical model [86], capable of simulating changes in brain energy metabolism under various pathophysiological conditions. The model incorporates the following parameters: cerebral blood flow, partial oxygen pressure, mitochondrial NADH redox state, and extracellular potassium. Accordingly, all the model variables are only time dependent (‘point-model’ approach). Numerical runs demonstrate the ability of the model to mimic pathological conditions, such as complete and partial ischemia, cortical spreading depression under normoxic or partial ischemic conditions. The pathological state of cortical spreading depression was induced by “potassium injection”. When CSD was induced, the increase in energy requirement leads to the activation of Na+-K+ ATPase in order to restore the normal potassium distribution and causes an increase in blood flow and a decrease in NADH. When the blood flow decreases mildly (mimicking the ischemic period, an infusion of potassium was modeled. Accordingly, the blood flow slightly decreases as a result of the infusion, and then increases to the new resting level.
Monitoring of the Human Brain in Neurosurgical OR and ICU
After accumulation of preliminary results using the 1st clinical multiparametric monitoring system [4], a new commercial device was developed. In the new device-the TiSpec, we monitored only three out of the 8 parameters monitored by the multiparametric monitoring system [4]. We used only the optical based probes in order to simplify the technology and to shorten the “time to market” of the new device. The TiSpec provided parameters of microcirculation (blood flow and volume) and mitochondrial NADH. The TiSpec and the various probes developed for this device are presented in (Figure 29). This device was tested in animal models as well as in neurosurgical patients. In (Figure 29) , one of the various holders of the fiber optic probe are shown. In. In Figure 29B the probe is located on the surface of the brain during operation. More details regarding the Tispec were published [87, 88].
The first attempt to monitor NADH from the human brain by our group was in 1990. We monitored few neurosurgical patients in the Hospital of the University of Pennsylvania after IRB approval. We monitored in those patients only Mitochondrial NADH and microcirculatory blood flow since extra time availability during the surgical procedure is very limited. The responses of the human brain to ischemia are presented in (Figure 29) In this patient a short brain ischemic episode was induced by the occlusion of the common carotid artery during the preparations for brain aneurysm procedure. As seen in (Figure 29) an immediate decrease of CBF was recoded simultaneously with an increase in NADH redox state with only very small changes in the reflectance recorded (R). The recovery of CBF and NADH oxidation were very fast. The time to reach 50% of the change in NADH during the recovery was less than 3 seconds. In contrary to the NADH recovery to the pre-ischemic level, the CBF signal shows a large hyperemic response (large overshoot in CBF).
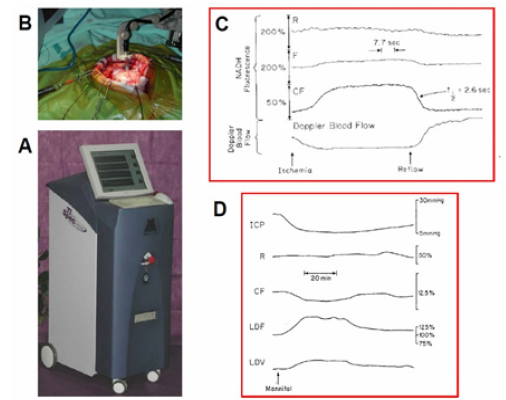
Figure 29: A - The Tissue spectroscope (TiSpec) device used in monitoring patients in the neurosurgical operation room. B - The application of the standard optical probe with the floating arm during an operation for the removal of a brain tumor [136,137]. C - Responses of the human cortex to a decrease in blood flow induced by common carotid artery occlusion. R, F, CF – Reflectance, Fluorescence and corrected fluorescence. D - Effects of IV infusion of Mannitol on brain hemodynamic, metabolic and ionic activities in head injured patient (4).
In the 1980’s we developed the first multiparametric monitoring system that was adapted to experimental animals exposed to various pathological conditions [89-92]. Later on, we improved the system in order to introduce it to the neurosurgical operating room or intensive care unit (ICU) for patient monitoring. The concept behind the development was that the more parameters that are monitored, the better the diagnosis of the situation will be. The ideal system was to monitor eight parameters from the brain (right side) in addition to the various systemic parameters monitored in every patient hospitalized. The long-term vision was that all parameters monitored by the 2 monitoring systems will be integrated in the same data bank and an expert system will be developed for better diagnosis of the patients. The translation of this concept into a practical tool and monitoring device is presented in (Figure 30) [93-98].
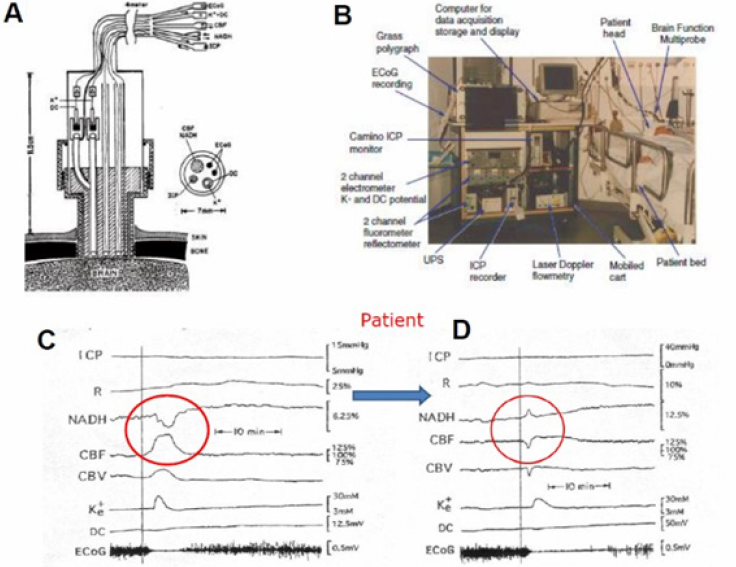
Figure 30: A - Schematic representation of the multiprobe assembly (MPA) used for monitoring the brain of head-injured patients in the ICU. The MPA is connected to the brain via a special holder screwed into the skull. ICP, intracranial pressure probe; CBF, NADH-fiber optic light guide probe to measure local cerebral blood flow, (CBF) and mitochondrial redox state (NADH); K+, DC, extracellular K+ mini surface-electrode surrounded by a DC steady potential monitoring space; ECoG, bipolar electrocortical electrodes (4). B - The first clinical monitoring setup (“Brain Monitor”) used in the neurosurgical intensive care unit. The Multiparametric monitoring system consists of various devices installed in the same cart. The MPA shown in (Figure 30) is connecting the brain of the patient to the Brain monitor (96). C+D - Two responses of the brain to a wave of cortical spreading depression developed spontaneously in a severely head-injured patient. ICP intracranial pressure; R - 366 nm reflectance, NADH - 450 nm corrected fluorescence; CBF, CBV cerebral blood flow and volume measured by laser Doppler flowmetry; Ke, DC - extracellular potassium levels and the DC steady potential measured around the K+ electrode; ECoG electrocorticography.
Based on the well-developed MultiProbe Assembly (MPA) used for animal experiments [3] a new MPA was developed and applied to patients monitored in the neurosurgical operation rooms and ICU. This device allowed us to monitor, in real-time, the hemodynamic, metabolic ionic and electrical activities in the brain of comatose patients. All details regarding the technology and the clinical setup appear in our published paper [4]. Figure 30A shows the longitudinal section of the MPA (measuring 8 parameters) used in the neurosurgical operating room and ICU. The MPA was connected to the multiparametric monitoring system shown in Figure 30B.
The next step was to use the multiparametric monitoring system in the neurosurgical ICU. In this group, 14 patients were monitored (Figure 30). Only one of the 14 monitored patients had developed spontaneous changes in all parameters like the typical responses to SD in animals. These changes were recorded 4.5h after the beginning of monitoring, which was 7 hours after admittance to the hospital. During the measuring period, this patient was bilaterally irresponsive to pain, his pupils were dilated and non-reactive to light. He was mechanically ventilated, and his brain CT scan showed evidence of severe brain edema in the left hemisphere and right parietal hemorrhagic contusion. The measurements were taken from the right frontal lobe. As seen in (Figure 30) , the ECoG became depressed for 10-15 minutes and at the same time a cycle of elevated extracellular K+ and a small negative shift in the DC potential were recorded. These changes are typical to transient depolarization, which is a dominant part of cortical spreading depression. NADH was oxidized while blood flow and volume increased. This patient exhibited repetitive SD cycle every 20-30 minutes. However, the following SD like cycles that were recorded from this patient (after the first ones) showed different hemodynamic and metabolic responses (Figure 30) . While extracellular level of K+ and the pattern of the DC potential were very similar, NADH oxidation cycles were replaced by a biphasic cycle comprised mainly of a phase of increased NADH followed by a small oxidation phase. The compensation of blood flow and volume was also reversed at this time. The monophasic increase in CBF and CBV was replaced by an initial decrease followed by a smaller increase. Significant correlations were seen between CBF, CBV and NADH (CF) and extracellular K+ levels [95, 100, 101, 102, 103, 104, 105, 106, 107, 108, 109, 110, 111, 112, 113, 114, 115, 116, 117, 118, 119, 120, 121, 122, 123, 124, 125, 126, 127, 128, 129, 130, 131, 131, 132, 133], 134, 135, 136, 137, 138, 139, 140, 141, 142, 143, 144, 145, 146, 147, 148, 149, 150, 151, 152, 153, 154, 155, 156, 157, 158, 159, 160, 161, 162, 163, 164, 165, 166, 167, 168, 169, 170, 171, 172, 173, 174, 175, 176, 177, 178, 179, 180, 181, 182, 183, 184, 185, 186, 187, 188, 189, 190, 191, 192, 193, 194, 195, 196, 197, 198].
The severe head injured patient who showed high levels of ICP was treated with Mannitol infusion as seen in Figure 29D. The infused bolus led to a clear decrease in ICP associated with a large increase of CBF and a beneficial effect on tissue oxygenation state (oxidation of NADH) [99, 100, 101, 102, 103, 104, 105, 106, 107, 108, 109].
Discussion and Future perspectives
(Figure 31) [16] presents, in a schematic way, the relationship between various physiological parameters monitored in vivo under different experimental perturbations. The upper two factors (left side), namely, systemic hypoxia and cerebral ischemia affect the availability of oxygen so that energy metabolism is inhibited (blue arrows). The other two perturbations shown are cortical spreading depression and epileptic activity that induced cortical depolarization (purple arrows). All four perturbations are affecting the same type of processes in the brain such as CBF, NADH and extracellular levels but in the opposite direction as seen in the scheme. Under hypoxia and ischemia, the production of ATP by the mitochondria is decreased and becomes a limiting factor in the system. Due to the inhibition of the ionic pumps, the ionic homeostasis is disrupted, and hypoxic or ischemic cortical depolarization is developed[110, 111, 112, 113, 114, 115, 116, 117, 118, 119, 120, 121, 122, 123, 124, 125, 126, 127, 128, 129, 130]. The end points of this process are changes in the electrical activities recorded as a depression of the ECoG and a negative shift in the DC steady potential. In addition, due to the depolarization event the extracellular potassium is elevated. If this situation persists for more than a few minutes, irreversible damage to the cortex may develop. When the brain is activated by CSD or epileptic activity (lower left side) the events will propagate toward the activation of the brain and energy consumption is increased (purple arrows) [131-149]. The coupling between the two pathological events is clear and manifested by the electrical activity (ECoG) as well as extracellular K+ levels and NADH redox state. During the epileptic stage, extracellular potassium increased and started to recover to the baseline, but then a larger elevation was recorded. There is a clear correlation between the various parameters during epilepsy and CSD. The decrease in NADH was smaller during the first stage, followed by an oxidation cycle typical for CSD [150, 151, 152, 153, 154, 155, 156, 157, 158, 159, 160, 161, 162, 163, 164, 165, 166, 167, 168, 169, 170, 171, 172, 173, 174, 175, 176, 177, 178, 179, 180, 181, 182, 183, 184, 185, 186, 187, 188, 189, 190, 191, 192, 193, 194, 195, 196, 197, 198].
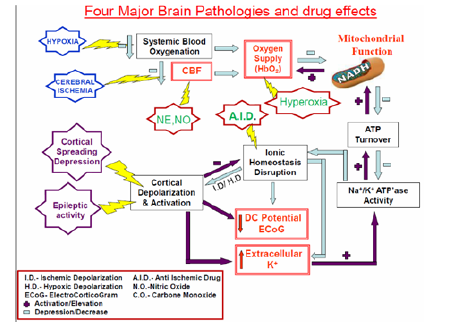
Figure 31: A schematic representation of the effects of various pathological conditions on the energetic-mitochondrial function, ionic and hemodynamic state of the cerebral cortex (details are in the text) (16).
After the accumulation of huge amounts of experimental results, we decided to develop a preliminary tool named Brain Metabolic Score-BMS as seen in (Figure 32) . In the initial developmental stage, the BMS was calculated by using two parameters, namely the NADH and CBF. In the present study we are presenting the preliminary developed Brain Metabolic Score- BMS that could be used in evaluating the metabolic state of the cerebral cortex in real time. We used the brain as a typical organ for the calculation of the Score, but the same approach could be used for other organs or tissues. The goal of our study is to develop the Tissue Metabolic Score that could be monitored in the intensive care units or in the operating rooms. In those medical environments the need for objective approach for decision making processes is very important as discussed previously [183-199]
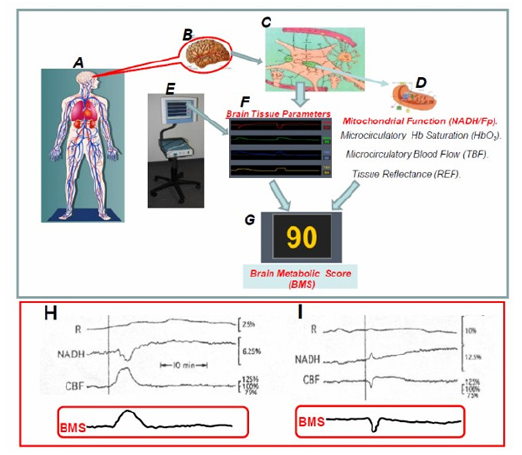
Figure 32: A-G - Schematic presentation of the elements involved in the concept “Brain Metabolic Score “(BMS). H+I - The calculated BMS of human brain during the development of two cortical spreading depression cycles in a head injured patient.
In order to develop the BMS we used the multiparametric monitoring system described in detail in (Figure 15) and the development of the score appeared in our publication [200, 201, 202, 203, 204, 205, 206, 207, 207, 208, 209, 210, 211, 212, 213, 214, 215, 216, 217, 218, 219, 220, 221, 222, 223, 224, 225, 226, 227, 228, 229, 230, 231, 232, 233, 234, 235].
Conflict of Interest
The Author declares no conflict of interest exists.
References
- Benda C (1898) Ueber die Spermatogenese der Vertebraten und höherer Evertebraten, II. Theil: Die Histiogenese der Spermien. Arch Anat Physiol 73: 393-398.
- Waltemath CL (1970) Oxygen, uptake, transport, and tissue utilization. Anesth Analg 49: 184-203.
- Mayevsky A, Meilin S, Rogatsky GG, Zarchin N, Sonn J (1995) Multiparametric monitoring of the awake brain exposed to carbon monoxide. Journal of Applied Physiology 78(3): 1188-1196.
- Mayevsky A, Doron A, Manor T, Meilin S, Zarchin N (1996) Cortical spreading depression recorded from the human brain using a multiparametric monitoring system. Brain Res 740(1-2): 268-274.
- Mayevsky A, Sonn J, Barbiro Michaely E (2013) Physiological mapping of brain functions In Vivo: Surface monitoring of hemodynamic metabolic ionic and electrical activities in real-time. Journal of Neuroscience and Neuroengineering 2(2): 150-177.
- Barcroft J (1914) The Respiratory Function of Blood. Cambridge University Press, Cambridge.
- Chance B, Williams GR, Holmes WF, Higgins J (1955) Respiratory enzymes in oxidative phosphorylation (V- A mechanism for oxidative phosphorylation). J Biol Chem 217(1): 439-451.
- Chance B, Williams GR (1955) A method for the localization of sites for oxidative phosphorylation. Nature 176: 250-254.
- Chance B, Williams GR (1955) Respiratory enzymes in oxidative phosphorylation (III- The steady state). J Biol Chem 217(1): 409-427.
- Chance B, Williams GR (1955) Respiratory enzymes in oxidative phosphorylation (IV- The respiratory chain). J Biol Chem 217(1): 429-438.
- Harden A, Young WJ (1905) The influence of phosphates on the fermentation of glucose by yeast-juice: preliminary communication. Proc Chem Soc (London) 21: 189-191.
- Harden A, Young W (1906) Alcoholic ferment of yeast-juice Part II Co-ferment of yeast-juice. Proc Roy Soc B 78(526): 369-375.
- Warburg O, Christian W, Griese A (1935) Wasserstoff-Ubertragendes Co-ferment, seine Zusamensetzung und Wirkungsweise. Biochem Zeitschrift 282: 157.
- Chance B, Cohen P, Jobsis F, Schoener B (1962) Intracellular oxidation-reduction states In Vivo. Science 137(3529): 499-508.
- Kohen E, Kohen C, Thorell B (1969) Use of microfluorimetry to study the metabolism of intact cells. Biomed Eng 554-559.
- Mayevsky A, Barbiro Michaely E (2013) Shedding light on mitochondrial function by real time monitoring of NADH fluorescence: I. Basic methodology and animal studies. J Clin Monit Comput 27(1): 1-34.
- Mayevsky A, Barbiro Michaely E (2007) Mitochondrial function In Vivo evaluated by NADH fluorescence: from animal models to human studies. Am J Physiol Cell Physiol 292(2): C615-C640.
- Theorell H, Nygaard AP (1954) Kinetics and equilibria in flavoprotein systems. II. The effects of pH, anions and temperature on the dissociation and reassociation of the old yellow enzyme. Acta Chem Scand 8: 1649-1658.
- Theorell H, Nygaard AP (1954) Kinetics and equilibria in flavoprotein systems I. A fluorescence recorder and its application to a study of the dissociation of the old yellow enzyme and its resynthesis from riboflavin phosphate and protein. Acta Chem Scand 8: 877-888.
- Theorell H, Nygaard AP, Bonnichsen R (1954) Kinetics of alcohol dehydrogenases, studies with the aid of a fluorescence recorder. Acta Chem Scand 8: 1490-1491.
- Boyer PD, Theorell H (1956) The change in reduced diphosphopyridine nucleotide (DPNH) fluorescence upon combination with liver alcohol dehydrogenase (ADH). Acta Chem Scand 10: 447-450.
- Duysens LNM, Amesz J (1957) Fluorescence spectrophotometry of reduced phosphopyridine nucleotide in intact cells in the near-ultraviolet and visible region. Biochimica et Biophysica Acta 24(1): 19-26.
- Mayevsky A (1984) Brain NADH redox state monitored In Vivo by fiber optic surface fluorometry. Brain Res 319(1): 49-68.
- Ince C, Coremans JMCC, Bruining HA (1992) In Vivo NADH fluorescence. In: Erdmann W, Bruley DF (Eds.), Plenum Press, New York, pp. 277-296.
- Chance B, Legallias V (1959) Differential microfluorimeter for the localization of reduced pyridine nucleotide in living cells. Review of Scientific Instruments 30(8): 732-735.
- Chance B, Jobsis F (1959) Changes in fluorescence in a frog sartorius muscle following a twitch. Nature 184: 195-196.
- Chance B (1959) The response of mitochondria to muscular contraction. Ann NY Acad Sci 81: 477-489.
- Chance B, Thorell B (1959) Fluorescence measurements of mitochondrial pyridine nucleotide in aerobiosis and anaerobiosis. Nature 184: 931-934.
- Chance B, Legallias V, Schoener B (1963) Combined fluorometer and double-beam spectrophotometer for reflectance measurements. Review of Scientific Instruments 34(12): 1307-1311.
- Jobsis FF, Stainsby WN (1968) Oxidation of NADH during contractions of circulated mammalian skeletal muscle. Respiration Physiology 4(3): 292-300.
- Jobsis F, Legallias V, O Connor M (1966) A regulated differential fluorometer for the assay of oxidative metabolism in intact tissues. IEEE Trans Biomed Eng BME 13(2): 93-99.
- Jobsis FF, O Connor M, Vitale A, Vreman H (1971) Intracellular redox changes in functioning cerebral cortex. I. Metabolic effects of epileptiform activity. J Neurophysiol 34(5): 735-749.
- Jobsis FF, O Connor MJ, Rosenthal M, Van Buren JM (1971) Fluorometric monitoring of metabolic activity in the intact cerebral cortex. in Excerpta medica international congress series, NO. 253, In: Somjen GG (Ed.), France, pp. 18-26.
- Laszlo Gyulai, Eörs Dora, Arisztid GB Kovach (1982) NAD/NADH: redox state changes on cat brain cortex during stimulation and hypercapnia. American Journal of Physiology-Heart and Circulatory Physiology 243(6): H619-627.
- Chance B, Oshino N, Sugano T, Mayevsky A (1973) Basic principles of tissue oxygen determination from mitochondrial signals. Oxygen Transport to Tissue 37A: 277-292.
- Mayevsky A, Chance B (1973) A new long-term method for the measurement of NADH fluorescence in intact rat brain with implanted cannula. Adv Exp Med Biol 37A: 239-244.
- Mayevsky A, Chance B (1975) Metabolic responses of the awake cerebral cortex to anoxia hypoxia spreading depression and epileptiform activity. Brain Res 98: 149-165.
- Mayevsky A, Zeuthen T, Chance B (1974) Measurements of extracellular potassium, ECoG and pyridine nucleotide levels during cortical spreading depression in rats. Brain Res 76: 347-349.
- Mayevsky A, Chance B (1974) Repetitive patterns of metabolic changes during cortical spreading depression of the awake rat. Brain Res 65: 529-533.
- Mayevsky A (1975) The effect of trimethadione on brain energy metabolism and EEG activity of the conscious rat exposed to HPO. J Neurosci Res 1: 131-142.
- Franke H, Barlow CH, Chance B (1980) Fluorescence of pyridine nucleotide and flavoproteins as an indicator of substrate oxidation and oxygen demand of the isolated perfused rat kidney. Int J Biochem 12(1-2): 269-275.
- Chance B, Mayevsky A, Goodwin C, Mela L (1974) Factors in oxygen delivery to tissue. Microvasc Res 8: 276-282.
- Chance B, Williams GR (1956) The respiratory chain and oxidative phosphorylation. Advances in Enzymology In: Nord FF (Ed.), Interscience Publisher, New York, USA, pp. 65-134.
- Chance B, Schoener B (1962) Correlation of oxidation-reduction changes of intracellular reduced pyridine nucleotide and changes in electro-encephalogram of the rat in anoxia. Nature 195: 956-958.
- Chance B, Schoener B, Schindler F (1963) The intracellular oxidation-reduction state. In: Dickens F, Neil E (Eds.), Pergamon Press, London; pp. 367-392.
- Harbig K, Chance B, Kovách AG, Reivich M (1976) In Vivo measurement of pyridine nucleotide fluorescence from cat brain cortex. J Appl Physiol 41(4): 480-488.
- Mayevsky A, Chance B (1976) The effect of decapitation on the oxidation-reduction state of NADH and ECoG in the brain of the awake rat. Adv Exp Med Biol 75: 307-312.
- Zarchin N, Mayevsky A (1981) The effects of age on the metabolic and electrical responses to decapitation in the awake and anesthetized rat brain. Mech Ageing Dev 16(3): 285-294.
- Mayevsky A (1992) Cerebral blood flow and brain mitochondrial redox state responses to various perturbations in gerbils. Adv Exp Med Biol 317: 707-716.
- Chance B (1967) Non-destructive readout of biochemical data, Williams and Wilkins, Baltimore.
- Chance B, Jamieson D, Coles H (1965) Energy-linked pyridine nucleotide reduction: inhibitory effects of hyperbaric oxygen in vitro and In Vivo. Nature 206(981): 257-263.
- Chance B, Jamieson D, Williamson JR (1966) Control of the oxidation-reduction state of reduced pyridine nucleotides In Vivo and in vitro by hyperbaric oxygen. In Third International Conference on Hyperbaric Medicine, National Academy of Sciences.
- Chance B (1966) The identification and control of metabolic states. Genootschap ter Bevordering van Natuur-, Genees-, en Heelkunde te Amsterdam p. 5-37.
- Chance B, Thurman RG, Gosalvez M (1969) Oxygen affinities of cellular respiration. Forvarsmedicin 5: 235-243.
- Mayevsky A, Shaya B (1980) Factors affecting the development of hyperbaric oxygen toxicity in the awake rat brain. J Appl Physiol 49(4): 700-707.
- Kobayashi S, Kaede K, Nishiki K, Ogata E (1971) Microfluorometry of oxidation-reduction state of the rat kidney in situ. J Appl Physiol 31(5): 693-696.
- Kobayashi S, Nishiki K, Kaede K, Ogata E (1971) Optical consequences of blood substitution on tissue oxidation- reduction state microfluorometry. J Appl Physiol 31(1): 93-96.
- Leao AAP (1944) Spreading depression of activity in cerebral cortex. J Neurophysiol 7(6): 359-390.
- Leao AAP (1947) Further observations on the spreading depression of activity in the cerebral cortex. J Neurophysiol 10(6): 409-414
- Van Harreveld A, Stamm JS (1952) Vascular concomitants of spreading cortical depression. J Neurophysiol 15(6): 487-496.
- Van Harreveld A, Ochs S (1957) Electrical and vascular concomitants of spreading depression. Am J Physiol 189(1): 180-192.
- Lukyanov Ld, Bures J (1967) Changes in pO2 due to spreading depression in cortex and nucleus caudatus of rat. Physiol Bohemoslov 16(5): 449-455.
- Krivanek J (1961) Some metabolic changes accompanying Leao's spreading cortical depression in the rat. J Neurochem 6: 183-189.
- Bures J (1956) Some metabolic aspects of Leao's spreading depression. J Neurochem 1(2): 153-158.
- Bures J, Krivanek J (1960) Ionic movements in the brain as studied with the aid of washing the cortical surface with an epidural cannula. Physiol Bohemoslov 9: 488-493.
- Krivanek J, Bures J (1960) Ion shifts during Leao's spreading cortical depression. Physiol. Bohemoslov 9: 494-503.
- Vyskocil F, Bures J, Kriz N (1972) Potassium-selective microelectrodes used for measuring extracellular brain potassium during spreading depression and anoxic depolarization in rats. Brain Res 39(1): 255-259.
- Rosenthal M, Somjen G (1973) Spreading depression, sustained potential shifts, and metabolic activity of cerebral cortex of cats. J Neurophysiol 36(4): 739-749.
- Mayevsky A, Zarchin N, Yoles E, Tannenbaum B (1986) Oxygen supply to the brain in hypoxic and hyperoxic conditions. in Advances in the Biosciences. “O2-Transport in Red Blood Cells” Nicolau C, [Ed.], Pergamon Press. UK. Pp. 119-132.
- Mayevsky A, Frank K, Muck M, Nioka S, Kessler M, et al. (1992) Multiparametric evaluation of brain functions in the Mongolian gerbil In Vivo. J Basic Clin Physiol Pharmacol 3(4): 323-342.
- O'Connor MJ, Lewis DV, Herman CJ (1973) Effects of potassium on oxidative metabolism and seizures. Electroencephalog Clin Neurophysiol 35(2): 205-208.
- Dóra E, Gyulai L, Kovách AG (1984) Determinants of brain activation-induced cortical NAD/NADH responses In Vivo. Brain Res 299(1): 61-72.
- Hempel FG, Kariman K, Saltzman HA (1980) Redox transitions in mitochondria of cat cerebral cortex with seizures and hemorrhagic hypotension. Am J Physiol 238(2): H249-H256.
- Tenny RT, Sharbrough FW, Anderson RE, Sundt TM (1980) Correlation of intracellular redox states and pH with blood flow in primary and secondary seizure foci. Ann Neurol 8(6): 564-573.
- Lothman E, Lamanna J, Cordingley G, Rosenthal M, Somjen G (1975) Responses of electrical potential potassium levels, and oxidative metabolic activity of the cerebral neocortex of cats. Brain Res 88(1): 15-36.
- Somjen GG, Rosenthal M, Cordingley G, LaManna J, Lothman E (1976) Potassium, neuroglia, and oxidative metabolism in central gray matter. Fed Proc 35(6): 1266-1271.
- Rosenthal M, LaManna J (1977) Oxidative metabolism and electrophysiological activity in intact central nervous system. in Oxygen and Physiological Function Jobsis FF, et al. [Ed’s.].
- Dóra E, Koller A, Kovách AG (1984) Effect of topical adenosine deaminase treatment on the functional hyperemic and hypoxic responses of cerebrocortical microcirculation. J CBF Metab 4(3): 447-457.
- Dora E (1983) Glycolysis and epilepsy-induced changes in cerebrocortical NAD/NADH redox state. J Neurochem 41(6): 1774-1777.
- Kovách AG, Dóra E, Szedlacsek S, Koller A (1983) Effect of the organic calcium antagonist D-600 on cerebrocortical vascular and redox responses evoked by adenosine, anoxia and epilepsy. J CBF Metab 3(1): 51-61.
- Schuchmann S, Buchheim K, Meierkord H, Heinemann U (1999) A relative energy failure is associated with low-Mg2+ but not with 4- aminopyridine induced seizure-like events in entorhinal cortex. J Neurophysiol. 81(1): 399-403.
- Vern B, Schuette WH, Whitehouse WC, Mutsuga N (1976) Cortical oxygen consumption and NADH fluorescence during metrazol seizures in normotensive and hypotensive cats. Exp Neurol 52(1): 82-99.
- Vern BA, Schuette WH, Mutsuga N, Whitehouse WC (1979) Effects of ischemia on the removal of extracellular potassium in cat cortex during pentylenetetrazol seizures. Epilepsia 20(6): 711-724.
- Mayevsky A, Kaplan H, Haveri J, Haselgrove J, Chance B (1986) Three-dimensional metabolic mapping of the freeze-trapped brain: Effects of ischemia on the Mongolian gerbil. Brain Res 367(1-2): 63-72.
- Mayevsky A (1978) Ischemia in the brain: The effects of carotid artery ligation and decapitation on the energy state of the awake and anesthetized rat. Brain Res 140(2): 217-230.
- Vatov L, Kizner Z, Ruppin E, Meilin S, Manor T, et al. (2006) Modeling brain energy metabolism and function: A multiparametric monitoring approach. Bull Math Biol 68(2): 275-291.
- Pevzner E, Deutsch A, Manor T, Dekel N, Etziony R, et al. (2003) Real-time multiparametric spectroscopy as a practical tool for evaluation of tissue vitality In Vivo. in Proc. SPIE, Vo Dinh T, et al. [Eds.] 4958:171-182.
- Mayevsky A, Manor T, Pevzner E, Deutsch A, Etziony R, et al. (2004) Tissue spectroscope: a novel In Vivo approach to real time monitoring of tissue vitality. J Biomed Opt 9(5): 1028-1045.
- Friedli CM, Sclarsky DS, Mayevsky A (1982) Multiprobe monitoring of ionic, metabolic, and electrical activities in the awake brain. Am J Physiol 243(3): R462-R469.
- Mayevsky A, Sclarsky DS (1983) Correlation of brain NADH redox state, K+, PO2 and electrical activity during hypoxia, ischemia and spreading depression. Adv Exp Med Biol 159: 129-141.
- Mayevsky A (1983) Multiparameter monitoring of the awake brain under hyperbaric oxygenation. J Appl Physiol 54(3): 740-748.
- Mayevsky A, Friedli CM, Reivich M (1985) Metabolic, ionic and electrical responses of the gerbil brain to ischemia. Am J Physiol 248(1 Pt 2): R99-R107.
- Hanson CW 3rd, Marshall BE (2001) Artificial intelligence applications in the intensive care unit. Crit Care Med 29(2): 427-435.
- Bates JH, Young MP (2003) Applying fuzzy logic to medical decision making in the intensive care unit. Am J Respir Crit Care Med 167(7): 948-952.
- Kutai Asis H, Barbiro Michaely E, Deutsch A, Mayevsky A (2006) Fiber optic based multiparametric spectroscopy In Vivo: Toward a new quantitative tissue vitality index. SPIE Proc 6083.
- Mayevsky A, Barbiro Michaely E (2013) Shedding light on mitochondrial function by real time monitoring of NADH fluorescence: II: Human studies. J Clin Monit Comp 27(2): 125-145.
- Chance B (1962) Kinetics of enzyme reactions within single cells. Ann NY Acad Sci 97: 431-448.
- Chance B, Legallias V, Schoener B (1962) Metabolically linked changes in fluorescence emission spectra of cortex of rat brain, kidney and adrenal gland. Nature 195: 1073-1075.
- Kohen E, Kohen C, Thorell B (1969) Kinetics of the extramitochondrial fluorescence response to glycolytic substrate in amytal grown ascites cells. Hoppe-Seyler's Z Physiol Chem 350(3): 297-307.
- Yoles E, Zarchin N, Zurovsky Y, Guggenheimer Furman E, Mayevsky A (1999) Brain metabolic and ionic responses to systemic hypoxia in the newborn dog In Vivo Neurol Res 21(8): 765-770.
- Mayevsky A, Ventura V, Zarchin N (1989) Metabolic responses to hyperbaric oxygenation in the normoxic and ischemic brain. (Bitterman N, Lincoln R eds.), Israel.
- Theorell H, Bonnichsen R (1951) Studies on liver alcohol dehydrogenase I. Equilibria and initial reaction velocities. Acta Chem Scand 5: 1105-1126.
- Chance B, Legallias V (1951) Rapid and sensetive spectrophotometry. II. A stopped-flow attachment for a stabilized quartz spectrophotometer. Rev Sci Instr 22: 627-638.
- Chance B, Neilands JB (1952) Studies on lactic dehydrogenase of heart. II. A compound of lactic dehydrogenase and reduced pyridine nucleotide. J Biol Chem 199(1): 383-387.
- Chance B (1954) Spectrophotometry of intracellular respiratory pigments. Science 120(3124): 767-775.
- Chance B, Baltscheffsky H (1958) Respiratory enzymes in oxidative phosphorylation (VII - Binding of intramitochondrial reduced pyridine nucleotide). J Biol Chem 233(3): 736-739.
- Mayevsky A, Chance B (1982) Intracellular oxidation-reduction state measured in situ by a multicannel fiber-optic surface fluorometer. Science 217: 537-540.
- Mayevsky A, Flamm ES, Pennie W, Chance B (1991) A fiber optic based multiprobes system for intraoperative monitoring of brain functions. SPIE 1431: 303-313.
- Sonn J, Granot E, Etziony R, Mayevsky A (2002) Effect of hypothermia on brain multi-parametric activities in normoxic and partially ischemic rats. Comp Biochem Physiol Part A Mol Integr Physiol 132(1): 239-246.
- Mayevsky A, Walden R, Pewzner E, Deutsch A, Heldenberg E, et al. (2011) Mitochondrial function and tissue vitality: bench-to-bedside real-time optical monitoring system. J Biomed Optics 16(067004): 067001-067021.
- Mayevsky A, Manor T, Meilin S, Doron A, Ouaknine GE (1998) Real-time multiparametric monitoring of the injured human cerebral cortex - a new approach. Acta Neurochir Suppl 71: 78-81.
- Rogatsky GG, Mayevsky A, Zarchin N, Doron A (1996) Continuous multiparametric monitoring of brain activities following fluid-percussion injury in rats: Preliminary results. J Basic Clin Physiol Pharmacol 7(1): 23-43.
- Barbiro Michaely E, Mayevsky A (2001) Multiparametric monitoring of brain under elevated intracranial pressure in a rat model. J Neurotrauma 18(7): 711-725.
- Kanner AA, Rappaport ZH, Manor T, Mayevsky A (2002) Multiparametric monitoring of rat brain retraction. Proc SPIE 4623: 206-213.
- Manor T, Rogatsky G, Zarchin N, Mayevsky A (2003) Effects of fluid percussion injury on rat brain hemodynamics, ionic, electrical activity, and energy metabolism In Vivo. Adv Exp Med Biol 510: 409-414.
- Rogatsky GG, Sonn J, Kamenir Y, Zarchin N, Mayevsky A (2003) Relationship between intracranial pressure and cortical spreading depression following fluid percussion brain injury in rats. J Neurotrauma 20(12): 1315-1325.
- Barbiro Michaely E, Mayevsky A (2003) Effects of elevated ICP on brain function: Can the multiparametric monitoring system can detect the "Cushing Response"? Neurol Res 25(1): 42-52.
- Rogatsky GG, Kamenir Y, Mayevsky A (2005) Effect of hyperbaric oxygenation on intracranial pressure elevation rate in rats during the early phase of severe traumatic brain injury. Brain Res 1047(20): 131-136.
- Barbiro Michaely E, Mayevsky A, Knoller N, Hadani M (2005) In Vivo multiparametric monitoring of brain functions under intracranial hypertension following mannitol administration. Neurol Res 27(1): 88-93.
- Barbiro Michaely E, Bachbut G, Mayevsky A (2008) Effects of compression injury on brain mitochondrial and tissue viability evaluated by a multiparametric monitoring system. in Biomedical Optics (BiOS) (Vo-Dinh T, Grundfest WS, Benaron DA and Cohn GE eds.), Proceedings of the SPIE 6848: 68480M.
- Manor T, Barbiro Michaely E, Rogatsky G, Mayevsky A (2008) Real-time multi-site multi-parametric monitoring of rat brain subjected to traumatic brain injury. Neurol Res 30(10): 1075-1083.
- Barbiro Michaely E, Arnon H, Mayevsky A (2008) Evaluation of mitochondrial NADH and brain functions during retraction using a multiparametric monitoring system. in Photonics and Optoelectronics Meetings (Luo Q, Wang LV, and Tuchin VV eds.), Proceedings of the SPIE 7280: 72801I.
- Barbiro Michaely E, Manor T, Rogatsky G, Mayevsaky A (2011) How does anesthesia affect various levels of experimental traumatic brain injury? Journal of Innovative Optical Health Sciences 4(4): 409-420.
- Mandelbaum MM, Barbiro Michaely E, Tolmasov M, Mayevsky A (2008) Effects of severe hemorrhage on In Vivo brain and small intestine mitochondrial NADH and microcirculatory blood flow. J Innov Opt Health Sci 1(2): 177-183.
- Breuer Z, Mayevsky A (1992) Brain vasculature and mitochondrial responses to ischemia in Gerbils: II. Strain differences and statistical evaluation. Brain Res 598(1-2): 251-256.
- Chance B, Barlow C, Nakase Y, Takeda H, Mayevsky A, et al. (1978) Heterogeneity of oxygen delivery in normoxic and hypoxic states: a fluorometer study. Am J Physiol 235(6): H809-H820.
- Chance B, Silberstein BR, Mayevsky A (1980) Heterogeneity of metabolic states of the cerebral cortex In Vivo. Passoneau JV, Hawkins RA, Lust WD, Welsh FA (ed.). Williams & Wilkins, London. pp. 77-84.
- Crowe W, Mayevsky A, Mela L (1979) The dynamics of K+ leakage and recovery in cerebral ischemia. Leter A, Saba T, Mela L (ed.). Alan R Liss (New York) pp. 221-232.
- Crowe W, Mayevsky A, Mela L (1981) Ion transport and energy metabolism in brain. Neurol Res 3(2): 107-123.
- Haselgrove JC, Bashford CL, Barlow CH, Quistorff B, Chance B, et al. (1990) Time resolved 3-D recording of redox ratio during spreading depression in gerbil brain. Brain Res 506: 109-114.
- Maris M, Mayevsky A, Sevick E, Chance B (1991) Frequency domain dynamic measurements of changes of optical pathlength during spreading depression in rodent brain model. SPIE Proc 1431: 136-148.
- Mayevsky A (1977) Brain energy metabolism of the conscious rat exposed to ischemic conditions. Lewis D H (ed.). 15 Edition, (Basel) pp. 361-364.
- Mayevsky A, Ziv I, Ventura V, Levy Y (1984) Multiparametric oscillations in the rat brain In Vivo. The Institute of Measurement and Control, London.
- Mayevsky A, Chance B (1983) Multisite measurements of NADH redox state from cerebral cortex of the awake animal. Adv Exp Med Biol 159: 143-155.
- Mayevsky A (1978) Shedding light on the awake brain. Dutton PL, Leigh J, Scarpa A (eds.), 2nd Edition, Academic Press, New York, USA, pp. 1467-1476.
- Mayevsky A (1992) Interrelation between intracellular redox state and ion homeostasis in the brain in vivo. (Frank, K., and Kessler, M. Eds.), Verlasgruppe GmbH. pp 155-168.
- Mayevsky A, Nioka S, Chance B (1988) Fiber optic surface fluorometry/reflectometry and 31-p-NMR for monitoring the intracellular energy state In Vivo. Adv Exp Med Biol 222: 365-374.
- Mayevsky A, Mizawa I, Sloviter HA (1981) Surface fluorometry and electrical activity of the isolated rat brain perfused with artificial blood. Neurol Res 3(1): 307-316.
- Mayevsky A, Zarchin N, Sonn J (1993) Brain redox state and O2 balance in experimental spreading depression and ischemia. Lehmenkuhler A, Grotemeyer KH, Tegtmeier F (Eds.), Urban & Schwarzenberg, Munchen Wier, Baltimore pp. 379-393.
- Mayevsky A, Duckrow RB, Yoles E, Zarchin N, Kanshansky D (1990) Brain mitochondrial redox state, tissue hemodynamic and extracellular ion responses to four-vessel occlusion and spreading depression in the rat. Neurol Res 12(4): 243-248.
- Mayevsky A, Crowe W, Mela L (1980) The interrelation between brain oxidative metabolism and extracellular potassium in the unanesthetized gerbil. Neurol Res 1(3): 213-226.
- Mayevsky A, Cohen S (1990) Brain ischemic depolarization and vasospasm in the Mongolian gerbil: The dependence on energy depletion levels. Adv Exp Med Biol 277: 315-322.
- Mayevsky A (1983) Metabolic, ionic and electrical responses to experimental epilepsy in the awake rat. in Proc. First Internat. Cong. Cerebral Blood Flow, Metabolism & Epilepsy. Baldy M, Moulinier DH, Ingvar DH, Meldrum BS (ed.). John Libbey pp. 263-270.
- Mayevsky A, Zarchin N (1981) The effects of unilateral carotid occlusion on the responses to decapitation in the gerbil brain. Brain Res 206(1): 155-160.
- Mayevsky A, Zarchin N (1988) Microcirculatory and ionic events during and after incomplete or complete cerebral ischemia in the Mongolian gerbil. Tomita M, Sawada T, Naritomi H, Heiss WD (ed.), Excerpta Medica Pp. 157-169.
- Mayevsky A, Zarchin N, Friedli CM (1982) Factors affecting the oxygen balance in the awake cerebral cortex exposed to spreading depression. Brain Res 236(1): 93-105.
- Mayevsky A, Breuer Z (1990) The Mongolian gerbil as a model for cerebral ischemia. Schurr A, Rigor B M (eds.), CRC Press pp. 27-46.
- Mayevsky A, Ziv I (1991) Oscillations of cortical oxidative metabolism and microcirculation in the ischaemic brain. Neurol Res 13(1): 39-47.
- Mayevsky A, Lebourdais S, Chance B (1980) The interrelation between brain PO2 and NADH oxidation- reduction state in the gerbil. J Neurosci Res 5(3): 173-182.
- Mayevsky A, Frank KH, Nioka S, Kessler M, Chance B (1990) Oxygen supply and brain function In Vivo: a multiparametric monitoring approach in the Mongolian gerbil. Adv Exp Med Biol 277: 303-313.
- Mayevsky A, Breuer Z (1992) Brain vasculature and mitochondrial responses to ischemia in gerbils. I. Basic anatomical patterns and biochemical correlates. Brain Res 598(1-2): 242-250.
- Mayevsky A, Bar Sagie D (1978) The interrelation between CBF, energy metabolism and ECoG in a new awake brain model. Adv Exp Med Biol 94: 761-767.
- Mayevsky A (1993) Biochemical and physiological activities of the brain as In Vivo markers of brain pathology in Cerebral Revascularization. Bernstein, et al. (Eds.) Med-Orion Pub pp.51-69.
- Mayevsky A, Zarchin N, Tannenbaum B (1984) Brain responses to experimental oxygen deficiency in the Mongolian gerbil. Adv Exp Med Biol180, 191-202
- Mayevsky A (1990) Level of ischemia and brain functions in the Mongolian gerbil In Vivo. Brain Res 524: 1-9
- Mayevsky A (1988) Microcirculatory and ionic responses to ischemia in the Mongolian gerbil. Manabe H, [Eds.] Springer-Verlag. Pp.273-276.
- Mayevsky A (1978) Pyridine nucleotide oxidation reduction state of the cerebral cortex in the awake gerbil. J Neurosci Res 3: 369-374.
- Mayevsky A (1976) Brain energy metabolism of the conscious rat exposed to various physiological and pathological situations. Brain Res 113(2): 327-338.
- Rampil IJ, Litt L, Mayevsky A (1992) Correlated, simultaneous, multiple-wavelength optical monitoring In Vivo of localized cerebrocortical NADH and brain microvessel hemoglobin oxygen saturation. J Clin Monit 8(3): 216-225.
- Silberstein B R Mayevsky A Chance B (1978) Metabolic responses of the gerbil brain cortex to anoxia, spreading depression, carotid occlusion and stroke. Dutton PL, et al. [Eds.] (11th Edition) Academic Press, New York, USA.
- Cohen S Mayevsky A (1989) Effects of nimodipine on the responses to cerebral ischemia in the Mongolian gerbil. Adv Exp Med Biol 248: 429-438.
- Ligeti L, Kovach AGB, Mayevsky A, Ruttner Z, Mc Laughlin AC, et al. (1997) Can the indo-1 fluorescence approach measure brain intracellular calcium In Vivo? Amultiparametric study of cerebrocortical anoxia and ischemia. Cell Calcium 21(2): 115-124.
- Mayevsky A, Zarchin N, Kaplan H, Haveri J, Haselgrove J, et al. (1983) Brain metabolic responses to ischemia in the Mongolian gerbil: In Vivo and freeze trapped redox state scanning. Brain Res 276: 95-107.
- Mayevsky A, Yoles E, Zarchin N, Kaushansky D (1990) Brain vascular ionic and metabolic responses to ischemia in the Mongolian gerbil. J Basic Clin Physiol Pharmacol. 1(1-4): 207-220.
- Mayevsky A, Zarchin N (1987) Metabolic ionic and electrical activities during and after incomplete or complete cerebral ischemia in the Mongolian gerbil. Adv Exp Med Biol 215: 265-273.
- Mayevsky A, Doron A, Meilin S, Manor T, Ornstein E, et al. (1999) Brain viability and function analyzer: multiparametric real-time monitoring in neurosurgical patients. Acta Neurochir. Suppl 75: 63-66.
- Meilin S, Zarchin N, Mayevsky A (1999) Inter-relation between hemodynamic, metabolic, ionic and electrical activities during ischemia and reperfusion in the gerbil brain. Neurol Res 21(7): 699-704.
- Meilin S, Mendelman A, Sonn J, Manor T, Zarchin N, et al. (1999) Metabolic and hemodynamic oscillations monitored optically in the brain exposed to various pathological states. Adv Exp Med Biol 471: 141-146.
- Zarchin N, Guggenheimer-Furman E, Meilin S, Ornstein E, Mayevsky A, et al. (1998) Thiopental induced cerebral protection during ischemia in gerbils. Brain Res 780(2): 230-236.
- Mayevsky A, Sonn J, Manor T, Razon N, Ouaknine GE (2000) Responses to cortical spreading depression during normoxia and ischemia: multiparametric monitoring study in animals and the human brain. Fukuuchi, et al. [Eds.), Springer, Keio university symposia for life science and medicine 6.
- Sonn J, Mayevsky A (2000) Effects of brain oxygenation on metabolic, hemodynamic, ionic and electrical responses to spreading depression in the rat. Brain Res 882(1-2): 212-216.
- Mayevsky A, Kraut A, Manor T, Sonn J, Zurovsky Y, et al. (2001) Optical monitoring of tissue viability using reflected spectroscopy In Vivo. Proceeding of SPIE 4241: 409-417.
- Mayevsky A, Manor T, Pevzner E, Deutsch A, Etziony R, et al. (2002) Real-time optical monitoring of tissue vitality In Vivo. Proceeding of SPIE 4616: 30-39.
- Zarchin N, Meilin S, Rifkind J, Mayevsky A (2002) Effect of aging on brain energy-metabolism. Comp Biochem Physiol A Mol Integr Physiol 132(1): 117-120.
- Mayevsky A, Ornstein E, Meilin S, Razon N, Ouaknine GE, et al. (2002) The evaluation of brain CBF and mitochondrial function by a fiber optic tissue spectroscope in neurosurgical patients. Acta Neurochir Suppl 81: 367-371.
- Deutsch A, Pevzner E, Jaronkin A, Mayevsky A (2004) Real time evaluation of tissue vitality by monitoring of microcircultory blood flow, HbO2 and mitochondrial NADH redox state. SPIE Proceedings 5317: 116-127.
- Kraut A, Barbiro Michaely E, Zurovsk Y, Mayevsky A (2003) Multiorgan monitoring of hemodynamic and mitochondrial responses to anoxia and cardiac arrest in the rat. Adv Exp Med Biol 510: 299-304.
- Rogatsky G, Mayevsky A, Shifrin EG (1996) Hyperbaric oxygenation as treatment of acute ischaemic stroke: future perspectives. in Cerebrovascular ischaemia investigation and management. Caplan, et al. [Eds.] Med-Orion, London. Pp.293-306.
- Simonovich M, Barbiro-Michaely E, Salame K, Mayevsky A (2003) A new approach to monitor spinal cord vitality in real time. Adv Exp Med Biol 540: 125-132.
- Mayevsky A, Barbiro-Micahely E, Kutai-Asis H, Deutsch A, Jaronkin A, et al. (2004) Brain physiological state evaluated by real time multiparametric tissue spectroscopy In Vivo. Proc SPIE 5326: 98-105.
- Zarchin N, Meilin S, Mendelman A, Mayevsky A (2003) Age-related alteration of brain function during cerebral ischemia. Adv Exp Med Biol 540: 109-115.
- Barbiro-Michaely E, Zuckerman T, Zarchin N, Rinkevich S, Knoller N, et al. (2003) In Vivo simultaneous cortical and intracortical monitoring of cerebral blood flow and mitochondrial NADH redox state in experimental animals. Proc SPIE 4955: 22-30.
- Mayevsky A, Barbiro-Michaely E, Ligeti L, Mac Laughlin AC (2002) Effects of euthanasia on brain physiological activities monitored in real-time. Neurol. Res. 24(7): 647-651.
- Mayevsky A, Rogatsky GG, Sonn J (2000) New multiparametric monitoring approach for real-time evaluation of drug tissue interaction In Vivo. Drug Devel Res 50: 457-470.
- Yoles E, Zarchin N, Zurovsky Y, Mayevsky A (2000) Metabolic and ionic responses to global brain ischemia in the newborn dog In Vivo: II. Post-natal age aspects. Neurol Res 22(6): 623-629.
- Mayevsky A, Nioka S, Wang DJ, Chance B (1997) The functioning gerbil brain In Vivo. Correlation between 31P NMR spectroscopy and the multiparametric monitoring approach. Adv Exp Med Biol 411: 41-53.
- Mayevsky A, Deutsch A, Dekel N, Pevzner E, Jaronkin A, et al. (2005) A new biomedical device for In Vivo multiparametric evaluation of tissue vitality in critical care medicine. Proc SPIE 5692: 60-70.
- Mayevsky A, Blum Y, Dekel N, Deutsch A, Halfon R, et al. (2006) The CritiView - A new fiber optic based optical device for the assessment of tissue vitality. Proc. SPIE 6083: 0Z-1-0Z-9.
- Krakovsky M, Rogatsky G, Zarchin N, Mayevsky A, (1998) Effect of hyperbaric oxygen therapy on survival after global cerebral ischemia in rats. Surgical Neurology 49(4): 412-416.
- Yoles E, Zorovsky Y, Zarchin N, Mayevsky A (2000) Brain metabolic and ionic responses to global brain ischemia in the newborn dog In Vivo: 1. Methodological aspects. Neurolog Res 22(5): 505-511.
- Mayevsky A, Sherman E, Cohen-Kashi M, Dekel N, Pewzner E (2007) Optical assessment of intravascular and intracellular parameters related to tissue viability. Biomedical Optics (BiOS) Vo-Dinh T, et al. [Eds.] International Society for Optics and Photonics.
- Mayevsky A, Dekel N, Oren L, Deutsch A, Pewzner E (2008) Mitochondrial dysfunction: bench-to-bedside optical monitoring of tissue vitality. in Biomedical Optics (BiOS) Mahadevan-Jansen A, et al. [Eds.] International Society for Optics and Photonics. pp 68531B-68511.
- Livnat A, Barbiro-Michaely, E Tolmasov, M Mayevsky A (2008) Real-time monitoring of mitochondrial function and cerebral blood flow follwing focal ischemia in rats. Journal of Innovative Optical Health Sciences 1: 63-69.
- Mayevsky A, Sonn J, Barbiro-Michaely E (2008) Mitochondrial function and physiological activities of the brain exposed to hypoxia and ischemia. in Brain Hypoxia Ischemia Research Progress Roux et al. [Eds.] Nova Science Publishers Inc Hauppauge NY pp 83-111.
- Simonovich M, Barbiro-Michaely E, Mayevsky A (2008) Real-time monitoring of mitochondrial NADH and microcirculatory blood flow in the spinal cord. Spine (Phila Pa 1976) 33(23): 2495-2502.
- Eibeshitz E, Barbiro-Michaely E, Mayevsky A (2008) The role of nitric oxide in the ischemic brain evaluated by spectroscopic monitoring of mitochondrial NADH, microcirculatory blood flow, and HbO. in Photonics and Optoelectronics Meetings Luo Q, et al. [Eds.], International Society for Optics and Photonics.
- Kutai-Asis H, Kanter I, Barbiro-Michaely E, Mayevsky A (2008) Classification of tissue pathological state using optical multiparametric monitoring approach. in Photonics and Optoelectronics Meetings Luo Q, et al. [Eds.], International Society for Optics and Photonics. pp 72801K-72801K-72807.
- Livnat A, Barbiro-Michaely E, Mayevsaky A (2009) Mitochondrial function and cerebral blood flow responses under unilateral carotid occlusion in rats. in SPIE BiOS: Biomedical Optics Mahadevan-Jansen, et al. [Eds.], International Society for Optics and Photonics.
- Wang M, Agarwal S, Mayevsky A, Joshi S (2011) Optically measured NADH concentrations are unaffected by propofol induced EEG silence during transient cerebral hypoperfusion in anesthetized rabbits. Brain Res 1396: 69-76
- Sonn J, Mayevsky A (2012) Responses to cortical spreading depression under oxygen deficiency. Open Neurol J 6: 6-17.
- Shi H, Sun N, Mayevsky A, Zhang Z, Luo Q (2014) Preclinical evidence of mitochondrial nicotinamide adenine dinucleotide as an effective alarm parameter under hypoxia. J Biomed Optics 19(1): 17005.
- Joshi S, Moon RS, Wang M, Bruce JN, Bigio IJ, et al. (2014) Real-time hemodynamic response and mitochondrial function changes with intracarotid mannitol injection. Brain Res 1549: 42-51.
- Hua S, Sun N, Mayevsky A, Zhang H, Luo Q (2014) Early identification of acute hypoxia based on NADH fluorescence and cerebral blood flow. J Innovative Optical Health Sci 7(2): 1450033.
- Mayevsky A, Subramanian VH, Nioka S, Barlow C, Haselgrove J, et al. (1985) Brain energy metabolism evaluated simultaneously in the newborn dog by 31P NMR spectroscopy and NADH fluorometry/reflectometry In Vivo. J CBF Metab 7: 400-401.
- Mayevsky A, Nioka S, Subramanian VH, Chance B (1988) Brain oxidative metabolism of the newborn dog: Correlation between 31P NMR spectroscopy and pyridine nucleotides redox state. J CBF Metab 8(2): 201-207.
- Mayevsky A, Yoles E, Zarchin N (1986) Metabolic, ionic and electrical responses to oxygen deficiency in the newborn dog In Vivo. Adv Exp Med Biol 200: 261-269.
- Mayevsky A, Nioka S, Subramanian VH, Chance B (1987) Microcirculatory responses to brain hypoxia in the newborn dog as evaluated by P-NMR spectroscopy and NADH fluorometry/reflectometry In Vivo. in Microcirculation - an update. Tsuchiya M, Asano M, Mishima Y, Oda M (ed.). 2 edition, Excerpta Medica. pp.49-50.
- Segal M, Sagie DB, Mayevsky A (1980) Metabolic changes induced in rat hippocampal slices by norepinephrine. Brain Res 202(2): 387-399.
- Yoles E, Zarchin N, Mayevsky A (1991) Effects of age on brain metabolic ionic and electrical responses to anoxia in the newborn dog In Vivo. J Basic Clin Physiol Pharmacol 2(4): 297-313.
- Tolmasov M, Michaely EB, Mayevsky A (2007) Simultaneously multiparametric spectroscopic monitoring of tissue viability in the brain and small intestine. Optical Tomography Spectroscopy of Tissue VII 6434: 4341-4341.
- Meirovithz E, Sonn J, Mayevsky A (2007) Effect of hyperbaric oxygenation on brain hemodynamics, hemoglobin oxygenation and mitochondrial NADH. Brain Res Rev 54(2): 294-304.
- Michaely EB, Tolmasov M, Shop SR, Sonn J, Mayevsky A (2007) Can the "brain-sparing effect" be detected in a small-animal model? Med Sci Monit 13(10): 211-219.
- Mayevsky A (1978) The responses of an awake brain to HPO under increased CO2 Adv Exp Med Biol 92: 735-739.
- Mayevsky A, Manor T, Meilin S, Razon N, Ouaknine GE, et al. (2001) Multiparametric monitoring of tissue vitality in clinical situations. Proc SPIE 4255: 33-39.
- Sonn J, Mayevsky A (2001) The effect of ethanol on metabolic, hemodynamic and electrical responses to cortical spreading depression. Brain Res 908(2): 174-186
- Kraut A, Michaely EB, Mayevsky A (2004) Differential effects of norepinephrine on brain and other less vital organs detected by a multisite multiparametric monitoring system. Med Sci Monit 10(7): 215-220.
- Sonn J, Mayevsky A (2006) Effects of anaesthesia on the responses to cortical spreading depression in the rat brain In Vivo. Neurol Res 28(2): 206-219.
- Rifkind JM, Nagababu E, Michaely B, Ramasamy SE, Pluta RM, et al. (2007) Nitrite infusion increases cerebral blood flow and decreases mean arterial blood pressure in rats: A role for red cell NO. Nitric Oxide 16(4): 448-456.
- Tolmasov M, Michaely EB, Mayevsky A (2009) The involvement of nitric oxide in the hemodynamic and metabolic activities of the brain and small intestine. SPIE BiOS: Biomedical Optics (Jansen AM, Dinh TV, Grundfest WS (ed.). International Society for Optics and Photonics. San Jose, California, USA.
- Meilin S, Zarchin N, Mayevsky A, Shapira S (1995) Multiparametric responses to cortical spreading depression under nitric oxide synthesis inhibition. Biochemical Pharmacological and Clinical Aspects of Nitric Oxide. Weissman BA, Alon N, Shapira S (ed.). Plenum Press, New York. pp.195-204.
- Meilin S, Rogatsky GG, Thom SR, Zarchin N, Furman EG, et al. (1996) Effects of carbon monoxide exposure on the brain may be mediated by nitric oxide. J Appl Physiol 81(3): 1078-1083.
- Mayevsky A, Rogatsky GG, Zarchin N, Thom SR (1993) Interrelation between hyperbaric oxygenation and carbon monoxide intoxication in the rat brain In Vivo. Bennett PB, Marquis RE (ed.). University of Rochester Press, New York, USA. pp.409-420.
- Meilin S, Sonn J, Zarchin N, Rogatsky G, Furman EG, et al. (1998) Responses of rat brain to induced spreading depression following exposure to carbon monoxide. Brain Res 780(2): 323-328.
- Rogatsky GG, Meilin S, Zarchin N, Thom SR, Mayevsky A (2002) Hyperbaric oxygenation affects rat brain function after carbon monoxide exposure. Undersea Hyperb Med 29(1): 50-58.
- Mendelman A, Zarchin N, Meilin S, Furman EG, Thom SR, et al. (2002) Blood flow and ionic responses in the awake brain due to carbon monoxide. Neurol Res 24(8): 765-772.
- Mendelman A, Zarchin N, Rifkind J, Mayevsky A (2000) Brain multiparametric responses to carbon monoxide exposure in the aging rat. Brain Res 867(1-2): 217-222.
- Mayevsky A, Meilin S, Manor T, Ornstein E, Zarchin N, et al. (1998) Multiparametric monitoring of brain oxygen balance under experimental and clinical conditions. Neurol Res 20: 76-80.
- Mayevsky A, Manor T, Sonn J (2000) Multiparametric real-time monitoring of tissue vitality in medical diagnostics and treatment. 10th International Conference on Biomedical Engineering, National University of Singapore, Singapore. pp.371-372.
- Mayevsky A, Jamieson D, Chance B (1974) Oxygen poisoning in the unanesthetized brain: correlation of the oxidation-reduction state of pyridine nucleotide with electrical activity. Brain Res 76(3): 481-491.
- Mayevsky A, Kuhl KW, Mela L (1980) High pressure oxygenation in unanesthetized brain: Mitochondrial activity, pyridine nucleotide redox state, and electrical activity. Neurol Res 1(4): 305-311.
- Mayevsky A (1984) Brain oxygen toxicity. Invited Review. Bachrach AJ, Matzen MM (ed.). Undersea Medical Society, Bethesda, Maryland. pp.69-89.
- Yoles E, Zurovsky Y, Zarchin N, Mayevsky A (2000) The effect of hyperbaric hyperoxia on brain function in the newborn dog In Vivo. Neurol Res 22(4): 404-408.
- Sonn J, Meirovithz E, Mayrvsky A (2008) Hyperbaric hyperoxia and the brain In Vivo: the balance between therapy and toxicity. J Innov Optical Health Sci 1(2): 185-193.
- Zarchin N, Meilin S, Rifkind AJ, Mayevsky A (1999) Hemodynamic, metabolic, ionic, and electrical responses to cortical spreading depression in aging rats. Adv Exp Med Biol 471: 223-230.
- Mayevsky A, Weiss HR (1991) Cerebral blood flow and oxygen consumption in cortical spreading depression. J CBF Metab 11(5): 829-836.



 We use cookies to ensure you get the best experience on our website.