Mini Review 
![]() Creative Commons, CC-BY
Creative Commons, CC-BY
Relation of a Pulse Transit Time to the Blood Pressure in Bifurcated Cardiovascular Networks
*Corresponding author: Alexander S Liberson, Department of Microsystems Engineering, Rochester Institute of Technology, 76 Lomb Memorial Drive, Rochester, NY 14623-5604, USA.
Received: January 06, 2020; Published: February 06, 2020
DOI: 10.34297/AJBSR.2020.07.001135
Abstract
Recent developments in cardiovascular mathematics allow to simulate blood flow in the entire circulatory network or any isolated cardiovascular subsystem. Providing measurements of a Pulse Transit Time (PTT), or the averaged value for the Pulse Wave Velocity (PWV), the patient specific computational model can create personalized transfer functions, converting distal measurements to the set of cardiovascular biomarkers. The latter has a potential to build the feasible foundation for the personalized continuous self-monitoring of cardiovascular health based on portable mobile and wearable applications. Nevertheless, although being of a great interest, an accurate and reliable PTT-based Blood Pressure (BP) estimation barely exists nowadays due to the complexity of a BP regulation in a human body.
In this paper we concentrate on a physics based computational modelling to assess interconnections of a PTT to BP in a bifurcated circulatory network. The PWV is interpreted as the speed of propagation along the forward running characteristic in a related hyperbolic Fluid Structure Interaction (FSI) differential problem. PTT is calculated by integrating the reciprocal of instantaneous PWV along the characteristic line. The Y.C. Fung’s exponential model is applied to describe mechanics of a thin and a thick-walled vessel, subject to the infinitesimally small or finite hyperelastic deformation. Recently published PTT and PWV based non-invasive and continuous BP monitoring methods are reviewed and analyzed.
Keywords: Pulse transit time, Physical modelling, Nonlinear models, Cardiovascular markers
Introduction
Pulse Arrival Time (PAT) is the generally established empirical marker for continuous non-intrusive blood pressure monitoring, which is defined as a time required for a pulse wave to travel from the heart to a peripheral site. A popular estimate of PAT is the timebased delay between R wave peak of Electrocardiogram (ECG) and a characteristic point of a Photoplethysmogram (PPG). PAT consists of two components: the non-constant Pre-Ejection Period (PEP), which is a duration of the ventricle contraction up to aortic valve opening, and the Pulse Transit Time (PTT), which defines the period for the arterial pulse wave to travel from the aortic valve to the peripheral site.

A simple measurement setup consisting of arm Electrocardiogram (ECG) and Peripheral Site Photoplethysmogram (PPG) allows to assess PAT as the time delay between ECG R peak and one of the optional points in the PPG waveform: peak, foot, maximum values of the slope, or the second derivative of PPG waveform. PEP can be derived noninvasively using for instance thoracic Impedance Plethysmogram (IPG) as described in [1, 2, 3]. Estimation of a systolic and diastolic BP is based on equivalence of the measured and model- based prediction of PTT. In general, prediction methods can be categorized into data-driven, physics-based and hybrid approaches. Data-driven approaches investigate relationship between BP and PTT through the linear or nonlinear regression analysis, employing a simple set of basic functions, or using artificial intelligence (neural network). Physics-based approaches assume that a reliable physical model describing connection of a PTT to BP is available. Hybrid approaches combines the methods to calibrate the personalized bio-physical properties, improving prediction.
As follows from the physical modelling, PTT and PWV are mainly affected by four factors: arterial compliance, cardiac output, peripheral resistance, and a blood pressure. Most data driven approaches select the only single parameter as an independent variable, which is a PTT or the averaged PWV, to predict systolic and diastolic blood pressures. The physics-based approach automatically accounts for the full set of factors affected BP according to the physical model, i.e. cardiac output, stroke volume, vascular compliance, peripheral resistance. The following sections describe PTT based blood pressure estimation according to the classification. Since many of the papers using data driven regression analysis are listed in several reviews, we will not cite relating individual papers, focusing mainly on a physical modeling as a foundation for linking PTT to systolic and diastolic BP.
Data-Driven BP Estimation
Multiple linear and nonlinear regressions have been explored
by different authors using combinations of exponential, power,
logarithm, polynomial and logistics functions to fit the experimental
dataset of PTT (or PWV) vs BP [3, 4, 5]. In [6] the heart rate as a
second independent variable in addition to PTT is introduced in a
linear regression, which according to the authors improves the accuracy
of BP prediction. In the monograph [7] the Young’s modulus is presented as an exponential function of pressure,  where
E0- is the Yong modulus at zero pressure, and α -empirical
coefficient. As a result, the formal substitute of the modified
elastic modulus E into the Moens-Korteweg expression for the
PWV results in a pulse wave velocity dependent on a blood pressure,
where
E0- is the Yong modulus at zero pressure, and α -empirical
coefficient. As a result, the formal substitute of the modified
elastic modulus E into the Moens-Korteweg expression for the
PWV results in a pulse wave velocity dependent on a blood pressure,  is the Moens-Korteweg speed of
propagation at zero pressure, α-is a calibrating constant.
is the Moens-Korteweg speed of
propagation at zero pressure, α-is a calibrating constant.
The mentioned approach is completely empirical, since it does not fit the paradigm of classical mechanics, which specifies physical nonlinearity by appropriate constitutive equations in terms of stress – strain components. The described expression cannot be derived from the fluid-structure interaction model using any constitutive equations. It could be converted to the linear regression (in a log scale) by application of logarithm to the expression for PWV, which results in
where  is the distance of a pulse propagation, a,
b-are determined from the best fit procedure. Equation (2) remains
nowadays a one of the most widely used technique for noninvasive
continuous BP monitoring. The modified logarithm-based regression
was successfully applied in [8] to monitor BP as a function of
PTT under the effect of hydrostatic pressure due to hand elevations.
The effect of including PEP in BP estimation is under investigation
in different papers based on empirical regression analysis over different
cohorts of human subjects [4, 9, 10]. The simplest approach is
an attempt to estimate PEP as a percentage of the RR interval, with
the following subtraction from PAT to obtain PTT [11]. There is still
a controversial evidence from different authors regarding effect of PEP on BP. The impact of PEP on the overall PAT decreases with distance
from the heart, so that for the short PATs, like ones extracted
from the ear-worn device, correction with PEP is required.
is the distance of a pulse propagation, a,
b-are determined from the best fit procedure. Equation (2) remains
nowadays a one of the most widely used technique for noninvasive
continuous BP monitoring. The modified logarithm-based regression
was successfully applied in [8] to monitor BP as a function of
PTT under the effect of hydrostatic pressure due to hand elevations.
The effect of including PEP in BP estimation is under investigation
in different papers based on empirical regression analysis over different
cohorts of human subjects [4, 9, 10]. The simplest approach is
an attempt to estimate PEP as a percentage of the RR interval, with
the following subtraction from PAT to obtain PTT [11]. There is still
a controversial evidence from different authors regarding effect of PEP on BP. The impact of PEP on the overall PAT decreases with distance
from the heart, so that for the short PATs, like ones extracted
from the ear-worn device, correction with PEP is required.
Neural Network (NN) modeling has recently been in place predicting BP as a function of a set of measured parameters. In [12] a total of 17 parameters were selected as the set of independent variables being chosen as characteristic feature points from ESG and PPG signals. Two different neural networks have been used to predict separately brachial systolic and diastolic blood pressures as functions of ECG and PPG measurements. The maximum error range in the brachial BP prediction is reported in terms of a root mean square error RMSE=±5.2mmHg. In [13] the SVR (Support Vector Machine Regression) algorithm is applied to establish relationship between human physiological data and systolic and diastolic BPs. The different number of main physiological indexes, obtained from ECG and PPG, include PTT, HR, SPO2 and others, are explored in application of NN modeling. The maximum error range of a brachial BP prediction is reported as ±10mmHg.
Few studies managed to compare different noninvasive BP estimations in a wide physiological BP range. None of data driven approaches proved to be ubiquitous, being able to monitor with a reasonable accuracy the only single feature of a BP, either systolic, or diastolic or a mean [3, 4, 5].
Physical Modeling BP Estimation
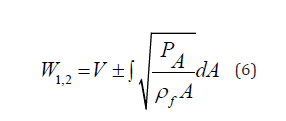
In this section, we assess physics-based models’ capabilities to predict systolic and diastolic BP as a function of model required independent parameters. Considering an arbitrary pressure-area connection, P = P(A) ,we present system of conservation laws in the following non-conservative quasi-linear form
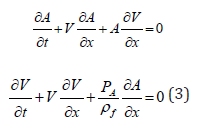
where 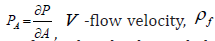 fluid density. This system
could be transformed to the decoupled system of equations for the
characteristic variables (Riemann variables), which read
fluid density. This system
could be transformed to the decoupled system of equations for the
characteristic variables (Riemann variables), which read
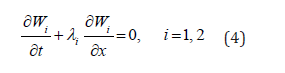
Relating characteristic directions (eigenvalues) read
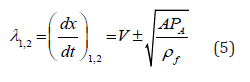
and forward and backward running characteristics can be found accordingly
Since the slope of a forward running characteristic line is determined
by PWV = 
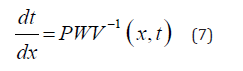
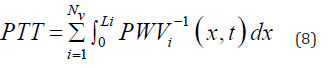
Equation (7) serves to calculate the PTT required for the pulse
wave to propagate through the Nv vessels, each of the length  along the flow pathway from the left ventricle to the peripheral
site.
along the flow pathway from the left ventricle to the peripheral
site.
Nonlinear Vs Linear Models
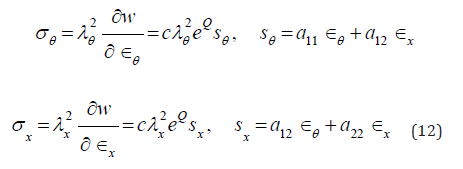
In this section three type of nonlinear models are reviewed following the papers [14, 15]: the infinitesimally Small Deformation Linear Elasticity Model (SDL), Small Deformation Hyperplastic Model (SDH) and Finite Deformation hyper elastic Model (FDH). The Fung’s exponential descriptor for passive behavior of arteries [16] presents strain energy density function for the pseudo elastic wall deformation in a form
Here 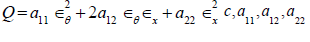 are material
constants,
are material
constants, 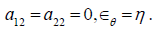 are the circumferential and axial strain components.
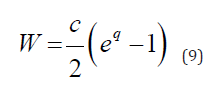
In a 1D problem strain energy of the wall can be simplified
by setting Equilibrium condition results in a generalized tube law for the hyperelastic wall
are the circumferential and axial strain components.
In a 1D problem strain energy of the wall can be simplified
by setting Equilibrium condition results in a generalized tube law for the hyperelastic wall  the
Moens-Korteweg speed at
the
Moens-Korteweg speed at 
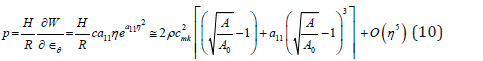
Equations (10) and (6) present the instantaneous PWV for the SDH model in a compliant hyperelastic artery as the following
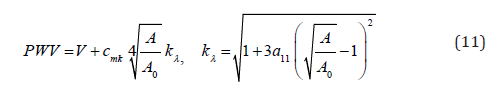
Model SDL is achieved by setting hyperelastic material coefficient
to zero so that the expressions for PWV in model 2 follows from (10) at 
Model FDH, which considers finite deformation, is derived
based on the same expression for strain energy (8), where  and
and  is interpreted as the Green-Lagrange strain components in circumferential
and axial directions accordingly. Relating Cauchy stress components.
is interpreted as the Green-Lagrange strain components in circumferential
and axial directions accordingly. Relating Cauchy stress components.
are governed by equilibrium conditions
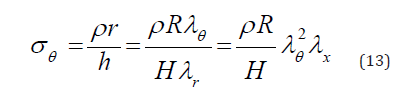
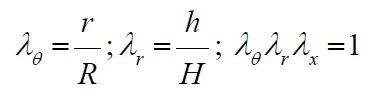
Here:  are the stretch ratios in circumferential, radial and axial directions accordingly; r, h-are the luminal radius and thickness in a deformed state,
All three models have been tested against Histand and Anliker results on a PWV measurements presented in [17, 18] and reproduced in (Figure 1) by square markers. The experimental curve notably exhibits curvature starting from elevated level of pressure exceeding 140mmHg. Material parameters have been identified for each model independently, based on a best fit procedure. The Finite Deformation Hyper Elasticity (FDH) model and Small Deformation Hyper Elasticity (SDH) model have the highest quality of fitting process, creating practically the same regression line in (Figure 1) within the physiological range of BP. The Small Deformation Model with Linear Elasticity (SDL) was not able to fit the experimental curve at the quality of FDH or SDH models.

Figure 1: The nonlinear model FDH produced the best fit of the PWV vs. transmural pressure function.

Figure 2: Simulation results show that within a physiological longitudinal pre-stress load effects PWV by ~ 3%. Tz denotes the axial physiological Lagrangian stress.
Dash lines indicate theoretical prediction. Square markers illustrate the total set of experimental points. Using the properties extracted from the nonlinear model the lower (solid) line shows the effect on PWV using the partially nonlinear model SDH, combining hyper elasticity with small deformation. To illustrate the effect of a longitudinal force on PWV the variation of PWV due to the variability of a longitudinal pre-stress force is presented in (Figure 2). According to simulation within the realistic physiological range of a longitudinal stress, the relative deviation in PWV does not exceed 3%.
Several PWV estimations presented in literature is based on its correlation with the BP and an arterial wall compliance. The study in [19]examined the impact of a systolic flow correction of a measured PWV on blood pressure prediction accuracy using data from two published in vivo studies. Both studies examined the relationship between PWV and blood pressure under pharmacological manipulation, one in mongrel dogs and the other in healthy adult males. Systolic flow correction of the measured PWV improves the R2 correlation to blood pressure from 0.51 to 0.75 for the mongrel dog study, and 0.05 to 0.70 for the human subjects’ study. The results support the hypothesis that systolic flow correction is an essential element of non-invasive, cuff-less blood pressure estimation based on PWV measures.
Thick Wall Vessels
A novel mathematical model predicting PWV propagation with rigorous account of, blood vessel elasticity, and finite deformation of multi-layer thick wall arterial segments was studied in [20]. It was found that the account for the multilayer model affects distribution of local parameters in the proximity of the external layer (adventitia) and does not affect stiffness related to the internal layer. The latter means that the single thick layer model is enough to predict PWV of an arterial segment. (Figure 3) depicts the dependence of PWV on pressure for the Systole Phase (marked as “SBP”) and a Diastole Phase (marked as “DBP”) for three vessels of different thicknesses of a human aorta. All results have been compared with the simplified thin walled model of a membrane shell interacting with an incompressible fluid.

Figure 3: Simulation results show that within a physiological longitudinal pre-stress load effects PWV by ~ 3%. Tz denotes the axial physiological Lagrangian stress.
To explore inaccuracies induced by use of the less complex thin wall model, error in both PWV and blood pressure were calculated for a blood pressure of SBP/DBP = 150/95mmHg representing the median of stage 1 hypertension. The single layer thick wall model improves PWV accuracy by (4.0-8.4%) corresponding to the relative wall thickness (H/R1) range of 0.07-0.38. One of the goals for the model is PWV based blood pressure prediction, where the thick wall model offers an improvement of (3.3-19.4%).
Calibration Free Approaches
Willemet et al. [21, 22] proposed approach to use cardiovascular simulator for generation of a database of “virtual subjects” with sizes limited only by computational resources. In their study, the databases were generated using one-dimensional model of wave propagation in an artery network comprising of 55 largest human arteries. A linear elastic model was employed to describe deformation of arterial walls. The database is created by running the cardiovascular model repeatedly. The seven model parameters were varied: elastic artery PWV, muscular artery PWV, the diameter of elastic arteries, the diameter of muscular arteries, Heart Rate (HR), SV and peripheral vascular resistance. 3325 healthy virtual subjects presented a diversity of hemodynamic, structural and geometric characteristics. For each virtual subject, all characteristics are known at every point of the systemic arterial tree, i.e. anatomical and structural properties, as well as pressure, flow, pulse wave velocity and area waves at the larger arteries, therefore allowing the computation of the exact value of the diagnostic tool.
Huttunen et al. [23] used cardiovascular modelling of the entire adult circulation to create a database of “virtual subjects”, which is applied with machine learning to construct predictors for health indices. They carry out theoretical assessment of estimating aortic pulse wave velocity, diastolic and systolic blood pressure and stroke volume using pulse transit/arrival timings derived from photoplethysmography signals. The generated database was then used as training data for Gaussian process regressors applied finally to simulation. Simulated results provide theoretical assessment of accuracy for predictions of the health indices. For instance, aortic pulse wave velocity was estimated with a high accuracy (r>0.9. Similar accuracy has been reached for diastolic blood pressure, but predictions of systolic blood pressure proved to be less accurate (r > 0.75).
Conclusion
Developed technologies in general allow to implement a PTT/ PAT-based system to predict continuously cardiovascular health markers such as arterial blood pressure, cardiac output, arterial stiffness. However, none of approaches is able so far to monitor accurately all cardiac markers for the wide range of physiological conditions. The limitations to be addressed in future are the following. First, each model must be investigated for its limitations. We believe that a calibration stage is required to build a reliable simulator within the range of investigated conditions. Also, most of the research addresses healthy population, which is characterized by different behavior of a vascular system rather than group with medical conditions. In the current review we only consider pulse transit and arrival type of time information as the input to the predictor. It would be beneficial to develop approaches that do not need reference measurement for the aortic valve opening/R-peak.
References
- Chan G, Middleton P, Celler B, Wang L, Lovell N (2007) Change in pulse transit time and pre-ejection period during head-up tilt-induced progressive central hypovolemia. J Clin Monit Comput 21(5): 283-293.
- Lanfranchi PA, Somers V (2017) Cardiovascular Physiology: Autonomic Control in Health and in Sleep Disorders. In Principles and Practice of Sleep Medicine 5th Edn, pp.226-236.
- Sharma M, Barbosa K, Ho V, Griggs D, Ghirmai T, et al. (2017) Cuff-Less and Continuous Blood Pressure Monitoring: A Methodological Review. Technologies 5(2): 21.
- Naschitz JE, Bezobchuk S, Priselac RM, Sundick S, Dreyfuss D, et al. (2004) Pulse transit time by R-wave-gated infrared photoplethysmography: Review of the literature and personal experience. J Clin Monit Comput 18(5-6): 333-342.
- Peter L, Noury N, Cerny M (2014) A review of methods for non-invasive and continuous blood pressure monitoring: Pulse transit time method is promising? IRBM 35(5): 271-282.
- Wang R, Jia W, Mao Z, Sclabassi R, Sun M (2014) Cuff-Free Blood Pressure Estimation Using Pulse Transit Time and Heart Rate. Int Conf Signal Process Proc pp.115-118.
- Geddes LA, Me P (1991) Handbook of blood pressure measurement. Humana Press Clifton, USA.
- Poon C, Zhang Y, Liu Y (2006) Modeling of Pulse Transit Time under the Effects of Hydrostatic Pressure for Cuff less Blood Pressure Measurements. Proceedings of the 3rd IEEE-EMBS International Summer School and Symposium on Medical Devices and Biosensors MIT, Boston, USA, pp.4-6.
- Ochiai R, Takeda J, Hosaka H, Sugo Y, Tanaka R, et al. (1999) The relationship between modified pulse wave transit time and cardiovascular changes in isoflurane anesthetized dogs. J Clin Monit Comput 15: 493-501.
- Solà J, Rimoldi SF, Allemann Y (2010) Ambulatory Monitoring of the Cardiovascular System: The Role of Pulse Wave Velocity. INTECH Open Access Publisher, Rijeka, Croatia, pp.391-424.
- Payne R, Symeonides C, Webb D, Maxwell S (2006) Pulse transit time measured from the ECG: An unreliable marker of beat-to-beat blood pressure. J Appl Physiol 100(1): 136-141.
- Tan X, Ji Z, Zhang Y (2018) Non-invasive continuous blood pressure measurement based on mean impact value method, BP neural network, and genetic algorithm. Technology and Health Care 26(1): 87-101.
- Zhang B, Ren H, Huang G, Cheng O, Hu C (2019) Predicting blood pressure from physiological index data using the SVR algorithm. BMC Bioinformatics 20: 109.
- Liberson AS, Lillie JS, Day SW, Borkholder DA (2016) A Physics Based Approach to the Pulse Wave Velocity Prediction in Compliant Arterial Segments. Journal of Biomechanics 49(14): 3460-3466.
- Vahedein YS, Liberson A (2019) CardioFAN: Open source platform for noninvasive assessment of pulse transit time and pulsatile flow in hyperelastic vascular networks. Biomechanics and Modeling in Mechanobiology 18: 1529-1548.
- Zhou J, Fung YC (1997) The degree of nonlinearity and anisotropy of blood vessel elasticity. Proc Natl Acad Sci 94: 14255-14260.
- Rourke MO (2011) McDonald's Blood Flow in Arteries: Theoretical, Experimental and Clinical Principles, 5th Oxford University Press, USA, pp.755.
- Pedley TJ (2008) The fluid mechanics of large blood vessels. Cambridge University Press, USA, pp.464.
- Lillie JS, Liberson AS, Borkholder DA (2016) Improved Blood Pressure Prediction Using Systolic Flow Correction of Pulse Wave Velocity. Cardiovasc Eng Technol 7(4): 439-447.
- Lillie JS, Liberson AS, Borkholder DA (2016) Quantification of Hemodynamic Pulse Wave Velocity Based on a Thick Wall Multi-Layer Model for Blood Vessels. Journal of Fluid Flow, Heat and Mass Transfer (JFFHMT) 3: 24-61.
- Willemet M, Chowienczyk P, Alastruey J (2015) A database of virtual healthy subjects to assess the accuracy of foot-to-foot pulse wave velocities for estimation of aortic stiffness. Am J Physiol Heart Circ Physiol 309(4): 663-675.
- Willemet M, Vennin S, Alastruey J (2016) Computational assessment of hemodynamics-based diagnostic tools using a database of virtual subjects: Application to three case studies. J Biomech 49: 3908-3914.
- Huttunen JMJ, Kärkkäinen L, Lindholm H (2019) Pulse transit time estimation of aortic pulse wave velocity and blood pressure using machine learning and simulated training data. PLoS Comput Biol 15(8): 1007259.


 We use cookies to ensure you get the best experience on our website.