Case Report 
![]() Creative Commons, CC-BY
Creative Commons, CC-BY
A Positive-Confidence based approach to Classifying Imbalanced data: A Case Study on Hepatitis
*Corresponding author: Vinita Jansari, Auckland University of Technology, Auckland, New Zealand.
Received: April 21, 2020;Published: May 05, 2020
DOI: 10.34297/AJBSR.2020.08.001319
Abstract
Mining Imbalanced data is a challenge especially with clinical datasets where it is essential to obtain maximum possible prediction accuracy on the minority (diseased class which is the category of greatest interest) without impacting negatively on predictions on the majority class. A false positive that wrongly signals the presence of disease has as much importance as a false negative diagnosis in such scenarios. Apart from high classification accuracy, models need to be interpretable as well in order to enhance clinician’s confidence in them. We propose a positive confidence-based modelling approach which uses data features to assign a confidence value to each sample that signifies the probability that a given data sample belongs to the positive class. We aim to predict the outcome using the minimum number of data features in order to maximize model interpretability. We use the publicly available Hepatitis dataset to test our approach and the results are promising. We obtain an F2 Score of 0.84 which is significantly higher than that obtained from widely used classifiers.
Keywords: Class-Imbalance, Minority class, Classification, Feature selection, Positive-confidence
Introduction
With advancements in the fields of Information science and Machine Learning researchers are increasingly deploying prediction methods to biomedical data to aid with the decision-making process for the domain experts. A combined approach of utilising domain knowledge from experts and the information the data provides us can assist in better decision making. There are two major issues which arise with using such models for biomedical data, namely, class imbalance and lack of transparency in models. Another major issue is Feature selection also plays an important role in the prediction process as noisy data features can confuse the model and lead to a drop-in accuracy.
Imbalanced learning is considered to be an ongoing a core research issue in Machine Learning. According to [1], the problem can be categorised as problem definition issues, data level issues or algorithm level issues. Class imbalance refers to a skewed distribution of data points in the feature space [2]. In an optimal data mining problem space, all classes will consist of the same number of samples and the classes will be linearly separable. However, in the real world such idealized scenarios occur very rarely. Often, real world data is highly skewed in terns of data distribution. Class distribution is not uniform and there are often small disjuncts in feature space, whereby samples belonging to the minority class are distributed in numerous small subsets of feature space, thus making it difficult between noise and rare/exceptional cases [3]. Some application domains, including the biological and medical areas suffer from this issue. The problem becomes more complicated when there is overlapping amongst the different classes as well. Class over-lap can cause data samples to appear as valid examples of more than one class. Generally, the class of interest is the minority class (which is the disease class) [4]. The aim of modelling such data is to be able to correctly identify the problem cases/disease class patients without miss classifying healthy people. Another issue which arises with these types of data is that the number of samples to learn from is generally small when compared to the number of data features. With a small number of examples or samples to learn from, it becomes difficult for the models to find consistent and reliable patterns in the data to use for predictions.
Miss classification cost can be high in biomedical datasets especially in terms of medical decision support systems as a miss classification is the difference between a correct or incorrect diagnosis. A higher prediction accuracy can aid in saving lives and providing better quality of life for people along with reducing costs on the health care system [1]. The imbalanced data problem can arise from small sample size, issues with the problem definition, data level issues or algorithmic level issues. The problem can be dealt with in different ways, including but not limited to sampling methods, cost-sensitive methods and kernel based methods. Sampling methods focus on artificially altering the data to create a more balanced scenario. Cost-sensitive methods assign higher miss classification costs for the minority class samples to increase the classification and prediction accuracy for the minority class. Algorithmic level solutions aim at proposing new algorithms or modifying existing algorithms to handle class imbalance by changing the classification threshold to favour minority class samples [5].
To model and mine biomedical data successfully, it is essential that the model provides information regarding the rationale behind the recommendations. Without background knowledge, domain experts struggle to establish confidence regarding these models. If the model is able to comprehend and provide some insight into the decision-making process, the model becomes more interpretable and thus more usable. Our aim is to create an interpretable model which provides better prediction accuracy for the minority class. In this paper, we propose a probability-based method to make predictions for imbalanced data. This approach uses an algorithmic method instead of using a data level solution wherein the data is artificially balanced before the model building process. Even though we do not utilize data balancing, in it can be used in conjunction with our algorithmic approach. The next section explains our model building process in brief. Thereafter we present our experimentation and discussion implications of our results on future research that could be conducted.
Materials & Methods
Our approach is inspired by [6], which aims at training a binary classifier using only the data in the positive class. The data samples are equipped with a confidence measure called positiveconfidence, which does not put emphasis on the negative or the majority class data. The positive-confidence aids the classifier to discriminate between positive and negative data. To the best of our knowledge, no other research has exploited the use of positive confidence in classification. Utilising the in-formation present in the data, we compute the probability that the sample belongs to the positive class. A positive confidence value is computed for every sample. The computation assumes Gaussian distribution for the data. Along with computing the positive confidence, we identify the best subset of features that increases the prediction accuracy of our model for the minority class samples.
We iteratively search for the best subset of continuous valued data features to use for computing the positive confidence associated with each sample/example. Depending on the feature set being used, the positive confidence values can change drastically. After the positive confidence is computed, we check the random probability of a sample to belong to the minority class. Depending on the random probability for a sample to belong to the minority class, we compute the threshold value for classification that divides data into the two classes, positive and negative. Any sample with a positive confidence higher than the threshold is assumed to belong to the minority class. It becomes essential to find the optimum value for the threshold. We perform an exhaustive grid search for the threshold value in our method. A grid search for the threshold value is selected to be k times the random probability for a sample to belong to the (Figure 1) minority class. The subset of features and the threshold value which provides the largest F2 Score is finally used for the model. The dataset used for testing our model and the experimental design is discussed in the next section.

Figure 1: PCA plot with first two principal components.
Results and Discussions
We use a publicly available Hepatitis dataset to test our approach [7]. We have compared our model with some of the widely used algorithms as base classifiers such as the Support Vector Machine (SVM) [8] and the Random Forest [9] classifier.
Dataset Description
The dataset has two classes. The classes represent the outcome of the sample (die or live). There are 155 instances in the dataset and 20 data features including the class feature. The data con-tains both discrete and continuous attributes. For our method we only used continuous attributes namely, Age, Bilirubin, Alk phosphate, SGOT, Albumin and Protime. The other methods used for comparison purposes use all 19 data features. Missing values were dealt with by using median based missing value strategy. The dataset is highly imbalanced with just 32 instances of the die class and 123 instances of the live class. Die class is represented with a class value of 1 and live class is represented with a class value of 2. The dataset has an imbalance ratio of 3.85. The data has a high degree of overlap along with the class imbalance. Figure 1, which is the plot of the first two principal components after PCA [10] analysis shows the degree of overlap in the data. As can be seen the data is not linearly separable.
Performance Evaluation Criteria
As is well known, classification accuracy is not the most optimal performance measure to be used for classification of imbalanced data. Classification accuracy tends to be biased towards the majority class and can provide an overly optimistic picture [11] of performance. Some of the other measures which are used in-stead are Area under the receiver operating characteristic (ROC) curve, known as AUC, Precision, Recall, F-Measure (weighted average between precision and recall). For highly skewed data, ROC may also provide an overly optimistic view of the models performance and hence F-Measure tends to be a better performance measure [5]. For our analysis we use F-Measure and F2 score in particular. F2 score provides greater emphasis on the
Recall in the dataset [12]. The F score is defined as follows:
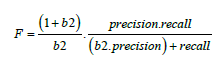
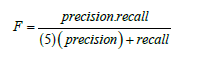
The value of b for F2 score is 2 and hence the formula changes
Experimental Results and Discussion
Table 1 shows the results of the experiment using SVM, Random Forest and our approach Positive Confidence (PConf) approach. Our approach uses just four features, namely, Age, Alk phosphate, Albumin and Protime. The Precision Recall and F2 Score is tracked individually for the minority class, as well as for the combination of both classes. Table 2 shows the predictions for each classifier. TP denotes the number of True Positives while TN is the number of True Negatives, FP is the number of False Positives and FN is the number of False Negatives for each classifier. The positive class is the minority class, i.e. the die class in this case and the negative class is the majority class, i.e. the live class (Table 1).

Table 1: Experimental Results.
As can be seen from the Tables 1 & 2 our model provides better predictions than the SVM and Random Forest classifiers. Although, the False Positive rates are slightly higher in our case, the True Positive rates balances it out, and as can be seen from the F2 Score, PConf provides the best trade off between True Positives and False Positives. The experimentation that we have presented represents an initial exploratory analysis of our method with just one dataset and more work needs to be done to extend this work to evaluate generalizability to other types of datasets. Out of 32 samples of the minority class, our model is able to classify 20 of those correctly which is much larger than the 13 correctly classified samples for the two other classifiers. Also, our model uses only four data features which makes it easier to visualise and interpret the model. SVM and Random Forest uses all 19 attributes for model building.

Table 2: Confusion Matrix.
Data Visualisation
Utilising the information retrieved from our model, we visualise the data to see what information can be deemed useful Figure 2 for domain experts from our analysis. Figures 2,3 shows 2dimensional data distribution between data features used in our analysis. Figure 2 shows the data distribution for features Age and Alk Phosphate. X-axis is Age and Y-axis is Alk Phosphate. As can be seen, there is some separation in terms of the different classes with respect to Age. The minority class is more prevalent in ages over 30 and utilising the information from our model we can visually see why Age as a feature is useful to discriminate between the two classes. PCA on the other hand in Figure 1 was unable to provide any linear separation because of the high dimensionality of the data. Figure 3 shows also shows some separation in the data in terms of the values for feature Albumin. Higher values for Albumin seem to be associated with Class 2.

Figure 2: 2D Visualisation of Features Age and Alk Phosphate.
Figures 4,5 plots the positive confidence against two different features. The X-axis in both cases is positive confidence. Figure 4 shows the relationship between the positive confidence values and Age. As expected, higher positive confidence is associated with Class 1, i.e., the minority class. Figure 5 shows the relationship between positive confidence and Pro time. Such visual representations make it easier to analyse the data and draw conclusions from the data (Figure 4,5).

Figure 3: 2D Visualisation of Features Albumin and Protime.

Figure 4: 2D Visualisation of Positive Confidence and Age.

Figure 5: 2D Visualisation of Positive Confidence and Protime.
Conclusion
As seen in the previous section, our model is able to perform better classification with less data features with better classification outcomes for the minority class. This initial analysis shows promising results and more work needs to be done to extend our work. A major advantage of our work is the fact that we are utilizing the information already present in the data and we are not artificially rebalancing the data to increase classification accuracy.
There are a few limitations of our method. We are currently only using continuous valued data features and the method needs to be extended to utilize information from discrete valued features as well. Also, the model needs to be tested on other datasets from the biomedical domain as well as other domains. Further work needs to be undertaken to identify feature value pairs if possible, to make the model further interpretable and usable. This is an ongoing area of research and we aim to address the aforementioned issues in our next work. As mentioned, this work needs to be backed by knowledge of domain experts. Without input from domain experts we are unable to ascertain that our results will hold value in a clinical context.
Acknowledgements
The dataset used in this paper is publicly available on UCI Machine Learning Repository. The research has been carried out in Knowledge Engineering and Discovery Research Institute (KEDRI), Auckland University of Technology, Auckland, New Zealand.
Declaration of Conflicting Interests
The author(s) declared no potential conflicts of interest with respect to research, authorship, and/or publication of this article.
References
- Gary M Weiss (2013) Foundations of imbalanced learning. In Imbalanced Learning: Foundations, Algorithms, and Applications, Wiley Online Library p. 13-42.
- Nathalie Japkowicz (2000) Learning from imbalanced data sets: a comparison of various strategies. In AAAI workshop on learning from imbalanced data sets 68: 10-15.
- Gary M Weiss (2004) Mining with rarity: a unifying framework. ACM Sigkdd Explorations Newsletter 6(1): 7-19.
- Barnan Das, Narayanan C Krishnan, Diane J Cook (2013) Handling class overlap and imbalance to detect prompt situations in smart homes. In 2013 IEEE 13th International Conference on Data Mining Workshops pp. 266-273.
- Haibo He, Edwardo AG (2009) Learning from imbalanced data. IEEE Transactions on knowledge and data engineering 21(9): 1263-1284.
- Takashi Ishida, Gang Niu, Masashi Sugiyama (2018) Binary classification from positive-confidence data. In Advances in Neural Information Processing Systems pp. 5917-5928.
- Dheeru Dua, Casey Graff (2017) UCI machine learning repository.
- Corinna Cortes , Vladimir Vapnik (1995) Support-vector networks. Ma-chine learning 20(3): 273-297.
- Leo Breiman (2001) Random forests. Machine learning 45(1): 5-32.
- Chaur-CC, Abbie H (2015). High-dimensional data visualization by pca and lda. Hsinchu, Taiwan: National Tsing Hua University.
- Jesse Davis, Mark Goadrich (2006) The relationship between precision-recall and roc curves. In Proceedings of the 23rd international conference on Machine learning pp. 233-240.
- Yutaka Sasaki (2007) The truth of the f-measure.


 We use cookies to ensure you get the best experience on our website.