Research Article 
 Creative Commons, CC-BY
Comparative Analysis between Thromboelastography and Routine Coagulation Test in Liver Disease
*Corresponding author: Haimei MA, Department of Blood Transfusion Medicine, Beijing Tsinghua Changgung Hospital, School of Clinical Medicine, Tsinghua University, Beijing, China.
Received: April 20, 2020;Published: May 12, 2020
DOI: 10.34297/AJBSR.2020.08.001326
Abstract
Background: Thromboelasto Graphy (TEG) is a continuous, real-time and holistic method to analyze the coagulation and fibrinolytic function of whole blood. We evaluated the feasibility and accuracy of TEG in monitoring the coagulation function of liver diseases by comparing the routine coagulation examination results and TEG in liver disease patients.
Methods: A total of 115 patients with liver disease were enrolled in April 2016 ~ October 2017, Tsinghua Changgung Hospital Beijing, China, all of whose venous blood had been performed TEG and routine coagulation function test. The TEG parameters and the routine coagulation function indexes were analyzed and processed by SPSS statistical software. The correlation analyses of the two variables were carried out one by one.
Results: The reaction time of TEG was positively correlated with activated partial thromboplastin time(APTT) (r = 0.237, P< 0.05), and was independent of platelet(PLT) (r = -0.201, P < 0.05); Kinetic time was positively correlated with prothrombin time (PT) and thrombin time(TT) (r = 0.184,0.228, P< 0.05), which was independent of fibrinogen(FiB) and PLT (r = -0.343, -0.643, P< 0.01); -Angle was positively correlated with FiB and PLT (r = 0.312, 0.583, P< 0.01), and was independent of TT and PT (r = -0.195,-0.219, P < 0.05); Maximum amplitude was correlated with FiB and PLT (r = 0.503, 0.707, P< 0.01), which was independent of TT and PT (r = -0.217,-0.224, P< 0.05); CI level was positively correlated with FiB and PLT (r = 0.292, 0.571, P< 0.01), and was inversely correlated with TT, PT and APTT (r =- 0.208, -0.254, -0.224, P< 0.05). Kinetic time, -Angle, maximum amplitude and CI level werecorrelated most obviously with PLT.
Conclusion: The TEG parameters and routine coagulation function test index have a certain correlation, while TEG detection can simultaneously get the related parameters of coagulation, fibrinolysis and platelet, and the coagulation function of patients with liver disease can be assessed more holistically and comprehensively using TEG.
Keywords: Thromboelasto Graphy; Routine Coagulation Test; Liver Disease; Coagulation Function; Correlation Analysis
Background
The liver gathers the body’s abundant blood flow and is the main site for many coagulation factors in the human body. There are 14 kinds of coagulation factors in the human body, the most important of which are fibrinogen, prothrombin, coagulation factors II, VII, IX and X. And these five coagulation factors are all synthesized in the liver. In liver disease, the lack of coagulation factors due to hepatocyte damage leads to coagulation dysfunction in patients, mainly bleeding [1]. The degree of bleeding in patients with liver disease was positively correlated with the severity of liver function impairment. It is essential to monitor the perioperative stop/coagulation function of patients with liver disease [2]. If the coagulation dysfunction is found, the corrective treatment should be performed as soon as possible. After correction, it is necessary to observe whether the medication is insufficient or excessive, to ensure the success of the operation and reduce the incidence of postoperative complications of disease. In this study, through the correlation analysis between the thromboelastogram experiment of liver disease patients and the routine coagulation function test, the author tries to enrich the evaluation methods of clinical coagulation function, reduce the blindness of patients’ coagulation function, and maintain the dynamic balance of body coagulation.
Materials and Methods
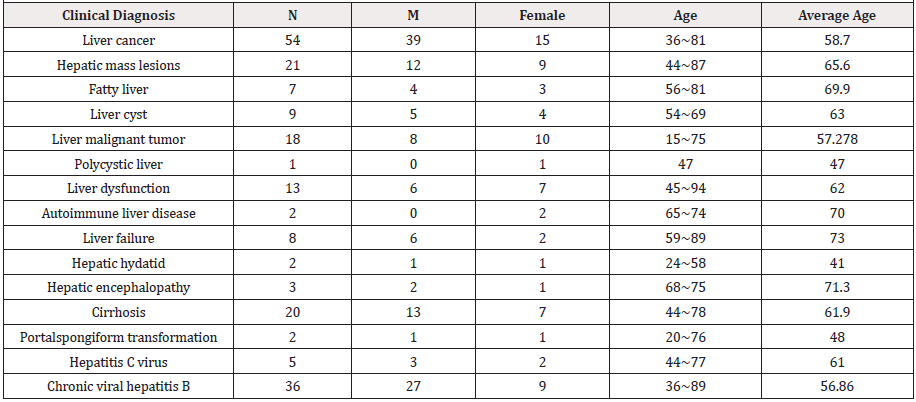
Research object 115 inpatients with liver disease admitted in Beijing Tsinghua Changgung Hospital from April 2016 to October 2017 were selected as the research subjects, and TEG, conventional coagulation tests and PLT were recorded at the same time, and basic information of all patients was recorded. Of the 115 patients with liver disease, 71 were male and 44 were female, aged 15-94 years old, with an average age of 60.35 and a median age of 62. See Table 1 for clinical diagnosis data.
Reagents and instrumentsTEG was detected by TEG5000 thromboelastographand supporting reagents were produced by the Haemoscope company in the United States. Routine blood coagulation experiment was measured by Sysmex CS-5100, and blood routine platelet count test was measured by XN-9000, all of the reagents were provided by the manufacturer.
Methods
TEG test Take 3ml of venous blood (sodium citrate anticoagulant blue cap tube, Vacuette) from the patient and mix it for examination. The preset temperature of the TEG detector was 37°C, and it was operated strictly in accordance with the instrument’s instruction manual [3]. Firstly pipette 20ul of 0.2mol/L calcium chloride into the measuring cup, then add 1ml of sodium citrate anticoagulated whole blood to the kaolin activated bottle, mix upside down 5 times, suck 0.34ml into the measuring cup, and put it on the cup for 1h Detection. The computer automatically traced the TEG curve through signal transmission until the MA value was determined, and recorded the main parameters of the TEG R value, K value,α -Angle, MA value, and CI value.
Platelet and routine blood coagulation function test Extraction 2ml of venous blood from the patient (EDTA-K2 anticoagulation) for routine blood test (platelet count); 3ml (sodium citrate anticoagulation) for routine blood coagulation test, complete the test and record the PLT, TT, PT, APTT, and FiB test values.
1.4 Statistical methods SPSS 19.0 Statistical software was used for statistical processing and analysis of the data. Correlation analysis was performed between the results of each TEG parameter and routine coagulation tests and platelet counts. One sample K-S test was used to analyze whether each parameter showed a normal distribution. The measurement data that conformed to the normal distribution was expressed as`x±s, and used the Pearson correlation analysis; The data that did not meet the normal distribution was expressed as percentiles P25 and P75, and used the Spearman correlation analysis. P <0.05, the difference was statistically significant.
Results
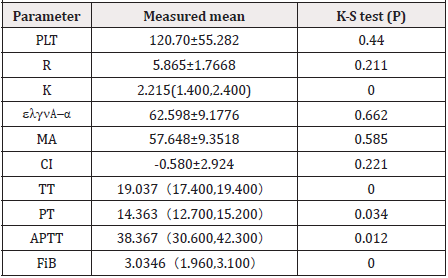
K-S test analysis of each parameter of TEG and routine coagulation function test indicators PLT, R, α-Angle, MA, CI were normal distribution, K, TT, PT, APTT, FiB were non-normal distribution. See Table 2.
Correlation analysis between TEG and routine coagulation function test indicators and PLT the R value was positively correlated with APTT and negatively correlated with PLT; K value was negatively correlated with FiB and PLT , and was positively correlated with PT and TT; α-Angle was positively correlated with FiB and PLT, and was negatively correlated with PT and TT; MA value was positively correlated with FiB and PLT, and was negatively correlated with PT and TT; CI value was positively correlated with FiB and PLT, and was negatively correlated with TT, PT and APTT. K value,α -Angle value, MA value and CI value were all most significantly related to PLT. See Table 3.
Discussion
The liver synthesis function of patients with liver disease declines, leading to the rapid reduction of coagulation factors and anticoagulant levels, thereby breaking the dynamic balance of the body’s anticoagulant function, leading to the occurrence of coagulation dysfunction in patients [4], therefore monitoring the coagulation function of patients with liver disease is significant.
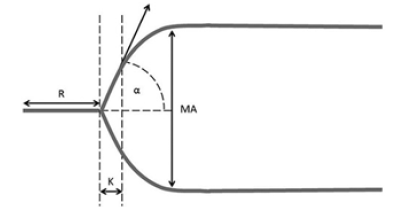
Routine indicators of coagulation function include prothrombin time (PT), activated partial thromboplastin time (APTT), fibrinogen measurement (FiB), and international standardized ratio (INR). The routine coagulation function test is relatively mature and has been widely used in clinical practice, but the method is to detect the blood clot formation time in the patient’s isolated plasma environment, which can only reflect a part of the waterfall cascade reaction, that is, to PT, APTT or Fibrinolysis,the detection cannot completely simulate the whole picture of human coagulation. In contrast, in recent years, TEG has become a new method popularized in the clinic. TEG can completely reflect the whole process from coagulation factor activation, fibrin formation, blood clot formation to lysis. The TEG of a normal person is shown in Figure 1 [5].
Note: Graphical representation of thromboelastograph with measured parameters depicted schematically. α, α angle; K, clot kinetics; MA, maximum amplitude; R, clotting time.
Thromboelastograph (TEG) instrument was invented by German doctor Hartert in 1948 [6], and was mainly used to monitor the whole process of blood coagulation with coagulopathy [7]. The specimen detected by TEG is the patient’s whole blood (sodium citrate anticoagulation), which is activated by kaolin activator, and then calcifies the whole blood and then moves from the flowing state to the coagulated state. The kinetics of blood clot formation is obtained by monitoring this process Tracing chart. The indicators of thromboelasto graphy can accurately reflect the coagulation function of patients: R value, K value, α-Angle and MA value, and coagulation composite index CI value. TEG accurately reflects four indicators of coagulation function: R value is the time from the start of the coagulation reaction to the initial formation of fibrin, which mainly reflects the function of coagulation factors. The K value is the time for the initial fibrin formation to reach a certain blood clot hardness, which mainly reflects the speed at which the blood clot reaches a certain strength. α-Angle represents the rate of fibrin clot formation and consolidation, mainly assessing the rate of fibrin formation and cross-linking. MA value is a measure of the maximum intensity of blood clot agglutination, which mainly reflects the function and number of platelets [8].
The comparison of parameters of TEG and routine coagulation function test in this study showed that there was a certain correlation between the two methods. The R value was positively correlated with APTT, r was 0.237, P <0.05, and had nothing to do with PT. Because TEG is kaolin instead of collagen in vivo to activate the coagulation factor to obtain R value, it can more dynamically reflect human coagulation function, and the degree of reflection is higher than exogenous coagulation, the approach is consistent with the coagulation waterfall theory [9]. The R value was negatively correlated with PLT, r was -0.201, P <0.05, indicating that platelets as a carrier affect the hemostatic function of coagulation factors, and high platelet quality results in a strong function of coagulation factors, but R values will decrease. K value was significantly negatively correlated with FiB and PLT, r was -0.343 and -0.643, P <0.01. α-Angle was significantly positively correlated with FiB and PLT, r was 0.312, 0.583, P <0.01. K value and α-Angle indicate that the TEG index when reflecting fibrin function has a significant correlation with conventional coagulation index. Since the K value cannot be determined when the patient is in a hypocoagulable state, whileα-Angle can determine whether a blood transfusion is needed and the value is greater [10].
The MA value was related to the routine coagulation function indicators TT, PT, FiB, and PLT, indicating that in addition to the quantity and quality of FiB and PLT, MA value was also affected by coagulation factors, because the GPⅡb / Ⅲa receptor molecular conformation of platelets is Platelet changes after activation and deformation, revealing that the fibrinogen receptor and fibrin bind to participate in platelet aggregation response. The activity of coagulation factors determines the production of fibrinogen, and the generation of thrombin determines the degree of platelet activation. The CI value has a certain correlation with conventional indicators of coagulation function, and the correlation with PLT is the most obvious, indicating that when reflecting the coagulation function of patients with liver disease, it is consistent for evaluating the functions of coagulation factors, fibrinogen and platelets.
In this study, through the correlation analysis of the two methods, we have found that there was a certain correlation between the both. The TEG test can simultaneously obtain relevant parameters of coagulation, fibrinolysis, and platelets, which can more quickly, accurately and comprehensively evaluate the coagulation function of patients with liver disease. At the same time, patients can be guided for perioperative blood transfusion. Because TEG cannot provide quantitative detection of coagulationrelated factors and cannot replace conventional coagulation testing, an optimal combination of TEG and conventional coagulation function experiments should be used to guide clinical judgment of the condition and evaluate objectively and accurately patients’ coagulation function.
References
- Amitrano L, Guardascione MA, Brancaccio V, Antonio Balzano (2002) Coagulation disorders in liver disease[J]. Semin Liver Dis 22(1): 83-96.
- Li Bing, Jiang Yixin, Zhang Yu, Gyeong-Jo Byeon, Ji-Hye Ahn, et al. (2011) Correlation between thromboelastogram and conventional coagulation test indicators during liver transplantation. Journal of Clinical Anesthesiology 27 (4): 340-342.
- Chen Guanyi, OuyangXilin, WuJinghui (2015) Comparative study of thromboelastic chart and conventional coagulation evaluation in clinical patients. Chinese Journal of Experimental Hematology 23(2): 546-551.
- Tripodi A, Mannucci PM (2011) The coagulopathy of chronic liver disease. N Engl J Med 365(2): 147-156.
- Elizabeth K Sewell (2017) Arch Dis Child Fetal Neonatal Ed102: F79-F84.
- Hartert H (1948) Blutgerinnungsstudien mitvder Thrombelastographie, einem neuen Untersuchungsverfahren. Mol Med-jmm 26(37): 577-583.
- Luddington RJ (2005) Thrombelastography/thromboelastometry. Clin Lab Haematol 27(2): 81-90.
- R Todd Stravitz, Ton Lisman, Velimir A Luketic, Richard K Sterling, Puneet Puri, et al. (2012) Minimal effects of Acute Liver Injury/Acute Liver Failure on Hemostasis as Assessed by Thromboelastography. Hepatol 56(1): 129-136.
- Ye Yuping, Wang Yan (2017) Correlation analysis between thromboelastography and conventional coagulation test in patients with breast cancer. Chinese Journal of Blood Transfusion 30(4): 368-371.
- Ma Xuebin, Ma Yi, Yang Ming (2013) Correlation between TEG thromboelastography and conventional coagulation experiments. International Journal of Laboratory Medicine 34(24): 3335-3336.


 We use cookies to ensure you get the best experience on our website.