Research Article 
 Creative Commons, CC-BY
HE4 Levels for Detecting Recurrence in Ovarian Cancer: A Systematic Review and Meta-Analysis
*Corresponding author: Ping Ma, Department of Laboratory Medicine, The Affiliated Hospital of Xuzhou Medical University, No. 99 West Huaihai Road, Xuzhou, Jiangsu, 221002, China.
Received: March 31, 2020; Published: April 14, 2020
DOI: 10.34297/AJBSR.2020.08.001289
Abstract
Introduction: The role of human epididymis protein 4 (HE4) in detecting recurrence in ovarian cancer patients has been investigated in several studies, but the results have been inconsistent. A meta-analysis was conducted to systematically evaluate the performance of HE4 in detecting ovarian cancer recurrence.
Methods: The MEDLINE, EMBASE, Web of Science and Cochrane Library databases were searched for relevant studies. The types of included studies were cross-sectional studies, cohort studies and case-control studies. The targeted studies included ovarian cancer patients undergoing complete postoperative chemotherapy, and being followed up to identify recurrence. Stata/SE statistical software was used to synthesize and analyze the data.
Results: Six studies were included in the analysis. The pooled sensitivity and specificity of HE4 in detecting recurrence of ovarian cancer was 0.86 (95% CI: 0.79-0.91) and 0.90 (95% CI: 0.49-0.99). The pooled positive likelihood ratio (PLR) for HE4 was 8.33(95% CI:1.19-58.31), and the pooled negative likelihood ratio (NLR) was 0.15(95% CI:0.10-0.23). The area under the summary receiver operating characteristic (SROC) curve was 0.89 (95% CI: 0.86-0.92).
Conclusions: HE4 is a sensitive marker for detecting recurrence in ovarian cancer.
Keywords: Human epididymis protein 4; Ovarian cancer; Recurrence; Follow-up
Introduction
Ovarian cancer is the seventh most common cancer in females all over the world, and the yearly incidence rates are estimated at 3.2 to 13.1 per 100,000 women [1-6]. Although incidences are relatively low, ovarian cancer accounts for the majority of deaths among all gynecologic malignancies, especially in developing countries [2,3]. This high mortality is mainly attributed to the minimal clinical symptoms in the early stages, which imply that most cases are caught in their advanced stages (International Federation of Obstetrics and Gynecology [FIGO] stage III and IV) [7-9].The prognosis of the patients at late stages is poor, and more than 70.0% of them will relapse after optimal surgery and first-line chemotherapy [10]. Therefore, it is important for women affected by ovarian cancer that recurrence is detected timely.
Because the recurrent disease usually presents as small implants in the abdomen and normal-sized lymph node metastasis, it is not reliable to detect early relapse using regular imaging technologies, such as ultrasound, computed tomography (CT) and magnetic resonance imaging (MRI) [11-13].Rising CA125 levels may precede the clinical detection of relapse in more than 56.0% ovarian cancer cases [14], and Gynecologic Cancer Intergroup (GCIG) has recommended the changes of CA125 levels as a supplementary measure to use in combination with Response Evaluation Criteria in Solid Tumors (RECIST) [15,16]. However, CA125 surveillance is associated with a high false-negative rate, since CA125 is not always elevated in ovarian cancer cased, such as in patients with mutinous tumors [17].
To improve the sensitivity in detecting relapse of ovarian cancer, new biomarkers were screened and verified. Among multiple kinds of biomarkers, human epididymis protein 4 (HE4) has gradually gained attention. Studies have demonstrated that HE4 showed a greater diagnostic value in detecting ovarian cancer [18-20], and its pre-treatment values were associated with patients’ prognosis [21-23]. However, there is still no consensus about the role of HE4 in monitoring recurrence in ovarian cancer patients during followup. Some researchers suggested that HE4 was more sensitive than CA125 in the early detection of relapse [24-28,22], while others concluded that CA125 was the most reliable biomarker for ovarian cancer monitoring, and HE4worked only in a small group of cases [29].
In the current study, we perform a meta-analysis to systematically evaluate the potential of HE4 to detect recurrence of ovarian cancer.
Methods
This meta-analysis has followed The PRISMA guidelines [30]. The protocol is registered in the PROSPERO database, and with the ID 165766.
Search strategy
We systematically searched for relevant studies in the MEDLINE database (via PubMed) [1946 to current], EMBASE [1974 to current], Web of Science [1990 to current] and the Cochrane Library [2000 to current].Studies were collected with the following search terms: (“Ovarian Neoplasm” OR “Ovary Neoplasm” OR “Ovary Cancer” OR “Ovarian Cancer” OR “Cancer of Ovary” OR “Cancer of the Ovary”) AND (“human epididymis protein 4” OR “human epididymal protein 4” OR “human epididymis secretory protein 4” OR “human epididymal secretory protein 4” OR “human epididymis secretory protein E4” OR “human epididymal secretory protein E4” OR “human epididymis-specific protein 4” OR “human epididymisspecific protein E4” OR “HE4” OR “WFDC2”). AND (“recur*” OR “monitor*” OR “Follow Up” OR “Follow-Up” OR “surveillance”). The date of the last search was the 26th December, 2019.
Selection Criteria
The types of studies we included were cross-sectional diagnostic test accuracy studies, cohort studies, and case-control studies. The inclusion criteria for eligible articles were that (1) ovarian cancer patients were diagnosed by pathological examination, (2) the patients underwent complete chemotherapy after the operation, and were followed up for recurrence, (3) HE4 was detected during follow-up, (4) enough data was available to construct the 2×2 contingency table (the number of true-positive [TP], false-positive [FP], true-negative [TN] and false-negative [FN] data points), and (5) the studied published from 2008 to current, since HE4 is a new biomarker.
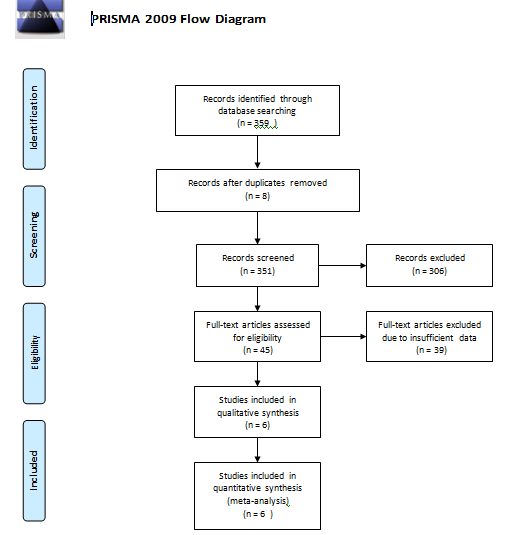
The exclusion criteria were that (1)ovarian cancer patients received radiotherapy or chemotherapy before surgery, (2)the study was an overlap, or consisted of duplicate data, (3) the study was a review, abstractor conference presentation. The process for selecting studies is shown in Figure 1.
In the targeted studies, the patient population was the ovarian cancer patients who showed recurrence after operation and chemotherapy. The intervention was the regular follow-up after therapy. The comparison involved ovarian cancer patients that did not present recurrence in the follow-up. The main outcome was the consistency of HE4 levels and the occurrence in ovarian cancer patients. If CA125 levels were measured in the studies, their performance in detecting recurrence was also monitored. The length of the follow-up was from the completion of chemotherapy to the last visit.
Quality assessment and data extraction
Two review authors (Yi Guo, Ying-xing Zhu) independently assessed methodological quality of the studies and extracted data, discussing any discrepancies. If agreements could not be reached, they were resolved by resorting to a third review author (Ping Ma).
Quality Assessment of Diagnostic Accuracy Studies-2 (QUADAS-2) was used to evaluate the quality of the included studies and grade the evidence [31].
The following data were extracted from each study: author, year of publication, country of origin, study design, blinding, participants (n), cases of recurrence (n), detection technology, threshold (cut off values) and test performance (TP, TN, FN and FP). Other information was extracted according to the quality assessment of QUADAS, and the details are shown in Table 1.
Statistical analysis
The meta-analysis was performed by using Stata/SE statistical software (version 12.0). The sensitivity, specificity, positive likelihood ratio (PLR ) and negative likelihood ratio (NLR ) diagnostic score, odds ratio and their 95 % confidence interval (CI) were calculated and synthesized by using the DerSimonianand Laird method [32]. The summary receiver operating characteristic (SROC) curve was drawn by Moses’ linear model to pool the joint distribution of sensitivity and specificity, and the area under the SROC curve (AUC) was also calculated. The heterogeneity of the data was evaluated with I2. Low, moderate and high values were assigned to I2 estimates of 25.0%, 50.0% and 75.0%, respectively [33]. An I2 estimate below 25.0% was regarded as low heterogeneity, while an estimate above 75.0% was considered high. If heterogeneity existed among studies, its possible source was investigated by meta-regression and subgroup-analysis. The Deek’s funnel plot asymmetry test was used to assess the publication bias.
Results
Literature search and study descriptions
We retrieved 359 studies from the four aforementioned databases. After browsing the titles and abstracts, we excluded 306 studies. After we scrutinized the remaining 45 papers in full, 6 studies met the inclusion criteria and were analyzed [24-28,22]. The selection algorithm for studies included in the meta-analysis is shown in Figure 1.
Quality assessment
Overall, the methodological quality of the studies was moderate. Three studies showed a high risk of bias in “Patient Selection” [24,26,27], three studies showed a high risk of bias in “Index Test” [24,27,28]. None of the six studies showed a high risk of bias in “Reference Standard” and “Flow and Timing”. One study showed applicability concerns that do not match the meta-analysis question [24]. Detailed information is shown in Figure 2 & Supplementary file 1.
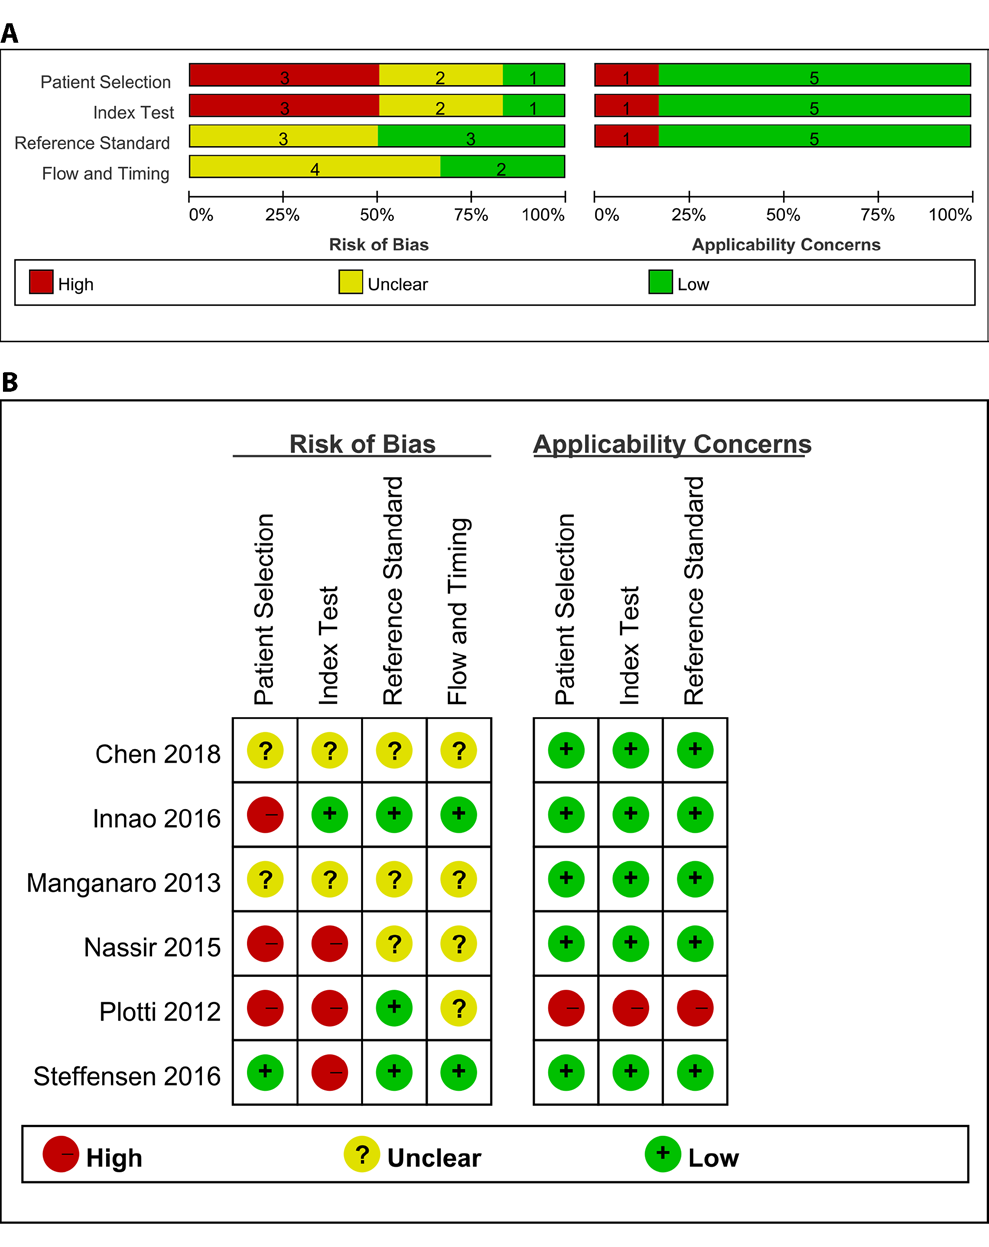
Figure 2: Quality assessments of the included studies. A: The methodological quality graph; B: The methodological quality summary.
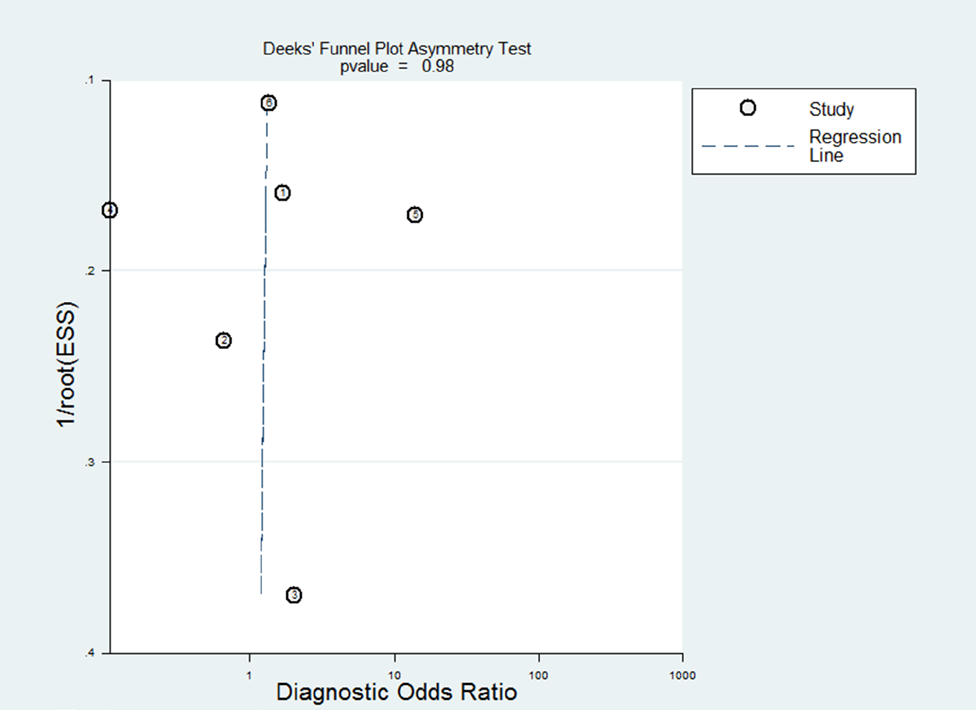
Figure 3: Deek’s funnel plot asymmetry test.
Note: Each circle represents a study in the meta-analysis. The
publication bias was not significant (p = 0.98).
Diagnostic performance of HE4
The Deek’s funnel plot asymmetry test showed p value was 0.98, suggesting that there was no significant publication bias (Figure 3). Moreover, the slope of the regression line is close to 90°, which might be attributed to the relatively small number of the included studies.
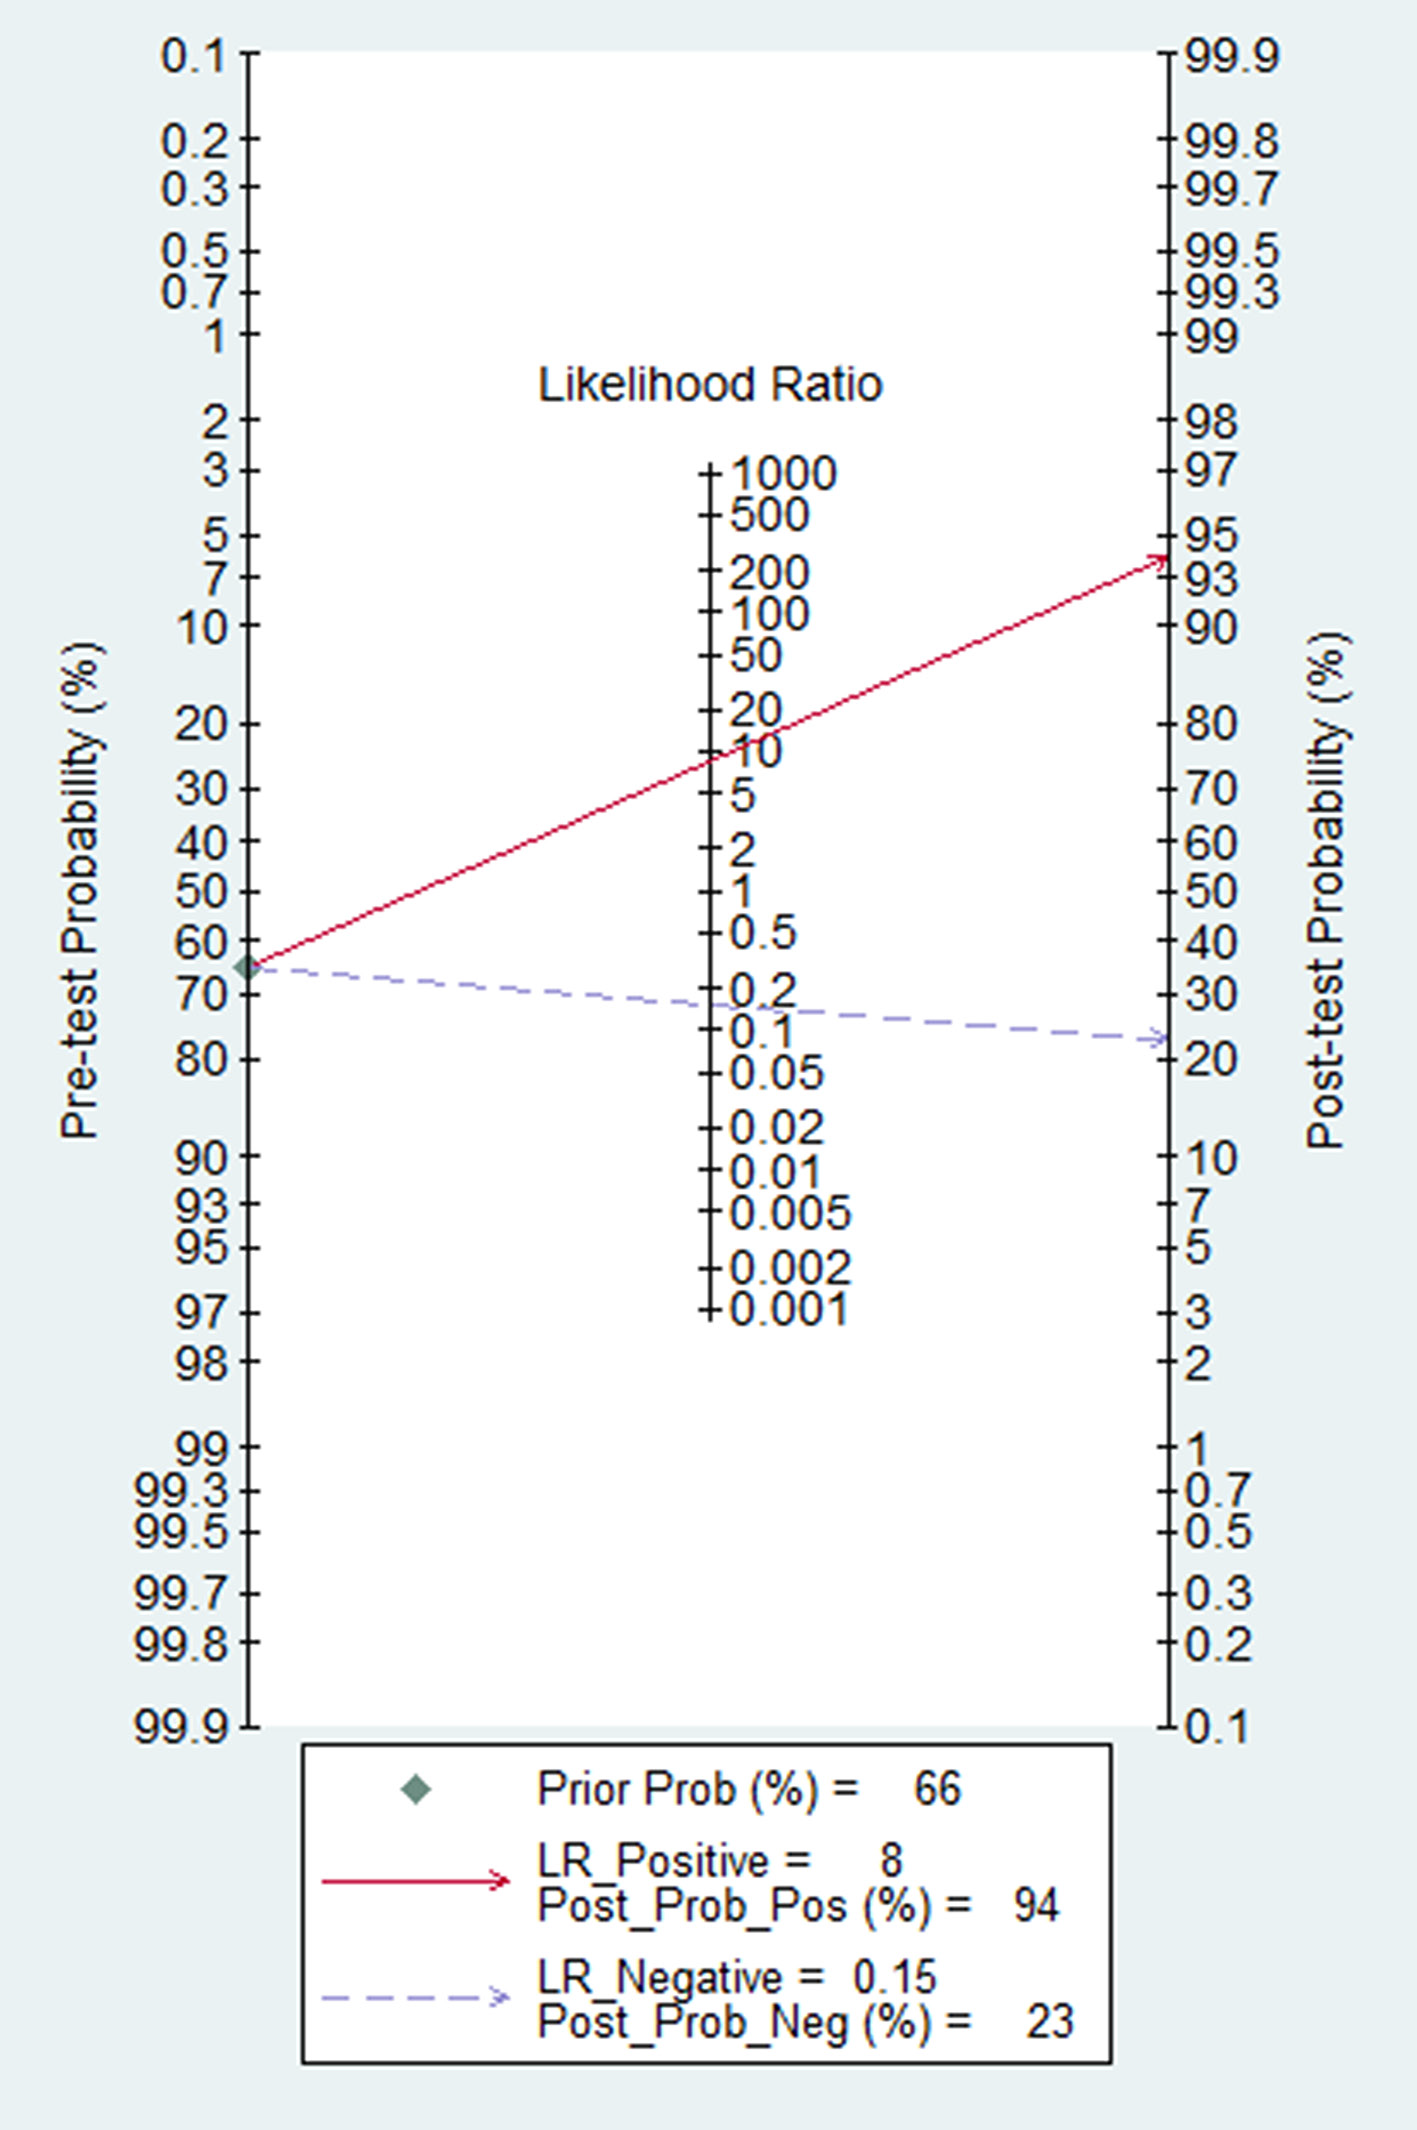
The pooled sensitivity and specificity of HE4 in detecting recurrence of ovarian cancer was 0.86 (95% CI: 0.79-0.91) and 0.90 (95% CI: 0.49-0.99), respectively (Figure 4A). The pooled PLR for HE4 was 8.33(1.19-58.31), and the pooled NLR was 0.15(0.10-0.23) (Figure 4B). The AUC of the SROC, which illustrates the correlation between sensitivity and specificity, was 0.89 (95% CI: 0.86-0.92) (Figure 5). It was reported that symptoms were positive in 65.5% of ovarian cancer patients [34], which was, therefore, considered as pre-test probability. Then, the positive post-test probability was calculated as 94.0%, and the negative post-test probability was 26.0% (Figure 6).
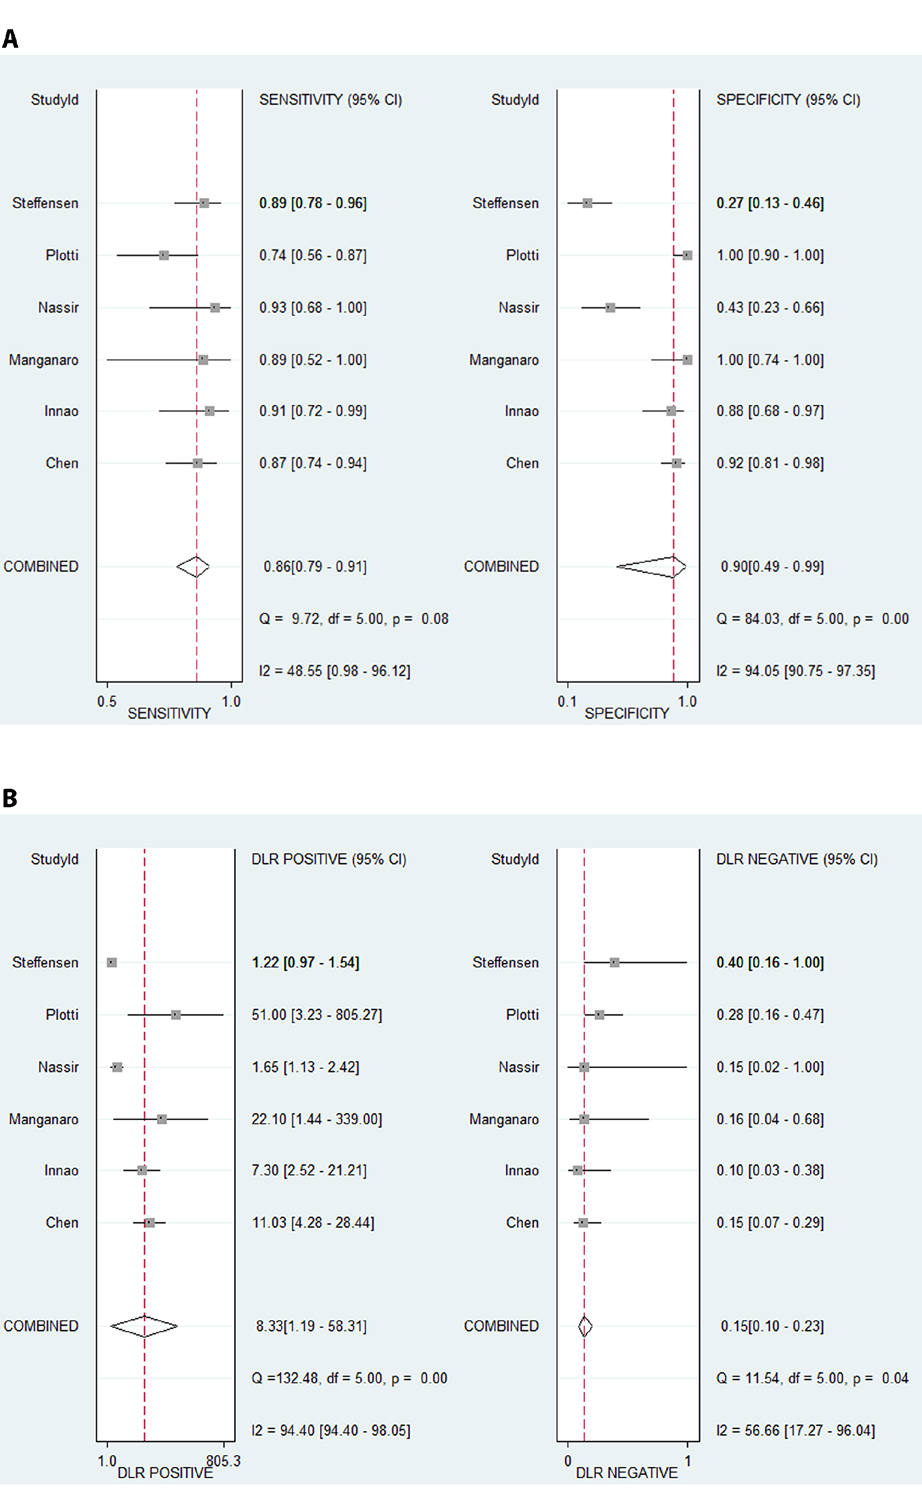
Figure 4: Diagnostic performance of HE4 in detecting ovarian
cancer recurrence. A: Forest plots of the sensitivity and specificity
for HE4; B: Forest plots of the PLR and NLR for HE4.
Abbreviations: PLR: Positive Likelihood Ratio; NLR: Negative
Likelihood Ratio; StudyId: Study Identity (the first author of the
included study); DLR positive: Positive Likelihood Ratio; DLR
negative: Negative Likelihood Ratio.
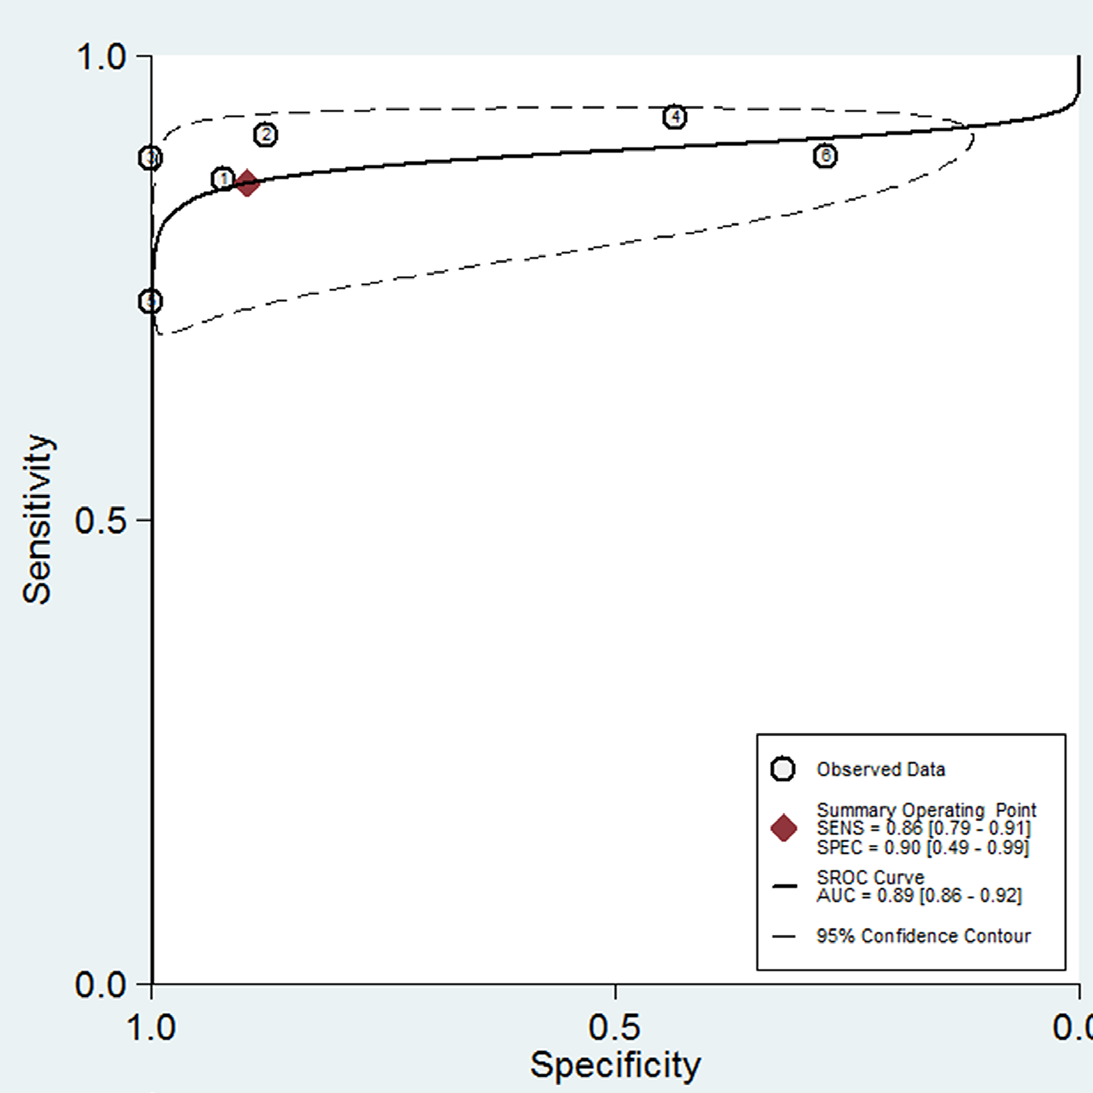
Figure 5: SROC curve and AUC of HE4.
Abbreviations: SROC curve: The Summary Receiver Operating Characteristic Curve; AUC: The Area Under The SROC Curve
Five of the six included studies assessed the performance of CA125 in detecting recurrence independently. The sensitivity and specificity for CA125 varied from 0.35 to 0.75, and 0.48 to 0.92, respectively. The range of PLR and NLR of CA125 was 0.86 - 6.38 and 0.28-1.10, respectively. The AUC was 0.68 (95% CI: 0.64-0.72). The forest plots of CA125 with sensitivity, specificity, PLR and NLR and its SRO Care shown in Supplementary file 2.
Sources of heterogeneity
The between-study heterogeneity was low for sensitivity (I2 = 48.6%,p=0.080)and moderate for NLR (I2 = 87.7%, p=0.040), but it was high for specificity (I2 = 94.1%, p<0.001), PNR (I2 = 94.4%, p<0.001) (Figure 4). The potential sources of heterogeneity were then searched for.
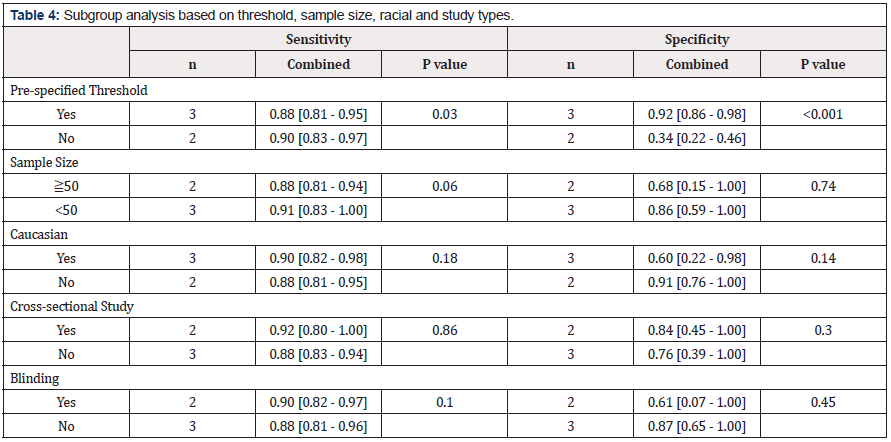
Plotti et al. regarded patients with benign tumors as a control group, which makes it differ considerably from the other studies [24]. We discovered this type of study has been classed as unfavorable in QUADAS-2. We, therefore, excluded their results to find out the source of heterogeneity more accurately. In the meta-analysis, the plane scatter distribution in the SROC curve presented a “shoulder arm-shaped” style (Figure 5), indicating that the heterogeneity may come from threshold effects. Metaregression analysis confirmed that pre-specified threshold was the main source of the heterogeneity (Table 3). The subgroup analysis also showed thatthe sensitivity and specificity were significantly different between studies with pre-specified thresholds and those setting their cut-off values arbitrarily (Table 4).
Discussion
To our knowledge, this is the first meta-analysis of the performance of HE4 in the detection of ovarian cancer recurrence. The target participants were ovarian cancer patients being followed up after treatment, and the target condition was recurrence of ovarian cancer, including local recurrence, intraperitoneal dissemination and distant metastasis. Apart from the imaging technologies and histological confirmation, routine clinical followup might also be a reference standard when auxiliary examinations are not indicated. Eight studies met the criteria, but two of them only included three patients without disease relapse [35,36], and these were excluded to guarantee the accuracy of the specificity. Therefore, six studies were finally included in the meta-analysis. In the Nassir’s study [27], the rate of recurrence was not clearly described in the first-line chemotherapy group, so we extracted data to evaluate the role of HE4 in detecting second recurrence in patients receiving second-line chemotherapy.
The results showed that the pooled sensitivity, pooled specificity, and the area under of the SROC curve of HE4 were 0.86, 0.90 and 0.89, respectively. In the six included studies, five of them also assessed the performance of CA125 in the detection of ovarian cancer recurrence (Supplementary file 3).The synthetic results showed that CA125 had pooled sensitivity of 0.57, pooled specificity of 0.74, and AUC of 0.68 (Supplementary file 2). Gu et al. [37] showed similar results concerning CA125 in a mate-analysis with a pooled sensitivity of 0.69, demonstrating that CA125 had relatively low sensitivity for detecting recurrence in ovarian cancer. These results suggest that HE4 is superior to CA125 for detecting the recurrence of ovarian cancer.
In the meta-analysis, the pooled PLR and pooled NLR of HE4 were 8.33 and 0.15, respectively. In general, the test had a confirmed diagnosis value when its PLR was greater than 10. If NLR was lower than 0.1, the trial showed a rule-out diagnosis value. Therefore, the power of HE4 to distinguish recurrence in ovarian cancer patients was relatively desirable compared to CA125 (pooled PLR: 2=18, pooled NLR: 0=58, Supplementary file 3). The positive post-test probability of HE4 was 94.0%, and the negative posttest probability was 26% in the study. This means that, if the HE4 results were positive in patients with symptoms, the possibility of recurrence increased to 94.0%. And the probability of having the disease decreased to 26% if negative HE4 results were detected in patients without symptoms.
In the meta-analysis, the pooled PLR and pooled NLR of HE4 were 8.33 and 0.15, respectively. In general, the test had a confirmed diagnosis value when its PLR was greater than 10. If NLR was lower than 0.1, the trial showed a rule-out diagnosis value. Therefore, the power of HE4 to distinguish recurrence in ovarian cancer patients was relatively desirable compared to CA125 (pooled PLR: 2=18, pooled NLR: 0=58, Supplementary file 3). The positive post-test probability of HE4 was 94.0%, and the negative posttest probability was 26% in the study. This means that, if the HE4 results were positive in patients with symptoms, the possibility of recurrence increased to 94.0%. And the probability of having the disease decreased to 26% if negative HE4 results were detected in patients without symptoms.
After the case-control study [24] was ruled out, our metaanalysis still suffered from heterogeneity between studies. We discovered that the heterogeneity mainly derived from prespecified threshold. The authors of the two studies without prespecified threshold changed the cutoff values to obtain more favorable results for sensitivity at the cost of specificity [27,28]. To minimize the bias, we preferred the results from the studies using a pre-specified threshold [22,25,26]. Subgroup analysis results showed that the pooled sensitivity and pooled specificity of HE4 in the studies with a pre-specified threshold was 0.88 and 0.92. Therefore, the meta-analysis still showed that HE4 was a promising marker for the diagnosis of recurrent ovarian cancer.
Ferraro et al. [29] argued that CA125 overcome HE4 in recognizing the disease progression. In their study, 17 (nearly 40.0%) HE4 increase was associated with decreased glomerular filtration rate (GFR), so some HE4 concentrations over the cut-off values might trigger false-positive results. Since chemotherapy often worsens patients’ renal function, the reliability of HE4 in monitoring recurrence is limited by renal impairment. Escudero et al. [38] also suggested that renal failure was the most common cause of false positive for HE4. Renal failure might affect the normal excretion of HE4, and then lead to its accumulation, In their study, 33 (50.80%) false HE4 increases were the result of renal failure, which is significantly higher than the number of false CA125 increases (17 [8.60%]).Unfortunately, the authors did not provide enough data to complete the 2×2 contingency table, we therefore could not quantitatively evaluate the performance of HE4 on detecting recurrence in ovarian cancer patients with impaired renal function. More data were required for further validation, but the two studies mentioned above did remind us of the necessity of renal function surveillance during ovarian cancer patients’ follow-up.
Our meta-analysis surely has some potential limitations. First, the number of included studies was relatively small. As is well known, follow-up studies are more difficult to perform than studies focused on diagnosis or prognosis, the number of articles about the recurrence-monitoring effects of HE4 for ovarian cancer is limited. Second, we detected heterogeneity between studies. Fortunately, the use of pre-specified thresholds was found to be responsible for this inconsistency. Third, the quality of the studies was not high. Some studies even did not provide sufficient information for us to assess their risk of bias. With the popular application of HE4, we may find more high-quality assays.
In conclusion, HE4 is a sensitive marker for detecting recurrence. Since HE4 is affected by renal function, further investigation should be performed if positive HE4 results are detected.
Acknowledgement
We are sincerely grateful to Bing Gu and Shibao Li from the Department of Laboratory Medicine, The Affiliated Hospital of Xuzhou Medical University, who helped us to revise the manuscript.
Statement of Ethics
Ethics Committee approval and informed consent for this study were not required, since the study is a systematic review. The included studies in the systematic review were conducted ethically in accordance with the World Medical Association Declaration of Helsinki, and were approved by their ethical committees.
Disclosure Statement
The authors have no conflicts of interest to declare.
Author Contributions
Yi Guo assessed the quality of the studies, extracted data, contributed to statistical analysis and wrote the main manuscript text. Ying-Xing Zhu contributed to the study-quality assessment. Ping Ma resolved disagreements, conceived the study and revised the manuscript. All of the authors reviewed the manuscript.
References
- Arab M, Khayamzadeh M, Tehranian A, Tabatabaeefar M, Hosseini M, A, et al. (2010) Incidence rate of ovarian cancer in Iran in comparison with developed countries. Indian J Cancer 47(3): 322-327.
- Huang Z, Zheng Y, Wen W, Wu C, Bao P, et al. (2016) Incidence and mortality of gynecological cancers: Secular trends in urban Shanghai, China over 40 years. European journal of cancer 63: 1-10.
- Teng Z, Han R, Huang X, Zhou J, Yang J, et al (2016) Incr.ase of Incidence and Mortality of Ovarian Cancer during 2003-2012 in Jiangsu Province, China. Frontiers in public health 4: 146.
- Torre LA, Trabert B, DeSantis CE, Miller KD, Samimi G, et al. (2018) Ovarian cancer statistics, 2018. CA: a cancer journal for clinicians 68(4): 284-296.
- Wieser S, Schmidt M, Kind AB, Heinzelmann Schwarz VA, et al. (2018) Ovarian cancer in Switzerland: incidence and treatment according to hospital registry data. Swiss Med Wkly 148: w14647.
- Lim MC, Won YJ, Ko MJ, Kim M, Shim SH, et al. (2019) Incidence of cervical, endometrial, and ovarian cancer in Korea during 1999-2015. J Gynecol Oncolc 30(1): e38.
- Holschneider CH, Berek JS (2000) ovarian cancer: epidemiology, biology, and prognostic factors. Seminars in surgical oncology 19(1): 3-10.
- Fields MM, Chevlen E (2006) Ovarian cancer screening: a look at the evidence. Clinical journal of oncology nursing 10(1): 77-81.
- Havrilesky LJ, Whitehead CM, Rubatt JM, Cheek RL, Groelke J, He Q, et al. (2008) Evaluation of biomarker panels for early stage ovarian cancer detection and monitoring for disease recurrence. Gynecologic oncology 110(3): 374-382.
- Pignata S, S CC, Du Bois A, Harter P, Heitz FV, et al. (2017) Treatment of recurrent ovarian cancer. Ann Oncol 28(suppl_8): viii51-viii56.
- Fischerova D, Burgetova A(2014) Imaging techniques for the evaluation of ovarian cancer. Best Pract Res Clin Obstet Gynaecol 28(5): 697-720.
- Javadi S, Ganeshan DM, Qayyum A, Iyer RB, Bhosale P, et al. (2016) Ovarian Cancer, the Revised FIGO Staging System, and the Role of Imaging. AJR Am J Roentgenol 206(6): 1351-1360.
- Khiewvan B, Torigian DA, Emamzadehfard S, Paydary K, Salavati A, et al. (2017) An update on the role of PET/CT and PET/MRI in ovarian cancer. Eur J Nucl Med Mol Imaging 44(6): 1079-1091.
- Gadducci A, Cosio S (2009) Surveillance of patients after initial treatment of ovarian cancer. Crit Rev Oncol Hematol 71(1): 43-52.
- Liu PY, Alberts DS, Monk BJ, Brady M, Moon J, et al. (2007) an early signal of CA-125 progression for ovarian cancer patients receiving maintenance treatment after complete clinical response to primary therapy. J Clin Oncol 25(24): 3615-3620.
- Eisenhauer EA (2011) optimal assessment of response in ovarian cancer. Ann Oncol Suppl 8: viii49-viii51.
- Einhorn N, Bast RC, Jr., Knapp RC, Tjernberg B, Zurawski VR, et al. (1986) Jr. Preoperative evaluation of serum CA 125 levels in patients with primary epithelial ovarian cancer. Obstetrics and gynecology 67(3): 414-416.
- Wu L, Dai ZY, Qian YH al. (2012) Diagnostic value of, Shi Y, Liu FJ, et serum human epididymis protein 4 (HE4) in ovarian carcinoma: a systematic review and meta-analysis. Int J Gynecol Cancer 22(7): 1106-1112.
- Yu S, Yang HJ, Xie SQ, Bao YX (2012) Diagnostic value of HE4 for ovarian cancer: a meta-analysis. Clinical chemistry and laboratory medicine 50(8): 1439-1446.
- Huang J, Chen J, Huang Q(2018 ) Diagnostic value of HE4 in ovarian cancer: A meta-analysis. Eur J Obstet Gynecol Reprod Biol 231: 35-42.
- Cao H, You D, Lan Z, Ye H, Hou M, et al. (2018) Prognostic value of serum and tissue HE4 expression in ovarian cancer: a systematic review with meta-analysis of 90 studies. Expert Rev Mol Diagn 18(4): 371-383.
- Chen L, Yang X, Abasi X, Shapaer G, Aizimu A, et al. (2018) The diagnostic, prediction of postoperative recurrence and prognostic value of HE4 in epithelial ovarian cancer. Journal of BUON : official journal of the Balkan Union of Oncology 23(2): 428-432.
- Yuan C, Li R, Yan S, Kong B (2018) Prognostic value of HE4 in patients with ovarian cancer. Clinical chemistry and laboratory medicine 56(7): 1026-1034.
- Plotti F, Capriglione S, Terranova C, Montera R, Aloisi A, et al. (2012) Does HE4 have a role as biomarker in the recurrence of ovarian cancer? Tumour biology : the journal of the International Society for Oncodevelopmental Biology and Medicine 33(6): 2117-2123.
- Manganaro L, Michienzi S, Vinci V, Falzarano R, Saldari M, Granato T, et al. (2013) Serum HE4 levels combined with CE CT imaging improve the management of monitoring women affected by epithelial ovarian cancer. Oncology reportsov 30(5): 2481-2487.
- Innao P, Pothisuwan M, Pengsa P (2016) Does Human Epididymis Protein 4 (HE4) Have a Role in Prediction of Recurrent Epithelial Ovarian Cancer. Asian Pacific journal of cancer prevention: APJCP 17(9): 4483-4486.
- Nassir M, Guan J, Luketina H, Siepmann T, Rohr I, et al. (2016) The role of HE4 for prediction of recurrence in epithelial ovarian cancer patients-results from the OVCAD study. Tumour biology: the journal of the International Society for Oncodevelopmental Biology and Medicine 37(3): 3009-3016.
- Steffensen KD, Waldstrom M, Brandslund I, Lund B, Sorensen SM, et al. (2016) Identification of high-risk patients by human epididymis protein 4 levels during follow-up of ovarian cancer. Oncol Lett 11(6): 3967-3974.
- Ferraro S, Robbiano C, Tosca N, Panzeri A, Paganoni AM, et al. (2018) Serum human epididymis protein 4 vs. carbohydrate antigen 125 in ovarian cancer follow-up. Clinical biochem 60: 84-90.
- Moher D, Liberati A, Tetzlaff J, Altman DG, Group P, et al. (2009) Preferred reporting items for systematic reviews and meta-analyses: the PRISMA statement. PLoS Med 6(7): e1000097.
- Whiting PF, Rutjes AW, Westwood ME, Mallett S, Deeks JJ, et al. (2011) QUADAS-2: a revised tool for the quality assessment of diagnostic accuracy studies. Annals of internal medicine 155(8): 529-536.
- DerSimonian R, Laird N (1986) Meta-analysis in clinical trials. Control Clin Trials 7(3): 177-188.
- Higgins JP, Thompson SG, Deeks JJ, Altman DG (2003) Measuring inconsistency in meta-analyses. BMJ 327(7414): 557-560.
- Kim MK, Kim K, Kim SM, Kim JW, Park NH, et al. (2009) A hospital-based case-control study of identifying ovarian cancer using symptom index. J Gynecol Oncol 20(4): 238-242.
- Anastasi E, Marchei GG, Viggiani V, Gennarini G, Frati L, et al. (2010) E4: a new potential early biomarker for the recurrence of ovarian cancer. Tumour biology : the journal of the International Society for Oncodevelopmental Biology and Medicine 31(2): 113-119.
- Schummer M, Drescher C, Forrest R, Gough S, Thorpe J, et al. (2012) Evaluation of ovarian cancer remission markers HE4, MMP7 and Mesothelin by comparison to the established marker CA125. Gynecologic oncology 125(1): 65-69.
- Gu P, Pan LL, Wu SQ, Sun L, Huang G, et al. (2009) CA 125, PET alone, PET-CT, CT and MRI in diagnosing recurrent ovarian carcinoma: a systematic review and meta-analysis. Eur J Radiol 71(1): 164-174.
- Escudero JM, Auge JM, Filella X, Torne A, Pahisa J, et al. (2011) Comparison of serum human epididymis protein 4 with cancer antigen 125 as a tumor marker in patients with malignant and nonmalignant diseases. Clinical chemistry 57(11): 1534-1544.






 We use cookies to ensure you get the best experience on our website.