Research Article 
![]() Creative Commons, CC-BY
Creative Commons, CC-BY
Structural Characterization and Cytotoxic Activity of New Metal Complexes of Benzohydrazide Oxime Ligand
*Corresponding author: Abdou Saad El Tabl, Department of Chemistry, Faculty of Science, El-Menoufia University, Shebin El/Kom, Egypt.
Received: February 10, 2020; Published: March 14, 2020
DOI: 10.34297/AJBSR.2020.08.001247
Abstract
New binary metal (I)/(II) complexes derived from benzohydrazide oxime ligand were prepared. Physicochemical studies (IR, UV-Vis, Mass,1HNMR, Magnetic Moment, Thermal analysis, conductivity, ESR) revealed that, the ligand coordinates to the metal ion in a neutral bidentate or neutral hexadentate mode through nitrogen atoms of amino and oxime groups and oxygen atom of the amide group. All metal complexes are nonelectrolytic in nature as suggested by molar conductance measurements. The complexes are adopted to be a linear as Ag (I) complex or tetragonal distorted octahedral geometry around the metal ions.
The cytotoxic activity of the ligand as well as some of its metal complexes was evaluated against human liver cancer (Hep-G2). It is worth noting, the cytotoxic activity was enhanced upon complexation. Also, it was interestingly found that, the Cu (II) complex (2) which formed in (1L: 2M) molar ratio, recorded the highest cytotoxicity against Hep-G2. On the other hand, Zn (II) complex (4) recorded moderate IC50 value against Hep-G2. However, the other tested complexes showed a weak cytotoxicity against the same cell line compared with a standard drug (vinblastine sulfate).
Keywords: Hydrazon Oxime, Complexes, Spectra, Magnetic Moment, ESR, Cytotoxicity, Anti-Inflammatory, Analgesic, Anticonvulsant, Antituberculosis, Antitumor, Anti-HIV, Antimicrobial Activity
Introduction
Hydrazones and their derivatives constitute a versatile class of compounds in organic chemistry. These compounds have interesting biological properties such as anti-inflammatory, analgesic, anticonvulsant, antituberculosis, antitumor, anti-HIV and antimicrobial activity [1]. Hydrazones are important compounds for drug design, as possible ligands for metal complexes, organocatalysis and for the syntheses of heterocyclic compounds [2]. The ease of preparation increased hydrolytic stability relative to imines, and tendency toward crystallinity are all desirable characteristics of hydrazones. Due to these positive traits, hydrazones had been under study for a long time, but much of their basic chemistry remains unexplored. Hydrazone ligands create an environment like the one present in biological systems usually by making coordination through oxygen and nitrogen atoms. Various important properties of carbonic acid hydrazides, along with their applications in medicine and analytical chemistry, have led to increased interest in their complexation characteristics with transition metal ions [3].
The hydrazone unit offers several attractive features such as the degree of rigidity, a conjugated system and a NH unit that readily participates in hydrogen bonding and may be a site of protonation- deprotonation. It is well established that, the formation of metal complexes plays an important role to enhance the biological activity of free hydrazones [4]. Hydrazone ligands are promising compounds because of their ability towards complexation and wide range of biological and non-biological properties [5,6]. The chemistry of transition metals with ligands from the hydrazine family has been of interest to coordination as well as bio-inorganic chemists due to their different bonding modes with both electron-rich and electron-poor metals [7]. The structural motif, ‒N=C‒CH=N‒NH‒ C=N‒, present in hetero-cyclic hydrazones is a remarkable tool for development of multi-functional organic receptors that find applications in chemical, environmental and biological sciences.
Acyl-hydrazones have an additional donor site like C=O, which determine the versatility and flexibility of these compounds [8-15]. Metal complexes of acyl-hydrazones (i.e. Cu (II), Co (II), Pt (II) complexes) are known for wide spectrum of biological and pharmaceutical activities, such as inhibition of tumor growth [16-22], antioxidative effect [23,24], antimicrobial and antiviral [25-27]. Continue to our work, new metal complexes of benzohydrazide oxime ligand have been prepared and spectroscopically characterized and cytotoxic activity was studied.
Experimental
Instrumentation and Measurements
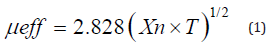
The ligand and its metal complexes were analyzed for C, H, N, Cl and M at the Micro analytical center, Cairo University, Egypt. Standard analytical methods were used to determine the metal ion content [23]. 1H-NMR spectra were obtained on Bruker 400MHz spectrometer. Chemical shifts (ppm) are reported relative to TMS. FT-IR spectra of the ligand and its metal complexes were measured using Kerr discs by a Jasco FT/IR 300E Fourier transform infrared spectrophotometer covering the range 400-4000cm-1. Electronic spectra in the 200-900nm regions were recorded on a Perkin- Elmer 550 spectrophotometers. The thermal analyses (DTA and TGA) were carried out on a Shimadzu DT-30 thermal analyzer from room temperature to 800°C at a heating rate of 10°C/min. Magnetic susceptibilities were measured at 25°C by the Gouy method using mercuric tetrathiocyanatocobaltate (II) as the magnetic susceptibility standard. Diamagnetic corrections were estimated from Pascal’s constant 30. The magnetic moments were calculated from the equation:
The molar conductance of 10-3M solution of the complexes in DMSO was measured at 25°C with a Bibby conductometer type MCl. The ESR spectra of solid complexes at room temperature were recorded using a varian E-109 spectrophotometer, DPPH was used as a standard material. The TLC of all compounds confirmed their purity.
Synthesis of the ligand
The ligand, (H4L) was synthesized by mixing (10.0g, 0.08mol) ethyl chloroacetate with sodium methyl benzoate. The solution was refluxed with stirring for two hours at 80°C, then left to cool at room temperature. The precipitated yield was filtered off then dried under vacuum over anhydrous CaCl2. (3.0 g, 0.013mol) of yield reacts with (1.34g, 0.026mol) of o-phynelendi amine in the presence of 50cm3 of ethanol solution. The solution was refluxed for another two hours with stirring at 80°C, then left to cool at room temperature. The precipitate was filtered off, and then dried. This product (1.0g, 0.0045mol) was added to (4.6g, 0.008mol) of oxime in the presence of 50cm3 of ethanol solution The mixture was refluxed for another two hours with stirring at 80°C, then left to cool to room temperature. Filtered off and the product collect to give the ligand.
Preparation of metal complexes (2-17)
Synthesis of complexes (2-17) were synthesized using( 1L:2M) molar ratio, by refluxing of (1.0g, 0.002 mol) of the ligand in 30cm3 ethanol with 30cm3 ethanolic solution of the metal salts of (1.1g, 0.0045mol) CuSO4.5H2O complex (2), (0.75g, 0.0044mol) CuCl2.2H2O complex (3), (0.98g, 0.0044mol) Zn(OAc)2.2H2O complex (4), (1.09g, 0.004mol) Mn(OAc)2.4H2O complex (5), (1.1g, 0.0045mol) CoSO4.5H2O complex (6), (0.74g ,0.044mol) AgOAc complex (7) , (1.8g, 0.0044mol) Pb(NO3)2.4H2O complex (8), (1.8g, 0.0044mol) Cd(NO3)2.4H2O complex (9), (0.89g, 0.004mol) Cu(OAc)2.H2O complex (10), (1.04g, 0.044mol) Ni(CO3)2 .3H2O complex (11), (0.55g, 0.0022mol) MgSO4.5H2O adding to (0.64g, 0.0022mol) BaSO4.4H2O to give complex (12), (0.75g, 0.0044mol) HgCl2.2H2O complex (13) (0.55g, 0.0022mol) CrSO4.5H2O complex (14) (0.44g, 0.0022mol) Cu(OAc)2. H2O adding to (0.49g, 0.0022mol) Zn(OAc)2.2H2O to give complex (15), 0.55g, 0.0022mol) CoSO4.5H2O adding to (0.64g, 0.0022mol) ZnSO4.7H2O to give complex (16), (1.1g, 0.0044mol) Co(OAc)2.4H2O complex (17) for two hour under continuous stirring at 80°C. The obtained precipitate was filtered off and dried in desiccators over CaCl2 to give anew complexes.

Table 1: Analytical and Physical Data of the Ligand [H4L] and its Metal Complexes.

Table 2: IR frequencies of the Ligand [H4L] and its Metal Complexes.

Table 3: IR frequencies of the Ligand [H4L] and its Metal Complexes.
Results and Discussion
The ligand and its metal complexes are non-hydroscopic, colored, crystalline and air-stable at room temperature. They are soluble in both Dimethylformamide (DMF) and Dimethyl Sulfoxide (DMSO) but insoluble in water, ethanol, methanol, benzene, toluene, acetonitrile and chloroform. The analytical and physical data (Table 1) and spectral data (Table 2 & 3) are consistent well with the proposed structures. Many attempts were carried out to prepare single crystal but unfortunately, they were failed. The analytical data indicated that, all complexes formed in 1L: 2M molar ratio.
Conductance Measurements
1x10⁻³ molar solutions of the ligand and its metal complexes in DMSO were used for molar conductivities measurements. The compounds recorded low molar conductivities values (listed in the experimental section) referring that, both the ligand and its metal complexes have non-electrolytic nature [24-27], which confirmed coordination of the anions to the metal ions.
Mass spectra
Mass spectrum of the ligand showed a molecular ion peak at m/e 601amu, corresponding to its formula weight (F.W.601) and supporting the, proposed structure and the purity of the ligand prepared. The prominent mass fragmentation peaks observed at m/z = 55, 59, 97, 113, 129, 143, 155, 171 210, 313, 368, 523 and 600amu corresponding to C3H3O, C3H7O, C4H7O, C5H7N, C5H7NO, C5H7NO2, C5H7NO3, C5H7N2O3, C6H7N2O3, C6H7N2O4, C9H10N2O4, C17H- 17N2O4, C21H24N2O4, C30H27N4O5, C31H32N6O7 moieties respectively and also support the suggested structure of the ligand. While mass spectrum of the Zn (II) complex (4) showed a molecular ion peak at m/e 1038amu corresponding to its formula weight (F.W. 1038) and supporting the proposed structure, and the purity of the complex prepared.
The prominent mass fragmentation peaks observed at m/z = 60,62, 93, 109, 146, 182, 283, 312, 356, 500, 590, 710, 900, 1038amu corresponding to C3H10N, C3H12N, C3H13N2O, C3H13N2O2, C3H13N2O2, C3H20N3O3, C6H20N3O3 C13H21N3O3, C13H21N3O3, C13H21N3O4, C16H26N3O6, C22H38N5O8, C25H44N5O11, C27H44N5O17, C33H51N6O19Zn, C39H52N6O19Zn2 moieties respectively and also support the suggested structure of the this complex.
1H-NMR Spectra of Ligands

Figure 1: Structure representation of the ligand [H4L] (1).
The spectrum of the ligand showed two peaks at 9.8 broad [s, 1H] and 6.3 [s, 1H] assigned to protons of (OH)oxime and υ(NH) respectively. The two peaks disappeared in Cd (II) complex (9) in dicating their participation in the coordination process. Protons signals of the methyl and acetyl groups appeared at 3.5[3H] and 4.2[3H] ppm respectively. Finally, the multiples set observed in the (7.5-8.2) ppm range assignable to the protons of the aromatic ring [27]. These finding is going consistent with the proposed structure of the ligands respectively (Figure 1).
IR spectra of the Ligands [H4L] (1) and its Metal Complexes
While the IR spectral data of the ligand and its metal complexes are represented in Table 2 the spectrum of the ligand showed broad band centered at 3390cm-1 which assigned to υ(OH). However, strong broad bands appeared in the 3540-3280 and 3260- 2670cm-1 ranges confirm the presence of non-equivalent intra and intermolecular hydrogen bondings [28]. Also, the spectrum of ligand displayed three bands at 1650, 1620 and 1595cm-1 assignable to υ(C=O), υ(C=N) and υ(C=NO)oxime respectively [29-33]. Medium bands were observed at 1508 and 762cm-1 which are related to vibration of ν(Ar) ring. The υ(NH) of the ligand appeared at 3270cm-1, however, the (NOH) group was observed at 1284,1166,1115 and 959cm-1 and these bands appeared in the same position in metal complexes indicating non-participating in coordination process .The mode of bonding of the ligand can be predicted by comparison the IR spectra of the complexes with that of the free ligand.
The complexes show a broad band in the 3390-3280cm-1 range, assigned to the presence of hydrated or coordinated water molecules. However, the bands appeared in the 3560-3110cm-1 range is due to intra-and intermolecular hydrogen bondings. The υ(NH) group appears in the 3270-3150cm-1 ranges. The complexes show υ(C=O) and υ(C=N) at (1688-1640) and (1625-1605)cm-1 respectively. These bands were shifted to lower frequency suggesting the participation of the carbonyl and azomethine groups in the coordination process. IR spectral data of complexes (2)-(17) revealed the presence of the υ(OH)oxime. However, it subjected to a negative shift to higher or lower wavenumber comparing to the ligand referring to its participation in the metal coordination.
Furthermore, υ(OH)oxime, υ(C=N) and υ(C=NO) oxime were also shifted to lower wave numbers suggestion their participation in the metal bonding [34,35]. The chloro complexes (3) and (13) showed new bands at 445 and 430cm-1 respectively, this band was assigned to υ(M-Cl). The sulphate complexes (2), (6), (12), (14) and (16) show bands at (1285, 1153, 853, and 670), (1241, 1164, 848 and 680) , (1278, 1159, 1110 and 752) , (1267, 1150, 1038 and 780) and (1285, 1161, 1118, 985 and 621)cm-1 respectively, these values indicate that, the sulphate ion is coordinated to the metal ion [33]. The mode of coordination is supported by presence of additional bands in the 620-588 and 595-500cm-1 regions corresponding to υ(M-O) and υ(M-N) bands respectively [34-38] (Figures 2-8).

Figure 2: Structure representation of Cu (II), Zn (II), Mn (II) and Co (II) complexes.
M=Cu (II) X=OAc (2) n=2
M=Zn (II) X=OAc (4) n=2
M=Mn (II) X=OAc (5) n=3
M=Co (II) X=OAc (17) n=3

Figure 3: Structure representation of Ag(I) complex (7).

Figure 4: Structure representation of Cu (II), Cd (II) and Cr (II) complexes.
M=Cu (II) X=SO4 (2) n= 4
M=Co (II) X=SO4 (6) n=2
M=Cr (II) X=SO4 (14) n=2

Figure 5: Structure representation of Cu (II) and Hg (II) complexes.

Figure 6: Structure representation of Pb (III) and Cd (III) complexes.
M=Pb (III) X= NO3 (8) n=4
M=Cd (III) X= NO3 (9) n=4

Figure 7: Structure representation of Ni (I) complex.
M=Ni (I) X= CO3 (11) n=3

Figure 8: Structure representation of [Cu (II) Zn (II)] and [Co (II) Zn (II)] complexes.
M=Cu (II) M= Zn (II) X=OAc (15) n=2
M= Co (II) M= Zn (II) X=SO4 (16) n=2
Electronic Spectrum
The electronic absorption data of the ligand and its metal complexes in Dimethylformamide (DMF) are given in Table 3. The ligand [H4L] showed three bands at 265, 310 and 325nm due to π→π* transitions within the aromatic moieties, n→π* transition of chromophore moieties present in the ligand, and CT transitions, respectively [39,40] The electronic absorption spectra of Cu (II) complexes (2), (3), (10) and (15) showed bands at [265, 305, 320, 435, 565 and 610nm] and [265, 300, 370, 430, 570and 613nm] and [265,305, 318, 435, 570 and 630nm] and [262, 305, 315, 435, 575, 605nm] respectively, the first bands are due to intra ligand transitions however, the other bands correspond to 2B1g(dx2-y2)→2A1gdz2 (ν1) 2B1g(dx2-y2)→2B2g(dxy) (ν2) and 2B1g(dx2-y2)→2Eg(dzy,dxz) (ν3) transitions. The position as well as the broadness of these bands suggest that these complexes have a tetragonal distorted octahedral geometry [41,42].
This could be due to the Jahn teller effect that operates on the d9 electronic ground state of six coordinate system, elongating one trans pair of coordinate bonds and shortening the remaining four ones [42,43]. Magnetic moment values are in the range (1.65-1.70) B.M. corresponding to one unpaired electron, spin-only value. The electronic absorption spectra of Ni(II) complex (11) displayed bands at 265, 305, 320, 475, 585, 610, 710nm attributable to intraligand transitions and the other bands are assigned to 3A2g(F)→3T- 2g(F)(ν1), 3A2g(F)→3T1g(v2) and 3A2g(F)→3T1g(P)(ν3) transitions respectively, which are consistent with octahedral stereo chemistry [44,45]. This observation is further confirmed by μeff value (3.18 B.M) corresponding to two unpaired electrons [46]. The ν2/ν1 ratio is 0.95 which is less than the usual range of octahedral nickel (II) complex (1.5-1.75), indicating that, the nickel (II) complexes have distorted octahedral geometry [45-47] The bands observed for the diamagnetic: complexes (4), (7-9) and (12) and (13) are due to intraligand transitions (Table 4).
Electronic Spectrum
The electronic absorption data of the ligand and its metal complexes in Dimethylformamide (DMF) are given in Table 3. The ligand [H4 L] showed three bands at 265, 310 and 325nm due to π→π* transitions within the aromatic moieties, n→π* transition of chromophore moieties present in the ligand, and CT transitions, respectively [39,40] The electronic absorption spectra of Cu (II) complexes (2), (3), (10) and (15) showed bands at [265, 305, 320, 435, 565 and 610nm] and [265, 300, 370, 430, 570and 613nm] and [265,305, 318, 435, 570 and 630nm] and [262, 305, 315, 435, 575, 605nm] respectively, the first bands are due to intra ligand transitions however, the other bands correspond to 2 B1g(dx2-y2)→2A1gdz2(ν1) 2B1g(dx2-y2)→2B2g(dxy) (ν2) and 2B1g(dx2-y2)→2Eg(dzy,dxz) (ν3) transitions. The position as well as the broadness of these bands suggest that these complexes have a tetragonal distorted octahedral geometry [41,42].
This could be due to the Jahn teller effect that operates on the d9 electronic ground state of six coordinate system, elongating one trans pair of coordinate bonds and shortening the remaining four ones [42,43]. Magnetic moment values are in the range (1.65-1.70) B.M. corresponding to one unpaired electron, spin-only value. The electronic absorption spectra of Ni(II) complex (11) displayed bands at 265, 305, 320, 475, 585, 610, 710nm attributable to intraligand transitions and the other bands are assigned to 3A2g(F)→3T- 2g(F)(ν1), 3A2g(F)→3T1g(v2) and 3A2g(F)→3T1g(P)(ν3) transitions respectively, which are consistent with octahedral stereo chemistry [44,45]. This observation is further confirmed by μeff value (3.18 B.M) corresponding to two unpaired electrons [46]. The ν2/ν1 ratio is 0.95 which is less than the usual range of octahedral nickel (II) complex (1.5-1.75), indicating that, the nickel (II) complexes have distorted octahedral geometry [45-47] The bands observed for the diamagnetic: complexes (4), (7-9) and (12) and (13) are due to intraligand transitions (Table 4).
Thermal Analyses
The thermal data of complexes (10), (16) and (17) are listed in Table 5. These complexes were introduced as representative examples. Thermogram of complex (10) [(H2L) (Cu)2(OAc)4(H2O)2].2H2O showed a decomposition in six steps, the first step involving breaking of H-bondings accompanied with endothermic peak at 45°C. In the second step, two molecules of hydrated water were lost endothermically with peak at 85°C accompanied by 3.6% (Calc 3.4%) weight loss. Such a low temperature endothermic dehydrations indicated that the water molecules were not coordinated to the metal. Loss of two coordinated water molecule was recorded in the third step as an endothermic peak at 120°C with 4.1 (Calc. 3.6) weight losses. The 24.9% weight loss (Calc 24.5%) accompanied by an endothermic peak which observed at 230°C was assigned to loss of four Acetate Groups (OAc), whereas the endothermic peak observed at 370°C refers to the melting point of the complex.

Table 4: Thermal analyses for some metal (II) complexes.

Table 5: ESR. Data for some metal (II) complexes.
The final step observed as exothermic peaks 430,490 and 550°C with 26.9.% weight loss (Calc 24.5%), refers to complete oxidative decomposition of the complex which exceed up with the formation of 2CuO. The first step observed in the thermogram of complex (16) [(H2L) (Co)(Zn)(SO4)2 (H2O)2].4H2O involves breaking of H-bondings accompanied with endothermic peak at 40°C. In the second step, four molecules of hydrated water were lost endothermically with a peak at 80°C accompanied by 6.9% (Calc 6.7%) weight loss. The third step involved loss of two coordinated water molecules accompanied with an endothermic peak which observed at 120°C with 3.8 (Calc. 3.6%). weight loss 21.4% (Calc 20.2 %) weight loss accompanied by an endothermic peak was observed at 220°C, which was ascribed to loss of a coordinated two sulphate group (SO4), while the endothermic peak appeared at 370°C refers to the melting point of the complex.
The final step observed at 380, 420 and 480°C with 9.9% weight loss (Calc 9.7%) and 10.8 weight loss (Calc 10.7%) as exothermic peaks, refers to complete oxidative decomposition of the complex which ended up with the formation of CoO and ZnO respectively. The first step observed in the thermogram of complex (17) [(H2L) (Co)2(OAc)4(H2O)2].2H2O involving breaking of H-bondings accompanied with endothermic peak at 45°C. In the second step, two molecules of hydrated water were lost endothermically with peak at 80°C. accompanied by 5.5% (Calc 5.1%) weight loss. Loss of two coordinated water molecules was recorded in the third step as an endothermic peak observed at 120°C with 3.9 (Calc. 3.6) weight loss. The 25.1% weight loss (Calc 24.7%) accompanied by an endothermic peak appears at 225°C was assigned to loss of four Acetate Groups (OAc), whereas the endothermic peak observed at 370°C refers to the melting point of the complex.
The final step observed in 430,510 and 550°C with 21.2% weight loss (Calc 20.6%), refers to complete oxidative decomposition of the complex which exceed up with the formation of 2CoO. Loss of two coordinated water molecules was recorded in the third step as an endothermic peak observed at 120°C with 4.2 (Calc. 3.9) weight loss. The 39.3% weight loss (Calc 38.7%) accompanied by an endothermic peak appeared at 250°C was assigned to loss of four Acetate Groups (OAc), whereas the endothermic peak which observed at 350°C refers to the melting point of the complex. The final step observed in 420,460 and 500°C with 30.3% weight loss (Calc 29.8%), refers to complete oxidative decomposition of the complex which exceed up with the formation of 2ZnO. Thermogram of complex.
Electron Spin Resonance (ESR)
The spectra of copper (II) complexes (2), (3) are characteristic
of species, d9 configuration having axial type of a d(x2-y2) ground
state which is the most common for copper (II) complexes [48]. The
complexes show 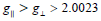 , indicating octahedral geometry
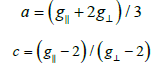
around the copper (II) ion [49]. The g-values are related by the expression
, indicating octahedral geometry
around the copper (II) ion [49]. The g-values are related by the expression
 [49,50], where (G) is exchange coupling
interaction parameter. If G < 4.0, a significant exchange coupling is
present, whereas if G value > 4.0, local tetragonal axes are aligned
parallel or only slightly misaligned.
[49,50], where (G) is exchange coupling
interaction parameter. If G < 4.0, a significant exchange coupling is
present, whereas if G value > 4.0, local tetragonal axes are aligned
parallel or only slightly misaligned.
Complexes (2) show 2.4 value, indicating spin- exchange interactions
take place between copper (II) ions. This phenomenon
is further confirmed by the magnetic moments values which were
found in the (1.65- 1.67B.M.) range. The  value is also considered
as a diagnostic term for stereochemistry [51], the
value is also considered
as a diagnostic term for stereochemistry [51], the  values were in the (185-225cm-1) range which are expected for distorted
octahedral copper(II) complexes.
values were in the (185-225cm-1) range which are expected for distorted
octahedral copper(II) complexes.
The g-value of the copper (II) complexes with a 2B1g ground
state  may be expressed by [261]:
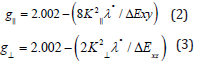
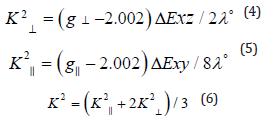
Where  and k⊥ are the parallel and perpendicular components
respectively of the orbital reduction factor (K), λ ° is the
spin-orbit coupling constant for the free copper, ΔExy and ΔExz
are the electron transition energies of 2B1g→2B2g and 2B1g→2Eg.
From the above relations, the orbital reduction factors
and k⊥ are the parallel and perpendicular components
respectively of the orbital reduction factor (K), λ ° is the
spin-orbit coupling constant for the free copper, ΔExy and ΔExz
are the electron transition energies of 2B1g→2B2g and 2B1g→2Eg.
From the above relations, the orbital reduction factors  ,
which are measure terms for covalency [50], can be calculated. For
an ionic environment, K=1; while for a covalent environment, K<1.
The lower the value of K, the greater is the covalency.
,
which are measure terms for covalency [50], can be calculated. For
an ionic environment, K=1; while for a covalent environment, K<1.
The lower the value of K, the greater is the covalency.
K values, for the copper (II) complexes (2), (3) are indicating
covalent bond character [48-52]. Kivelson and Neiman [49] noted
that, for ionic environment  and for a covalent environment
 [51]. Theoretical work by Smith seems to confirm
this view [52]. The g-values reported here Table 5 show considerable
covalent bond character [48]. Also, the in-plane σ -covalency
parameter, α2(Cu) was calculated by
[51]. Theoretical work by Smith seems to confirm
this view [52]. The g-values reported here Table 5 show considerable
covalent bond character [48]. Also, the in-plane σ -covalency
parameter, α2(Cu) was calculated by

The calculated values suggest a covalent bonding [51,52]. The
in-plane and out of-plane π- bonding coefficients  and
and  respectively,
are dependent upon the values of ΔExy and ΔExz in the
following equations [52].
respectively,
are dependent upon the values of ΔExy and ΔExz in the
following equations [52].
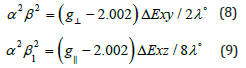
In this work, the complex (2) show value 0.92 indicating
moderate degree of covalency in the in-plane π-bonding [50-52].
value for complex (3) are 1.08 indicating ionic character of the outof-
plane, it is possible to calculate approximate orbital populations
ford orbitals [52] by
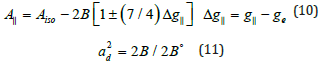
Where A° and 2B° is the calculated dipolar coupling for unit occupancy of d orbital respectively. When the data are analyzed, the components of the Cu hyperfine coupling were considered with all the sign combinations [53]. The only physically meaningful results are found when A|| and A⊥ were negative. The resulting isotropic coupling constant was negative and the parallel component of the dipolar coupling 2B are negative (184, and -140). These results can only occur for an orbital involving the d(x2-y2) atomic orbital on copper. The value for 2B is quite normal for copper (Il) complexes [51]. The |Aiso| value was relatively small. The 2B value divided by 2B° (The calculated dipolar coupling for unit occupancy of d(x2-y2) using equation (10) suggests all orbital population close to 60-89.2 % d-orbital spin density, clearly the orbital of the unpaired electron is d(x2-y2) [53].
Biological studies
Invitro cytotoxicity
The Antiproliferative activity of the ligand (1) and some of their metal complexes (2), (3), (7) and (17) (were evaluated against HEPG-2 cell line and shown in Figures [54-57]. In this study, we try to know the chemotherapeutic activity of the tested compounds by comparing them with the standard drug (IMURAN (azathioprine). The treatment of the different complexes in DMSO showed similar effect in the tumoral cell line used as it was previously reported [57]. The solvent DMSO shows no effect in cell growth. The Cu (II) complex (2) and (3) have shown a weak inhibition effect at ranges of concentrations used, however, The obtained data indicate the surviving fraction ratio against HEPG-2 tumor increasing with the decrease of the concentration in the range of the tested concentrations.
After the tumor cells were incubated in the presence of the tested compound for 48h, the IC50 values for all of ligand and its complexes ranged from 62.1 to 500μg/ml against Hep-G2, indicating varying degree of antitumor activity of the ligand and its metal complexes. It was reported that compounds exhibiting IC50 values more than 10-25μg/ml indicate weak cytotoxic activities while compounds with IC50 values less than 5μg/ml are very active. Those having intermediate values ranging from 5 to 10μg/ml are classified as moderately active [266]. IC50 values refer to a weak cytotoxic activity of the ligand against both Hep-G2 with IC50 (37.7 and 24.9μg/ml) respectively. IC50 of Cu (II) complex (7), (17) is (54.1 and 62.1μg|ml) respectively.
The chemotherapeutic activity of the complexes may be attributed to the central metal atom which was explained by Tweedy’s chelation theory [54,55]. Also, the positive charge of the metal increases the acidity of coordinated ligand that bears protons, leading to stronger hydrogen bonds which enhance the biological activity [56]. Moreover, Gaetke and Chow had reported that metal has been suggested to facilitate oxidative tissue injury through a free-radical mediated pathway analogous to the Fenton reaction [54]. By applying the ESR-trapping technique, evidence for metal-mediated hydroxyl radical formation in vivo has been obtained [55]. Reactive oxygen species are produced through a Fenton-type reaction as follows:
LM(II) + H2O2 → LM(I) +.OOH + H+
LM(I) + H2O2 → LM(II) +.OH + OHWhere
L=organic ligand

Figure 9: Cytotoxic activity of ligand, [H4L], (1) and against its metal complexes human liver Hep-G2 cancer cell at different concentration.
Furthermore, metal could act as a double-edged sword by inducing DNA damage and by inhibiting their repair [55]. The OH radicals react with DNA sugars and radicals react with DNA sugars and bases, resulting in the release of free bases and strand break occurs. Bases and the most significant and well characterized of the OH reactions are hydrogen atom abstraction from the C4 on the deoxyribose unit to yield sugar radicals with subsequent β-elimination. By this mechanism strand break occurs as well as the release of the free bases. Another form of attack on the DNA bases is by solvated electrons, probably via a similar reaction to those discussed below for the direct effects of radiation on DNA [57,58] (Figure 9&10).

Figure 10: Cytotoxic activity of ligand, [H4L], (1) and against its metal complexes human liver Hep-G2 cancer cell at different concentration.
References
- Dhanaraj CJ, Johnson J (2015) Quinoxaline based bio-active mixed ligand transition metal complexes: Synthesis, characterization, electrochemical, antimicrobial, DNA binding, cleavage, antioxidant and molecular docking studies. Journal of Photochemistry and Photobiology B: Biology 151: 100-109.
- El Tabla AS, Abdelwahed MM, Whaba MA (2015) Synthesis, characterization and fungicidal activity of binary and ternary metal (II) complexes derived from 4,4′-((4-nitro-1,2-phenylene)bis(azanylylidene))bis(3-(hydroxyimino)pentan-2-one). Spectrochimica Acta Part A: Molecular and Biomolecular Spectroscopy 136: 1941-1949.
- Kulkarni AD (2017) Schiff’s Bases Metal Complexes in Biological Application. Journal of Analytical & Pharmaceutical Research 5(1): 127.
- El Tabla AS, Shakdofa MME, Whaba MA, Whaba (2015) Synthesis, characterization and antimicrobial activity of new Binary metal complexes derived from amino sulfonaphthalene ligand. Journal of Chemical Biological and Physical Sciences 5(4): 3629-3644.
- El Tabla AS, El Kousy S, Wahba MA, Khalefa SM (2014) Organic amino acids chelates, preparation, spectroscopic characterization and applications as foliar fertilizers. Journal of Advances in Chemistry 10(2): 2203-2217.
- El Tabla AS, Shakdofa MME, Whaba MA (2014) Sugar hydrazone complexes; synthesis, spectroscopic characterization and antitumor activity. Journal of Advances in Chemistry 9(1): 1837-1860.
- Netalkar PP, Netalkar SP, Revankar VK (2015) Transition metal complexes of thiosemicarbazone: Synthesis, structures and invitro antimicrobial studies. Polyhedron 100: 215-222.
- El Bahnasawy RM, Sharafeldeen LM, El Table AS, Wahba M, El Mensef AEIA (2014) Electrical conductivity of salicylaldehyde thiosemicarbazone and Pd (II), Cu (II) AND Ru (III). Eur Chem Bull 3(5): 441-446.
- El Bahnasawy RM, El Saied FA, Gaafer EHA, Wahba MA (2013) Benzil bisisonicotinoyl hydrazone complexes of tervalent metals Ti, Zr, Sn, Hf and Th. J Inorg Biochem 8(1): 1-6.
- Xia L, Xia YF, Huang LR, Xiao X, Lou HY, et al. (2015) Benzaldehyde Schiff bases regulation to the metabolism, hemolysis, and virulence genes expression in vitro and their structure-microbicidal activity relationship. European Journal of Medicinal Chemistry 97: 83-93.
- Chaitra TK, Mohana KNS, Tandon HC (2015) Thermodynamic, electrochemical and quantum chemical evaluation of some triazole Schiff bases as mild steel corrosion inhibitors in acid media. Journal of Molecular Liquids 211: 1026-1038.
- Liang JH, Lv W, Li XL, An K, Cushman M, et al. (2013) Synthesis and antibacterial activity of oxime ether non-ketolides, and novel binding mode of alkylides with bacterial rRNA. Bioorganic & Medicinal Chemistry Letters 23(5): 1387-1393.
- El Gamal MI, Bayomi SM, El Ashry SM, Said SA, Abdel Aziz AA, et al. (2010) Synthesis and anti-inflammatory activity of novel (substituted)benzylidene acetone oxime ether derivatives: Molecular modeling study. European Journal of Medicinal Chemistry 45(4): 1403-1414.
- Dai H, Yan Shuang X, Zhong L, Xiao Yong X, Xu Hong Q (2014) The thiazoylmethoxy modification on pyrazole oximes: Synthesis and insecticidal biological evaluation beyond acaricidal activity. Chinese Chemical Letters 25(7): 1014-1016.
- Babahan I, Anil H, Sarikavakli N (2006) Synthesis of vic-dioxime derivatives with hydrazone side groups and their metal complexes. Turkish Journal of Chemistry 30(5): 563.
- Ramanand N, Jeyamurugan R (2009) Synthesis, characterization, and DNA interaction of mononuclear copper (II) and zinc (II) complexes having a hard-soft NS donor ligand. Journal of Coordination Chemistry 62: 2375-2387.
- Levander OA (1977) Metabolic interrelationships between arsenic and selenium. Environmental Health Perspectives 19: 159-164.
- Boyce R (1907) The Treatment of Sleeping Sickness and other Trypanosomiases by the Atoxyl and Mercury Method. Br Med J 2(2437): 624-625.
- Lever ABP (1968) Inorganic electronic spectroscopy. Amsterdam, Elsevier, Netherlands pp.420.
- Bosch F, Rosich L (2008) The contributions of Paul Ehrlich to pharmacology: a tribute on the centenary of his Nobel Prize. Pharmacology 82(3): 171-179.
- Khaled S, Ahmed MZ, Khan FG, Ahmed SK (2013) Synthesis, Characterization, and Photophysical Studies of Some Novel Ruthenium(II) Polypyridine Complexes Derived from Benzothiazolyl hydrazone. International Journal of Inorganic Chemistry p.7.
- Vogel A (1978) Vogel’s textbook of quantitative inorganic analysis, including elementary instrumental analysis 4th (Edn), London, New York, USA pp.925.
- Naskar S, Subhendu N, Mondal S, Majhi PK, Drew MGB, et al. (2011) Synthesis and spectroscopic properties of cobalt (III) complexes of some aroyl hydrazones: X-ray crystal structures of one cobalt (III) complex and two aroyl hydrazone ligands. Inorganica Chimica Acta 371(1): 100-106.
- Bakheit M, Satyanarayana S (2010) Vitamin B12 Model complexes: synthesis and characterization of thiocyanato cobaloximes and thiocyanato bridged dicobaloximes of o-donor ligands: DNA Binding and antimicrobial activity. J Korean Chem Soc 54(6): 687-695.
- El Tabl AS (2002) Synthesis and physico-chemical studies on cobalt (II), nickel (II) and copper (II) complexes of benzidine diacetyloxime. Transition Metal Chemistry 27(2): 166-170.
- Aly M, Baghlaf A, Ganji N (1985) Linkage isomerism of the oximato group: the characterization of some mono-and binuclear square planar nickel (II) complexes of vicinal oxime-imine ligands. Polyhedron 4(7): 1301-1309.
- Nakamoto K (1978) Infrared and Raman spectra of inorganic and coordination compounds. Wiley Online Library, NewYork, USA pp.448.
- El Tabl AS, Abdelwahed MM, Whaba MA, Shebl (2014) Synthesis, spectroscopic characterization and biological activity of the metal complexes of the Schiff base derived from phenylaminoacetohydrazide and dibenzoylmethane. Spectrochimica Acta Part A: Molecular and Biomolecular Spectroscopy 71(1): 90-99.
- El Tabl AS (1997) Novel N-diacetyloximo-1, 3-phenylenediamine copper (II) complexes. Transition Metal Chemistry 22(4): 400-405.
- Aly MM, Imam SM (1994) Site occupancy and reactivity of nickel (II) and palladium (II) coordination compounds of vicinal oxime-imine ligands: an interpretation to the phenomenon of chelate isomerism in the same molecule. Polyhedron 13(12): 1907-1916.
- El Reash GMA, Ibrahim KM, Bekheit MM (1990) Ligational behaviour of biacetylmonoxime nicotinoyl hydrazone (H2BMNH) towards transition metal ions. Transition Metal Chemistry 15(2): 148-151.
- Chaudhary N, Mishra P (2017) Metal Complexes of Novel Schiff Base Based onPenicillin: Characterization, Molecular Modeling, and Antibacterial Activity Study. Bioinorganic Chemistry and Applications p.13.
- Lever A (1968) Electronic spectra of some transition metal complexes: Derivation of Dq and B. J. Chem. Educ 45(11): 711.
- Aslan HG, Özcan S, Karacan N (2011) Synthesis, characterization and antimicrobial activity of salicylaldehyde benzenesulfonylhydrazone (Hsalbsmh) and its Nickel (II), Palladium (II), Platinum (II), Copper (II), Cobalt (II) complexes. Inorganic Chemistry Communications 14(9): 1550-1553.
- Mohamed GG, Omar M, Hindy AM (2005) Synthesis, characterization and biological activity of some transition metals with Schiff base derived from 2-thiophene carboxaldehyde and aminobenzoic acid. Spectrochimica Acta Part A: Molecular and Biomolecular Spectroscopy 62(4): 1140-1150.
- Geary WJ (1971) The use of conductivity measurements in organic solvents for the characterisation of coordination compounds. Coordination Chemistry Reviews 7(1): 81-122.
- El Tabl AS, Abdelwahed MM, Whaba MA (2009) Synthesis, spectroscopic investigation and biological activity of metal (II) complexes with N2O4 Journal of Chemical Research 2009(9): 582-587.
- Surati KR, Thaker B (2010) Synthesis, spectral, crystallography and thermal investigations of novel Schiff base complexes of manganese (III) derived from heterocyclic β-diketone with aromatic and aliphatic diamine. Spectrochimica Acta Part A: Molecular and Biomolecular Spectroscopy 75(1): 235-242.
- Surati KR (2011) Synthesis, spectroscopy and biological investigations of manganese (III) Schiff base complexes derived from heterocyclic β-diketone with various primary amine and 2, 2′-bipyridyl. Spectrochimica Acta Part A: Molecular and Biomolecular Spectroscopy 79(1): 272-277.
- Figgis BN (1966) Introduction to Ligand Fields. Interscience Publishers, New York, USA.
- Ali MA, Akbar AM, Huq MA, Yin YC, Hayatti R, et al. (2011) Mixed-ligand ternary complexes of potentially pentadentate but functionally tridentate Schiff base chelates. Polyhedron 30(3): 542-548.
- El Tabl AS, Abdelwahed MM, Whaba MA (2010) Synthesis of novel metal complexes with isonicotinoyl hydrazide and their antibacterial activity. Journal of Chemical Research 34(2): 88-91.
- Ulrich Weser (1983) Copper Coordination Chemistry: Biochemical & inorganic Perspectives. Karlin KD, Zubieta J (Eds,). AdeninePress, Guilderland 96(6): 452-453.
- Hathaway B, Billing D (1970) The electronic properties and stereochemistry of mono-nuclear complexes of the copper (II) ion. Coordination Chemistry Reviews 5(2): 143-207.
- Al Hakimi AN, El Tabl AS, Shakdofa MM (2009) Coordination and biological behavior of 2-(p-toluidin)-N'-(3-oxo-1,3-diphenylpropylidene) acetohydrazide and its metal complexes. Journal of Chemical Research 2009(12).
- Suvarapu LN, Seo YK, Okbaek S, Ammireddy VR (2012) Review on Analytical and Biological applications of Hydrazones and their Metal Complexes. Journal of Chemistry 9(3): 1288-1304.
- Smith D (1976) Chlorocuprates (II). Coordination Chemistry Reviews 21(2): 93-158.
- Kivelson D, Neiman R (1961) ESR studies on the bonding in copper complexes. J Chem Phys 35(1): 149-155.
- Surati KR, Thaker B (2010) Spectrochimica Acta Part A: Molecular and Biomolecular Spectroscopy 75: 235-242.
- Mitu L, Ilis M, Raman N, Imran M, Ravichandran S (2012) Transition Metal Complexes Isonicotinoyl-hydrazone-4-diphenylaminobenzaldehyde: Synthesis, Characterization and Antiumer Studies. E Journal of Chemistry 9(1): 365-372.
- Al Zoubi W, Kandil F, Chebani MK (2012) Synthesis of macrocyclic schiff bases based on pyridine-2, 6-dicarbohydrazide and their use in metal cations extraction. Organic Chemistry Current Research 1(1): 1-7.
- Avaji PG, Patil SA, Badami PS (2008) Synthesis, spectral, thermal, solid-state DC electrical conductivity and biological studies of Co(II) complexes with Schiff bases derived from 3-substituted-4-amino-5-hydrazino-1, 2, 4-triazole and substituted salicylaldehydes, Transition Metal Chemistry 3: 275-283.
- Opletalová V, Kalinowski DS, Vejsová M, Kuneš JI, Pour M, et al. (2008) Identification and characterization of thiosemicarbazones with antifungal and antitumor effects: cellular iron chelation mediating cytotoxic activity. Chemical Research in Toxicology 21(9): 1878-1889.
- El Tabl AS, Shakdofa MM, El Seidy A (2011) Synthesis, Characterization and ESR Studies of New Copper(II) Complexes of Vicinal Oxime Ligands. Journal of the Korean Chemical Society 55(4): 603-611.
- Lima LM, Frattani FS, dos Santos JL, Castro HC, Fraga CAM, et al. (2008) Synthesis and anti-platelet activity of novel arylsulfonate-acylhydrazone derivatives, designed as antithrombotic candidates. Eur J Med Chem 43(2): 348-356.
- Bernhardt PV, Mattsson J, Richardson DR (2006) Complexes of cytotoxic chelators from the dipyridyl ketone isonicotinoyl hydrazone analogues. Inorg Chem 45(2): 752-760.
- Green DA, Antholine WE, Wong SJ, Richardson DR, Chitambar CR (2001) Inhibition of Malignant Cell Growth by 311, a Novel Iron Chelator of the Pyridoxal Isonicotinoyl Hydrazone Class Effect on the R2 subunit of Ribonucleotide Reductase. Clinical Cancer Research 7(11): 3574-3579.
- Qi GF, Yang ZY, Qin DD (2009) Synthesis, characterization and DNA-binding properties of the Cu (II) complex with 7-methoxychromone-3-carbaldehyde-benzoylhydrazone. Chemical and Pharmaceutical Bulletin 57(1): 69-73.


 We use cookies to ensure you get the best experience on our website.