Research Article 
![]() Creative Commons, CC-BY
Creative Commons, CC-BY
Time to Revisit Endpoint Selection in Clinical Trials
*Corresponding author: Shein-Chung Chow, Biostatistics and Bioinformatics, Duke University School of Medicine, 2424 Erwin Road, Durham, North Carolina.
Received: May 28, 2020; Published: July 02, 2020
DOI: 10.34297/AJBSR.2020.09.001398
Abstract
In clinical trials, power calculation is often performed based on a single primary endpoint to determine sample size required for achieving study objective with a desired power at a pre-specified level of significance. In practice, power calculation based on a single primary endpoint has been criticized. First, how to select the single primary endpoint among a group of primary endpoints? Second, a single primary endpoint may not be sufficient to adequately inform complex cohorts, the disease status and/or treatment effect of the test treatment under investigation. Third, different study endpoints with different data types (e.g., continuous versus binary response) may result in different sample sizes. In addition, with a given sample size, some (single) endpoints may achieve the study objective while others fail to do so. In this opinion article, a conceptual innovation is the development of a therapeutic index that fully utilizes information from all relevant study endpoints proposed.
Keywords: Primary Endpoint; Co-primary Endpoint; Utility Function; Therapeutic Index.
Introduction
In clinical trials, power analysis for sample size calculation (power calculation) is often performed based on a single primary study endpoint, a co-primary endpoint, or a composite endpoint for determining a sample size required for achieving the study objective with a desired power at a pre-specified level of significance. Thus, the selection of study endpoint for power calculation plays an import role for the success of the intended clinical trials. Different study endpoints with different data types, such as continuous, binary response, or time-to-event data, will lead to different sample size requirement for achieving the study objective with a desired power at a pre-specified level of significance. In other words, with a given sample size, we may achieve the study objective with some endpoints but not with others, thereby underestimating the potential value of some endpoints.
In practice, for (statistical) convenience sake, a single primary endpoint is often selected for power calculation. This approach, however, has been criticized by many authors [1]. because a single primary endpoint can only partially inform the disease status and/ or treatment effect of the test treatment under investigation and cannot provide a complete clinical picture regarding safety and effectiveness of the test treatment under investigation. Besides, the selected single primary endpoint may be highly related to other endpoints which are not selected as the primary endpoint for the intended trial. These endpoints carry more or less valuable information regarding safety and effectiveness of the test treatment under investigation. In practice, it is well recognized that these endpoints may not be translated to one another. In addition, it is unclear which endpoint reveals “the truth” regarding the safety and effectiveness of the test treatment under investigation. Thus, there is a risk that the selected primary endpoint will not accurately reflect disease status and the treatment effect of the test treatment under study. Consequently, regulatory decisions may be made based on a single, biased primary endpoint and hence misleading. As a result, we may put patients at greater risk or withhold potentially beneficial interventions, due to the inherent flaw of single endpoint selection.
This opinion article intends to address these dilemmas by proposing the development of an index which can utilize information collected from all relevant study endpoints for a more accurate and reliable assessment of the safety and effectiveness of the test treatment under investigation. In the next section, an example of a cancer clinical trial is discussed for illustration of inappropriate endpoint selection in current clinical practice. Our innovative development of a therapeutic index using a utility function that takes all relevant endpoints into consideration is described in Section 3, followed by some practical and challenging issues (Section 4) and criteria for evaluation of the proposed therapeutic index. Some concluding remarks are given in the last section of this article.
An Example of Cancer Clinical Research
Typical examples for clinical trials with multiple endpoints would be cancer clinical trials. In cancer clinical trials, overall survival (OS), response rate (RR), time to disease progression (TTP), tumor-related signs and symptoms (TRSS) are usually considered as primary clinical endpoints for evaluation of safety and effectiveness of the test treatment under investigation in regulatory submissions [4]. Williams et al. [5] provided a summary of oncology drug products approved by the United States Food and Drug Administration (FDA) based on single endpoint, co-primary endpoints, and/or multiple endpoints between 1990 and 2002 (Table 1).
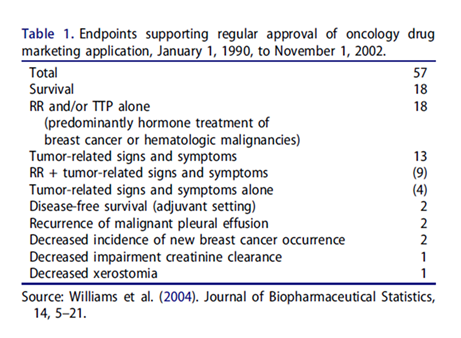
As it can be seen from Table 1, a total of 57 submissions were approved by the FDA between 1990 and 2002. Among the 57 applications, 18 were approved based on survival endpoint alone, while 18 were approved based on RR and/or TTP alone. About 9 submissions were approved based on RR plus tumor-related signs and symptoms (co-primary endpoints). Table 1 indicated that none of the study endpoints are superior to others in these regulatory submissions. More recently, Zhou et al. [5] provided a list of oncology and hematology drug approved by the FDA between 2008 and 2016. Similar results were observed. Both Williams et al. [5] and Zhou et al. [4] do not indicate that which study endpoint (including single endpoint, a co-primary endpoint, or a composite endpoint of multiple endpoints) should be used for evaluation and regulatory approval of the drug product under investigation. In practice, it is a concern that these endpoints may not be translated to one another and it is not clear which endpoint can best inform disease status and/or therapeutic effect of the test treatment under investigation.
Suppose that the commonly considered study endpoint in cancer clinical trials are OS, RR, TTP, and TRSS. Based on these four primary study endpoints, a total of 15 possible endpoints including individual endpoints, co-primary endpoints, and composite endpoints can be derived. That is, 4 single endpoints, i.e. {OS,RR, TTP,TRSS}, six co-primary endpoints, i.e. {(OS,RR), (OS, TTP), (OS, TRSS), (RR, TTP), (RR, TRSS), (TTP, TRSS)}, four composite endpoints (that combine three single endpoints), i.e. {(OS, RR, TTP), (OS,RR, TRSS), (OS, TTP, TRSS), (RR, TTP, TRSS)}, and one overall composite endpoint that combines all single endpoints. In practice, however, it is not clear which of the 15 study endpoints can best inform the disease status and/or measure the therapeutic effect. Some endpoints may be more efficient than others. Moreover, different study endpoints may not translate to one another, although they may be highly correlated to one another. It should be noted that different endpoints may result in different sample sizes required for achieving the study objective with a desired power at the 5% level of significance.
In practice, the traditional approach using single primary endpoints or co-primary endpoints have been criticized not only because it is not clear whether the selected endpoint is the most accurate endpoint for the stated goals of informing disease status and/ or measuring treatment effect. In addition, the selected endpoint does not fully utilize the information collected from all relate study endpoints. To overcome these problems, alternatively, Filozof et al. [4] and Chow and Huang [2] recommended the development of a therapeutic index using a utility function to combine all of the relevant endpoints by assigning different weights based on the degree of evidence observed from individual endpoints.
Development of Therapeutic Index
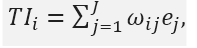
Subsequent to the proposal of Filozof et al. [3], Chow and Huang [2] studied the development of a therapeutic index using a utility function by combining multiple endpoints in clinical trials. The development of a therapeutic index is briefly described below. In a clinical trial, suppose there are study endpoints, denoted by ei, i= 1,…,J. Let
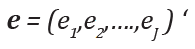
be the clinical endpoints at baseline. The therapeutic index is defined as:
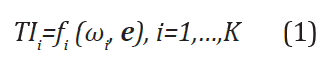
where 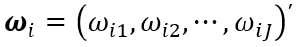 is a vector of weights with ωij
be the weight for ej with respect to index TIi, fi(∙) is a utility (linear
or nonlinear) function for construction of the therapeutic index
TIi based on ωi and e. Generally, ej can be of different data types
(e.g., continuous, binary, or time-to-event) and ωij is pre-specified
(or calculated based on pre-specified criteria), which can be different
and consequently may lead to a different therapeutic index TIi.
Moreover, the utility function typically generates a vector of index
(TI1,TI2,……,TIK)’ and if K =1 it reduces to a single (composite) index.
As an example, consider
is a vector of weights with ωij
be the weight for ej with respect to index TIi, fi(∙) is a utility (linear
or nonlinear) function for construction of the therapeutic index
TIi based on ωi and e. Generally, ej can be of different data types
(e.g., continuous, binary, or time-to-event) and ωij is pre-specified
(or calculated based on pre-specified criteria), which can be different
and consequently may lead to a different therapeutic index TIi.
Moreover, the utility function typically generates a vector of index
(TI1,TI2,……,TIK)’ and if K =1 it reduces to a single (composite) index.
As an example, consider
then is simply a linear combination of the endpoints. If
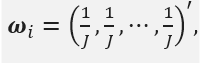
then TIi is the average over all the endpoints.
Practical and Challenging Issues
The development of a therapeutic index sounds reasonable and scientifically justifiable. However, several challenging issues has been raised, which are briefly described below.
Selection of Utility Function
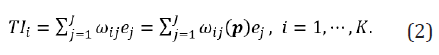
One of the important issues for the development of a therapeutic index is how to select the utility function fi(∙) for construction of the therapeutic index. In practice, fi(∙) could be linear or nonlinear, or with more complicated forms. For simplicity, we consider fi(∙) as linear function here. Thus, (1) reduces to
Study Endpoints with Different Data Types
Another challenge is that the multiple endpoints may be of different data types such as continuous, binary response, or time-toevent data. In order to study the statistical properties of the developed therapeutic index based on these individual endpoints with different data types, we need to specify the distribution of e. In this case, Chow and Huang proposed a unified approach by converting the data into standardized scores before developing the therapeutic index. Based on the standardized scores, we can then assume follows the multi-dimensional normal distribution N(θ,Σ) where

Selection of Weights
For the therapeutic index given in (1), one of the concerns is how to select the weights . The weight of an individual endpoint is an indicator of the amount of information related to safety and effectiveness that this individual endpoint contributes toward the proposed therapeutic index. In practice, there are different ways of specifying the weights (e.g., intuitively based on variabilities associated with the individual study endpoints), although we would like to propose selecting weights based on the p-values observed from individual study endpoints. This is because the observed p-values are indicators of the levels of substantial evidences regarding the safety and effectiveness of the test treatment under investigation provided by the individual endpoints. Specifically, denote θj, j=1,…..,J as the treatment effect assessed by the endpoint ej. Without loss of generality, θj is tested by the following hypotheses:

where  are pre-specified margins. Under some appropriate
assumptions, we can calculate the p-value pj for each H0j
based on the sample of ej and the weights ωi can be constructed
based on
are pre-specified margins. Under some appropriate
assumptions, we can calculate the p-value pj for each H0j
based on the sample of ej and the weights ωi can be constructed
based on

That is,

which is reasonable since each p-value indicates the significance of the treatment effect based on its corresponding endpoint. Thus, it is possible to use all the information available to construct an effective therapeutic index.
Criteria for Evaluation of the Therapeutic Index
Although ej can be of different data types, without loss of generality and for illustration purpose, we assume they are of the same type at this step (e.g., after the study endpoints have been converted to standard scores). On one hand, we would like to investigate the predictability of TIi given that ej can inform the disease (drug) status (effect). On the other hand, we are also interested in the predictability of ej given that TIi is informative. Particularly, we may consider the following two conditional probabilities as criteria for statistical evaluation of the developed therapeutic index:

and

Intuitively, we would expect that P1ij to be relatively large given that ej is informative since TIi is a function of ej, especially when relatively high weight is assigned to ej; on the other hand, P2ij could be small even if TIi is predictive since the information contained in TIi may be attributed to another endpoint ej’ rather other ej.
Concluding Remarks
about 32% (18 out of 57) of oncology regulatory submissions were approved based on a survival endpoint. Amongst the 32% of regulatory submissions, it is not clear what percent of regulatory submissions were approved based on progression-free survival (PFS). In recent years, the FDA appeared to focus on approving regulatory submission based on PSF rather than overall survival. As we discussed here however, the use of PFS alone for evaluation of safety and effectiveness of oncologic drug products, especially immunotherapy cancer drug products, may not be appropriate nor clinically or statistically justifiable. Thus, in pharmaceutical/clinical research and development of a drug product with multiple endpoints, we propose a therapeutic index, which incorporates multiple all relevant endpoints, should be developed whenever possible for a more accurate and reliable assessment of the test treatment under investigation.
References
- Chow SC (2019) Innovative Statistics in Regulatory Science. Chapman and Hall/CRC Press, Taylor & Francis, New York, USA.
- Chow SC, Huang Z (2019) Innovative thinking on endpoint selection in clinical trials. Journal of Biopharmaceutical Statistics 29: 941-951.
- Filozof C, Chow SC, Dimick-Santos L, Chen YF, Williams RN, et al. (2017) Clinical endpoints and adaptive clinical trials in precirrhotic nonalcohotic steatohepatitis: facilitating development approaches for an emerging epidemic. Hepatology Communications 1: 577-585.
- Williams G, Pazdur R, Temple R (2004) Assessing tumor-related signs and symptoms to support cancer drug approval. Journal of Biopharmaceutical Statistics 14: 5-21.
- Zhou J, Vallejo J, Kluetz P, Pazdur R, Kim T, (2019) Overview of oncology and hematology drug approvals at US Food and Drug Administration between 2008 and 2016. Journal of the National Cancer Institute 111(5): 449-458.


 We use cookies to ensure you get the best experience on our website.