Research article

 Creative Commons, CC-BY
Traction Force Mapping of Tractional Retinal Detachments with Optical Coherence Tomography
*Corresponding author: Brent Deibert, Truhlsen Eye Institute, University of Nebraska Medical Center, Omaha, NE, 68105, USA.
Received: July 07, 2020;Published: July 28, 2020
DOI: 10.34297/AJBSR.2020.09.001431
Abstract
Background: The aim of this study is to better understand the mechanical response of the retina to the tractional forces that result in a tractional retinal detachment (TRD) by creating a traction force map using a computational model.
Study Design: A three-dimensional computational model of the retinal-subretinal segment was constructed based on anatomic knowledge and optical coherence tomography (OCT). The traction force map was represented in terms of von Mises stress distribution. Internal review board approval was obtained. Medical records were reviewed by one investigator to limit patient information exposure. Only deidentified OCT images were used in analysis.
Results: Peak stress occurred in the detached retinal layer with the greatest curvature. The highest change in stress occurred at the margin of detachment.
Conclusions: Traction force mapping can be used to quantify the stress occurring in the detached retina. This may be used to improve surgical approach.
Keywords: Retina, Tractional Retinal Detachment, Force mapping, Ocular Coherence Tomography
Abbreviations:TRD: Tractional Retinal Detachment; OCT: Ocular Coherence Tomography; VEGF: Vascular Endothelial Growth Factor; IVFA: Intra- Venous Fluorescein Angiography; RPE: Retinal Pigment Epithelium
Introduction
Diabetes mellitus is a growing global epidemic that affects all ages and is currently the leading cause of blindness in young and middle-aged persons in the west [1]. There are currently 34.2 million people with diabetes in the United States, which represents 10.5% of the population [2]. Diabetic retinopathy results in retinal ischemia secondary to capillary occlusion inducing angiogenic factors such as vascular endothelial growth factor (VEGF) [3]. This induces new blood vessel growth, or neovascularization, from the surface of the retina into the vitreous face [1,3]. The growth of the blood vessels is accompanied by fibrous inflammatory membranes into the retina and creates a tether between the retina and the vitreous. Concurrent hyperglycemia causes disruption of collagen crosslinking and subsequently liquifies the jelly-like substance of the vitreous [4]. Liquefaction of the vitreous causes a contractile force on the vitreous towards the strongly adherent anterior vitreous base. As the vitreous and retina are now tethered together, this contractile force acts against the weak Van der Waal forces that hold the retinal pigment epithelium and retina together. The result of these competing forces is a tractional retinal detachment (TRD) and is, ultimately, a consequence of uncontrolled diabetes mellitus. TRDs can involve the macula or involve only the periphery. There are multiple different grading systems for TRDs, including the Kroll et al. and Zarbin et al. grading systems [1]. Most surgeons will perform surgery when the TRD involves the macula or is highly likely to progress and cause damage to the macula.
The current preoperative workup can include many modalities of imaging and examination: intra-venous fluorescein angiography (IVFA), optical coherence tomography (OCT), B scan ultrasound, and a detailed binocular dilated examination with an indirect ophthalmoscope [1]. Examination with indirect ophthalmoscope gives the surgeon valuable preoperative data in relation to margins and height of the TRD. However, the view of the TRD can be obscured by vitreous hemorrhage and this makes ophthalmoscopy difficult to impossible.
Release of TRD membranes can have many complications that can be time consuming for the surgeon and be detrimental to the patient’s visual outcome. Vitrectomy was required for the treatment of diabetic retinopathy in 5.6% of the patients in the Early Treatment Diabetic Retinopathy Study, and about half of the vitrectomies were preformed secondary to TRD [1,5]. Retinal injury due to iatrogenic causes occurs in 20-60% of cases during TRD operations [1]. One of the intra-operative complications of TRD release is iatrogenic tears, which are thought to be due to detachment propagations. This occurs when traction released in one vector by a suboptimal cut leaves another vector unopposed and creates a tearing force along the retina.
Materials and Methods
Internal Review Board approval was obtained for a retrospective chart review of patients with a diagnosis of tractional retinal detachment (TRD). Medical records were reviewed by one investigator to limit patient information exposure. Only deidentified OCT images were used in analysis. A total of 50 Charts were reviewed for inclusion. Of those 50 charts, 5 were selected based on the amount of the TRD that was captured by the OCT. The retrospective nature of the study dictated that central involving TRDs be used, as peripheral TRDs are usually not captured by routine OCT. A single final image was selected for final stress analysis based on appropriateness of the OCT scan of the TRD.
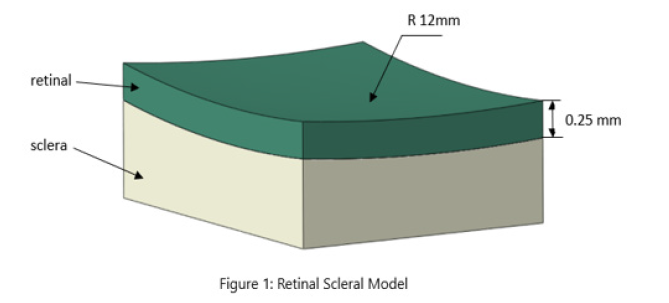
A three-dimensional computational model of the retinal-sclera segment was constructed based on anatomic knowledge and the OCT shown in Figure 1. The radius of the retinal layer was 12 mm, with the thickness of 0.25 mm. A scope of 2 mm × 2.5 mm was selected with the attached sclera. The material properties of the tissue were adopted from our previous work [6]. A three-dimensional reconstruction of an OCT analysis using Zeiss Cirrus 5000 image derived from a patient-specific OCT scan, a traction force was applied onto the surface of the retinal layer involved in the TRD. The traction force map was represented in terms of the von Mises stress distribution within the tissue.
Results
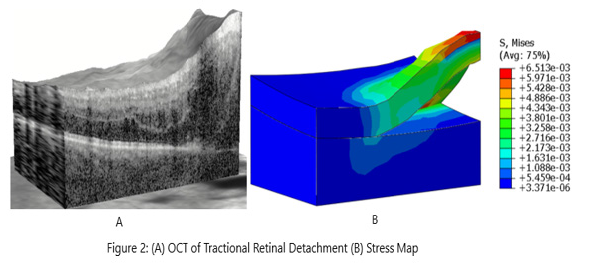
The TRDs assessed with OCT scanning and the corresponding computational simulation are shown in Figure 2. We observed that the traction force caused higher stress in the detached retinal tissue, while there was minimal effect on the undetached tissue. The stress distribution in the retina and sclera with subretinal structures are shown in Figure 3. The von Mises stress showed a peak value at the surface of the retinal layer with the greatest detachment from the sclera and subretinal structures. This peak stress occurred at the point of highest curvature in the detached tissue. There was a large change in stress observed (Δ5.425e-04) at the edge of the detachment margin. This represented 8.33% of the to tal change in stress (Δ6.510e-03) exerted by the TRD. This rapid increase in stress is not represented at any other place in the analysis of the TRD. The stress distribution in the sclera and subretinal structures only showed a higher value at the detachment margin and there was a lower peak value compared to the retinal layer.

Figure 2: (A) Three-dimensional reconstruction from Zeiss Cirrus 5000 of tractional retinal detachment analyzed for analysis. (B) Stress mapping of the same tractional retinal detachment with corresponding Von Mises stress units represented to the right of the analysis.

Figure 3: Separation of forces (A) Retinal layer analysis with corresponding Von Mises stress units represented to the right of the analysis. (B) subretinal layer analysis showing underlying stress imposed on the subretinal layer by the TRD with corresponding Von Mises stress units represented to the right of the analysis.
Discussion
The highest stress values were found at the peak of the detachment. This was expected, as the retinal tissue at the peak of the detachment has the greatest curvature induced by the contracting fibrovascular membranes. There was a sharp increase in stress found at the margin of the detachment in both the retina and the subretinal layers, although the retinal layer showed a more exponential rise in stress than the subretinal layer. This sharp increase may be due to the persistent opposition of van der Waals forces against the traction forces of the TRD. You might expect that when the cells of the retinal pigment epithelium (RPE) and the retina are in closer proximity that the van der Waals forces may exert a greater oppositional force. The stress values in the subretinal structures and sclera demonstrated a more gradual increase compared to the retinal layer. The sclera and subretinal tissue may have been better able to distribute the forces at play due to the natural elasticity of the collagen matrix that composes it. The higher change in stress at the detachment margin may indicate a potential plane for detachment propagation if a suboptimal cut is performed. The area of the highest curvature at the superior point of the detachment may also represent a potential propagation plane because it represents the point of highest stress in the TRD.
Future Directions
This study represents the preliminary stage of force traction mapping and will need more data to assess the validity of the analysis. Utilization of this technique for preoperative or intraoperative planning could improve outcomes of TRD release by optimizing the surgical approach and reducing iatrogenic tears. Force traction maps could also be used as visual aids to improved patient education. This is because they are more visually simplistic than a standard OCT scan of a TRD.
No conflicting relationship exists for any author: BD, PD, CH, LG
Financial Support
None
References
- Iyer SSR, Regan KA, Burnham JM, Chen CJ (2019) Surgical management of diabetic tractional retinal detachments. Survey of Ophthalmology 64(6): 780-809.
- (2020) Center for Disease Control and Prevention. National Diabetes Statistics Report. Services USDoHaH, Atlanta, GA, USA.
- Newman DK (2010) Surgical management of the late complications of proliferative diabetic retinopathy. Eye (London, England) 24(3): 441-449.
- Sebag J (1987) Age-related changes in human vitreous structure. Graefes Arch Clin Exp Ophthalmol 225(2): 89-93.
- Flynn HW Jr, Chew EY, Simons BD, Barton FB, Remaley NA, et al. (1992) Pars plana vitrectomy in the Early Treatment Diabetic Retinopathy Study. ETDRS report number 17. The Early Treatment Diabetic Retinopathy Study Research Group. Ophthalmology 99(9): 1351-1357.
- Hua Y, Tong J, Ghate D, Kedar S, Gu L (2017) Intracranial Pressure Influences the Behavior of the Optic Nerve Head. Journal of Biomechanical Engineering 139(3).


 We use cookies to ensure you get the best experience on our website.