Research Article 
 Creative Commons, CC-BY
Child Height Development in the Past Half Century in North East Asia: Animal Protein and Other Essential Nutrients
*Corresponding author: Hiroshi Mori, Professor Emeritus, Senshu University, Chiyoda-ku, Tokyo, Japan
Received: January 01, 2021; Published: February 01, 2021
DOI: 10.34297/AJBSR.2021.11.001676
Abstract
Economies in North-East Asia made rapid progress after WW II. Japan was the first-runner, followed by South Korea with some two-decade-lag due to the Korean War (1950-53). As the standard of living, food supply in particular, improved, children grew taller in height unprecedentedly, by more than 10cm in a half-century. Male teens in Japan were 2-3cm taller in mean height than their Korean peers in the 1960-70s but ceased to grow any taller in the early-1990s, whereas Korean teens kept growing taller vigorously, to overtake their Japanese peers by 3cm in the mid-2000s and then ceased to grow taller afterwards. Economy in South Korea has kept very prosperous toward the end of the 2010s and supply of animal-sourced foods kept increasing steadily. When growth patterns of boys’ height from 1st graders in primary school to seniors in high school examined for the two countries, velocity began to decline steadily in South Korea in the early-2000s, to be appreciably slower than their Japanese peers toward the end of the 2010s. As pre-school boys in South Korea were significantly taller than their Japanese peers in the mid-2000s, Korean teens were still taller than their Japanese peers in the end of the 2010s, but it could be predicted that the height advantage of Korean teens over their Japanese peers would not last in the future decades.
Children in Japan ceased to grow taller in height in the 1990s, because they started to turn away from fruit at-home consumption a decade ago in the late-1970s. Younger cohorts in South Korea started to steer away from vegetables at their household consumption drastically in the mid-1990s. It is suspected that a drastic reduction in vegetable consumption by growing children and pregnant mothers may have resulted in slower growth in child height, as observed in South Korea since the early-2000s.
Keywords: Child height, Growth velocity, South Korea, Japan, Vegetables and fruit
Stature is a net measure that captures the supply of inputs to health (Steckel, 1995) [1].
Introduction
People in North-East Asia are distinctly different from those in North-Central Europe, Africa, and Mid-East Asia in respect of head structure, hair/eye color and complexion: racial features. People in China, Korea and Japan may not be the same, different by place they live in the country, living standard they take by place and periods, but can be assumed similar in genetical endowments, although individuals differ significantly. Compared by age, schoolboys in Japan were appreciably taller than their Korean peers in the earlier years, the 1960s through the mid-1980s. In respect of per capita GDP, Japan was significantly wealthier than South Korea (table 1) and per capita supply of animal sourced foods was much greater in Japan than in S. Korea then (table 2). As people’s living standards improved, children began to grow taller in height in North East Asian countries. But people can’t be Giraffe. Similarly, Asians can’t be Caucasians in hair color or head structure but could be close to Caucasians in stature, if “the supply of inputs to health” were adequate in the long-run (tables 1,2 and 3).

Table 1: Changes in per capita real GDP, Japan and South Korea, 1970 to 2017.
Changes in mean height of schoolboys by age, South Korea and Japan, 1970 to 2017.

Table 2: Changes in mean height of schoolboys by age, South Korea and Japan, 1970 to 2017.
Sources: School Health Surveys, Dept. Education, respective country.
Note 3:
year moving average, as 2000=average (1999:2001)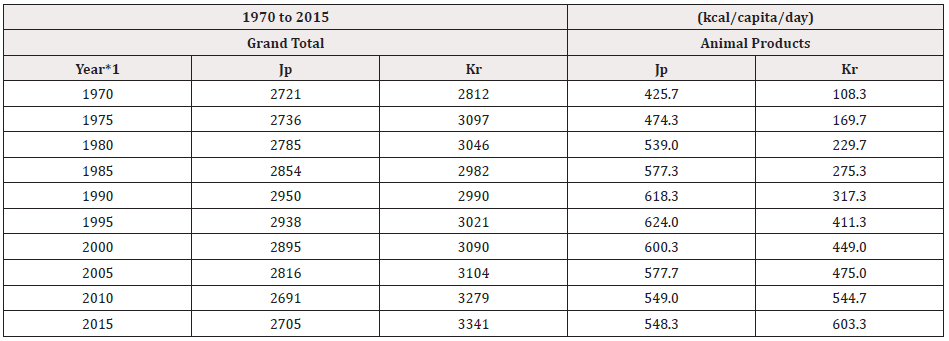
Table 3: Changes in per capita caloric intakes: all foods and animal products, Japan and S. Korea; 1970.
Notes: *1 3-year moving average.
Sources: FAOSTAT, Food Balance Sheets, Old and new.
Speaking of body height, there should be some potentials, if not rigidly fixed. If your male children eat properly by advices of dieticians, get adequate sleep and play sports, they will grow to be 180cm tall, not by chance, in the case of average Asian couples today. A 175cm in height in senior grade, high school should not be a hard goal for your sons to attain for your sons to attain. Senior high school boys have been fixed in mean height at 170.5cm since the early-1990s in Japan and their Korean peers have not exceeded 173.5cm in mean height since the mid-2000s. As a food economist, specialized in demand analyses, the author has been suspecting that food consumption, “the inputs to health” for growing children have been somewhat inadequate either in Japan since the early 1980s or South Korea since the mid-1990s [2-4].
Data
In the realm of human-biology, “the first 1,000 days” are critical for determining future stature [5-7]. Cole and Mori, analyzing secular trends in child height in Japan and South Korea by SITAR, concluded: “most of the increment seen in adults had already accrued by age1.5 years” [8]. Japan’s national nutrition surveys publish mean height of boys and girls by age from 1 to 19, every year since 1946. But the size of samples, 6 years old boy in 2000, for example, is not large (54) to allow for quite large SD (4.7 for mean height of 117.6cm) [9]. The more comprehensive health and nutrition survey was initiated in South Korea only in the year of 1998, followed by the second one in 2001 [10].
The nationwide school health surveys have been conducted by the Ministry of Education in Japan every year since 1900 and the similar nationwide surveys have been conducted by the Department of Education in South Korea, the published data of which since 1961 are available to the author [11-12]. The Korean version of school surveys cover 1st graders in primary school, 6 years of age to seniors in high school, 17 years of age, conducted in the first month of every school year, March. The surveys are nationwide and large in sample size but year to year fluctuations are not negligibly small, when we talk about one 10thcm annual differences, we use three year moving averages for all the age groups over the entire period, like Hit = average (Hit-1: Hit+1), where i denotes age and t the survey year (A).
As regards food supply/consumption, national nutrition surveys provide per capita intakes of various food groups, based on 24 hour-recall surveys of selected households and individuals by age groups in recent years, but Korean version of nutrition surveys are only available for the year of 1998 for the first time and 2001 and 2005 as the second and third years [9,10]. FAOSTAT, Food Balance Sheets, the United Nations, publish per capita supply of various food groups, in terms of per capita kg/year and per capita kcal/day, by country, every year since 1961 [13]. Ministry/Department of Agriculture, governments of Japan and Republic of Korea, publish Food Balance Sheets, every fiscal year for more than a half century since 1960 [14,15], which will be referred, if necessary. For the sake of international comparison, FAOSTAT should be safer for consistent, unbiased references.
A. Less than half of female middle school graduates went into high school education before the 1980s in the Korean society. Mean height of female high school students during the earlier years of this study are presumed to be a couple of centimeters taller, upward biases than the national averages by age groups. This study analyzes only male students for this reason.
Secular trends in hight of children in the past half century
Japanese and South Korean schoolboys will be compared in height over the past half century from the mid-1960s to 2018, at the age of 1st grade of primary school, 1st grade of middle school and 3rd grade of high school, 6, 12, and 17 years of age, measured in March in Korea and April in Japan, respectively. Twelfth of 6 years of age registered as 1st graders of primary school should be actually 7 years old at most, depending on the days of the surveys conducted. As mentioned earlier and shown in table 3, Japanese boys were taller by 2-3cm than their Korean peers at all ages in the 1970s to 1980s, caught-up by the latter in the 1990s and taken over in the mid-2000s and no further changes in mean height, regardless of age groups, are observed afterwards. Korean boys became taller by 3-4cm at all ages than their Japanese peers in the latest two decades (table 3).
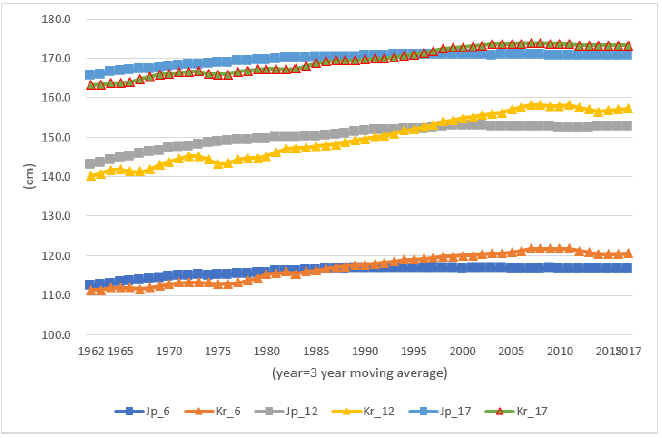
Mean height of schoolboys 6,12,17 years of age, respectively in Japan and South Korea are plotted every year from 1962 to 2017(3-year moving average, like: 1971= (1970+1971+1972)/3) in (figure 1). The youngest group, 1st graders in primary school of Korean boys first caught-up their Japanese peers in the 1980s, when their older age groups, 1st graders in middle school and seniors in high school were still 2-3cm shorter than their Japanese peers. 1st graders in primary school in Korea started to surpass slightly their Japanese peers in the end of the 1980s and the older groups, 1st graders in middle school and senior graders in high school were about equal in mean height in the 1990s as their Japanese peers, who ceased to grow any taller then. Korean schoolboys at any grades kept growing taller vigorously during the 1990s and early-2000s to be 3-4cm taller than their Japanese peers in the mid-2000s and then ceased to grow any taller afterward. National economy in Japan has been dull since the early 1990s but Korean economy kept very prosperous throughout the end of the 2010s (table 1). As was often the case with developed countries, Japan may have attained her racial potential in height at 170.5cm in the early-1990s and South Korea at 173.5cm in the mid-2000s, respectively. Very smooth lines of height growth by age over the past half century for the two countries shown in figure 1 seem to verify the above contention: i.e., racial potentials (figure1).
The author was 165cm tall, when younger. He has two sons, both of whom are 175cm, seemingly slightly taller than their contemporaries. The author was hungry all the way from primary-school through high school days. His sons did not eat plentiful animal-sourced foods but never experienced every day hunger. One of them has a son, college junior, 180cm tall, who is substantially taller than his classmates, but apparently shorter than his college basketball players. He was a baseball player in junior-senior high schools, who ate much more foods, slightly more meat and substantially more rice than his father. This personal observation by the author may represent the current middle-class family living standards in Japan. The only difference, if any, between Japan and South Korea, may be that competition for college entrance examinations looks severer in Korea than in Japan, i.e., after-school private-class lessons are longer to require additional meals to regular supper.
As remarked above, figure 1 provides quite normal growth trends in secular height of school boys in biologically similar, well developed nations, which can be extrapolated into the near future years. As the economy grew and living standard improved, children grew taller in height but did not change any further, after having attained a sort of racial potentials, Japanese approximately at 170.5cm and Koreans likewise at 173.5cm, respectively. If they eat more, they would simply gain in weight, to higher BMI (B). This view may represent what most people, professional or non-professional, are conceived with the height of children either in Japan or South Korea in the recent decades.
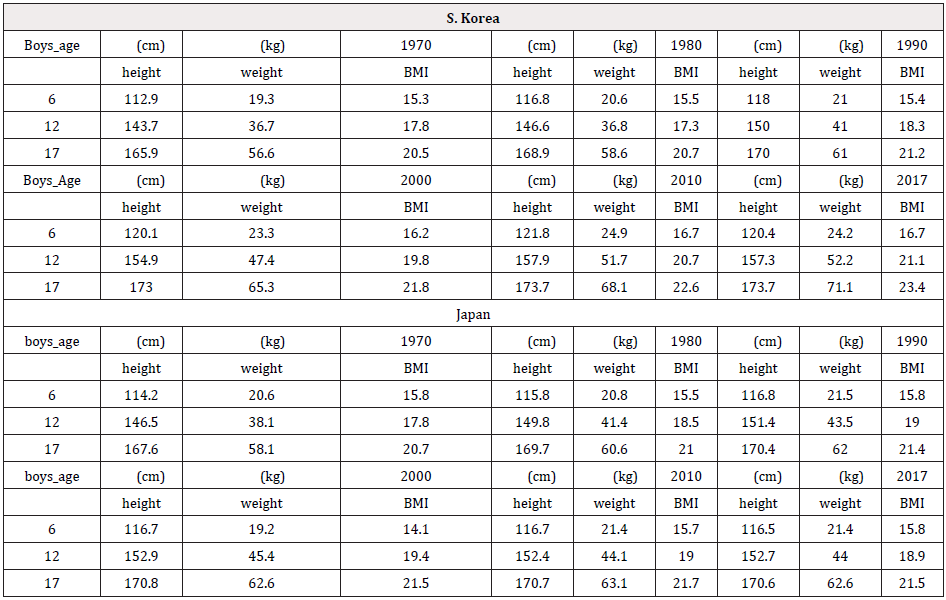
B. Changes in BMI by age groups 6,12 and 17 years old, Japanese and Korean schoolboys from 1970 to 2018 suggest that school children both in Japan and South Korea have not increased appreciably in BMI over the survey period from 1970 to 2018 (Appendix Table 1).
Changes in growth velocity in the two countries over the past few decades
Some three years ago, the author noticed that children in Korea seemed to grow much faster in their adolescence than their Japanese peers, although the data were limited, i.e., years of observation were too few and the surveys were not uniform between the two countries. Starting a year and half ago with the larger data available, the author learnt by himself (C) to introduce the apparatus of growth velocity into the comparative analyses of child height developments in Japan and South Korea [4,16,17].
High school seniors in 2000, for example, were born in 1983, 1 year old in 1984, primary 1st graders, 6 years old in 1989, middle school 1st graders in 1995 and so on. No one grows from 6 years of age to 17 years of age instantly in the same year, say 2000. In measuring growth velocity from primary 1st graders, 6 years of age to high school seniors, 17 years of age in any selected year, the same birth cohorts should be traced, i.e., mean height of 6 years of age in 1989 should be matched to that of 17 years of age in 2000. Drawing growth curves, plotting different ages observed in the same year can barely be a close proximate, or might distort the real picture [18].
Figure 2 shows changes in growth velocity from 6 to 17 years of age of Japanese and South Korean school boys, respectively from 1995 to 2017: mean height of 1st graders in primary school in 1984 to be deducted from that of high school seniors in 1995, the same birth cohort traced. The upper left on the line of Korean boys, 55.0cm in 1995 manifests the composite environmental influences the cohort born in 1978 in Korea underwent from 1st grade in primary school in 1984 to senior grade in high school in 1995. The corresponding velocity for Japanese boys at age 17 in 1995 is 54.5cm, 0.5cm less or slower than their Korean peers. The velocity for Korean boys increased gradually to 55.5cm in 2002, whereas that for Japanese boys declined slightly to 53.9cm in the same period. Japanese school boys grew by 53.9cm from 1st grade in primary school in the early-1990s to senior grade in high school in the early-2000s, 1.6cm less than their Korean peers over the same period. Korean school boys, however, started to decline steadily in growth velocity to 52.1cm in 2017, whereas their Japanese peers have kept almost constant in growth velocity at 54.0cm over the same period. Japanese school boys had grown by 54.0cm from primary 1st grade in 2005 to high school senior grade in 2017, the final survey year, 1.8cm greater than their Korean peers. It should be noted that the Korean schoolboys in high school senior grade were still 173.5cm in mean height, 3cm taller than their Japanese peers in the late-2010s, because preschool boys had grown taller already before the mid-2000s (figure 2,3).
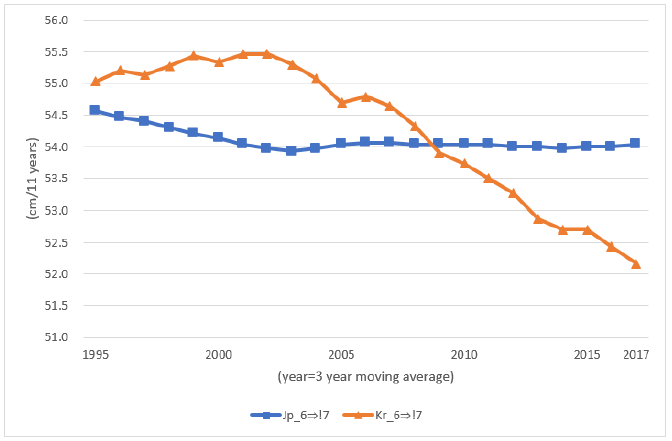
Figure 2: Changes in growth velocity from 6 to 17 years of age, Japanese and Korean schoolboys, 1995 to 2017: birth cohorts traced.
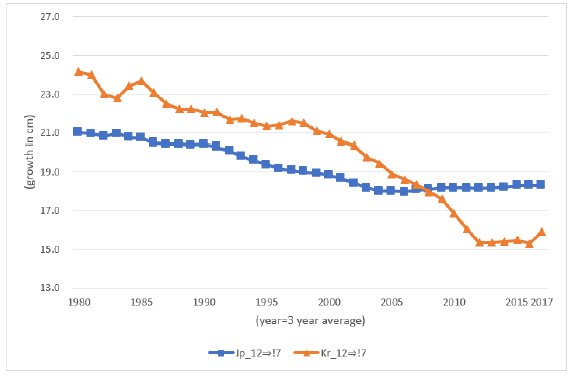
Figure 3: Changes in growth velocity from 12 to 17 years of age, Japanese and Korean schoolboys, 1980 to 2017: birth cohorts traced.
As mentioned earlier, children in Korea seem to grow faster in adolescence than their Japanese peers. With the presence of nationwide, consistent data, figure 3 is constructed to ascertain the author’s presumption, to compare the growth velocity of schoolboys from middle school 1st graders, 12 years of age to high school seniors, 17 years of age in the two countries over the little, longer period, from 1980 to 2017. High school seniors in 1980 were born in 1963, and middle school 1st graders in 1975. Upper left of Korean line, 24.2cm represents the growth in height of middle school 1st graders in 1975 to high school seniors in 1980.
When minor fluctuations ignored, Korean schoolboys grew by 2.0-2.5cm faster than their Japanese peers in velocity from 1st grade in middle school to senior grade in high school for more than two decades from 1980 to the early-2000s. The growth velocity in adolescence from 12 to 17 years of age was highest in the same year, 1980 in the two countries, 24.2cm for South Korean boys and 21.0cm for Japanese boys, respectively. The striking difference between the two countries is that the growth velocity fell mildly from 21.0cm in 1980 to 18.0cm in 2004 and then leveled off afterwards in Japan, whereas the velocity fell drastically from 24cm in the first-1980s to 15.2cm in 2012 and levelled off afterward in South Korea. The Korean boys grew nearly 3cm slower in adolescence than their Japanese peers in the mid-2010s. When high school seniors are compared in the final survey year of 2017, South Korean boys were 173.5cm, 3.0cm taller than their Japanese peers, as repeatedly mentioned.
The author realized the biological fact that one year-old in1990 aged to 6 years old in 1995, and 17 years old in 2006 in turn.
Changes in stature as net measures of inputs to health
Teens in Japan were 2-3cm taller than their Korean peers in the 1960-70s, when per capita consumption of animal products in Japan was significantly greater than in Korea, as mentioned earlier (table 2). Children in Japan ceased to grow any taller at all ages in the early-1990s, whereas children in Korea kept growing taller vigorously at all ages in the 1980-90s and teens in Korea outgrew their Japanese peers by 3.5cm in the mid-2000s. In respect of consumption of animal products, Japan was twice as much as South Korea in terms of per capita caloric intakes from animal products3) in 1990(1989-91average) and even 22% grater in 2005, when Korean teens outgrew Japanese teens by 3cm, as remarked repeatedly.
Japanese children ceased to grow taller in height in the late-1980s, when consumption of animal products was high and still increasing. Korean children ceased to grow taller in height in the mid-2000s, when per capita consumption of animal products was still increasing conspicuously (table 3). Matthias Blum states that “a high consumption of animal proteins alone does not result in increasing body heights if the overall consumption of other essential nutrients is insufficient” [19,21]. White Paper on Agriculture, 1994, Japan remarked a concern on wakamonono no kudamaonbanare (steering a way from fruit by the young), without explicit implications on its outcomes [20]. Tanaka and Mori, 2003 and Mori and Stewart, 2013 endorsed the White Paper with refined statistical approaches, for the reliable cohort predictions [21,22]. The newer cohorts have continued to turn away from fruit in their at-home consumption. The newer generations in the latest decades in Japan have further reduced their fruit consumption (table 3).
On the basis of Household Income and Expenditures, classified by age groups of household head, Statistics Korea [23], the author discovered that the newer generations in South Korea started to steer away from vegetables in at-home consumption in the early-1990s and children in growing ages, 0~9, 10~14, 15~19 ate only 10% of vegetables as those older cohorts in their 50s in the end of the 2010s (table 4). Children in Japan ceased to grow taller in the late-1980s and their Korean peers also ceased to grow taller in the early-2000s. Children in growing ages in Japan started to turn away from fruit in the end of 1970s and those in South Korea started to steer away from vegetables in the early-1990s. With little background in nutritional sciences, the author has been presuming intuitively that fruit/vegetables may contain essential nutrients for child height growth. Casually observing students at university-cafeterias both in Japan and South Korea since the mid-1990s through the mid-2010s, the author had conceived that students in South Korea ate much more vegetables, mostly in the form of Kimchi, than their Japanese peers, some of whom take small pieces of tsukemono, pickles. The young in Japan do not care for fruits and also vegetables [24], (tables 4,5).

Table 4: Changes in per capita household expenditures by age groups, 1990 to 2019.
Sources: Derived in current won from Kr Household Expenditure Surveys by Mori by means of the TMI model. KREI, Food Balance Sheet various issues, for per capita supply.

Table 5: Per capita expenditures on dairies by age groups of household members by age groups, S. Korea, 1990 to 2015 (in 2015 Won).
Nationwide school lunch programs were launched in South Korea for all primary schools in the late 1990s and for middle schools and high schools in the early 2000s [25]. Japan started school lunch programs in the 1950s. In both countries, milk has been the key element of their school lunch feeding. Korea’s Household Expenditures Surveys publish expenditures on “dairy”, without further classifications, fluid milk, yoghurt, butter, cheese, etc. like in Japan’s Family Income and Expenditure Surveys [26]. Assuming that fluid milk should account for the major expenditures for “dairy”, household expenditures on “dairy” have been decomposed into expenditures by individual household members by age groups (table 5). In sharp contrast with vegetables, children in South Korea consume substantially more milk than older adults in their 40s and 50s. Statistically, there are no signs to show that Korean children have been steering away from milk at home consumption in the past decades as is the case with vegetables.
D) The term used in Food Balance Sheets, FAOSTAT.
Brief Conclusions
In the past half century, Japan and South Korea made steady economic progress, accompanied by remarkable improvements in standard of living. Teens in Japan ceased to grow taller in the end of the 1980s and teens in Korea kept growing taller to overtake their Japanese peers in mean height by 3.0cm in the mid-2000s but then also ceased to grow any taller afterwards, when the national economy still kept growing vigorously. Supply of animal protein fails to explain these failures in statue growth in the two countries. The author discovered one thing in common in the two countries, i.e., children in growing ages started to turn away from fruit in the end of the 1970s in Japan to eat barely 10% of fruit, as compared to the older adults in the mid-1990s and likewise children in South Korea started to turn away from vegetables in the early-1990s to eat less than 10% of vegetables, as compared to those in their 50s in the mid-2010s.
It is surmised that vegetables/fruit should contain essential nutrients for child height developments. Per capita consumption/ supply, as provided by food balance sheets, FAOSTAT, or Department/ Ministry of Agriculture, individual countries, does not identify the changes in individual consumption by age groups, in the presence of cohort effects in consumption of staple food groups, such as rice, vegetables and milk [27-29]. Developments in human height are determined by supply of inputs to health, food supply before children reach the age of maturity. When we analyze any association between food consumption and child height development, it is advisable to identify food consumption by age groups, i.e., growth stages in stature [30-31].
Appendix
References
- Steckel RH (1995) Statue and the Standard of Living. Journal of Economic Literature 33(4): 1903-1940.
- Mori, Hiroshi (2018) Secular changes in child height in Japan and South Korea: Consumption of animal proteins and ‘essential nutrients’, Food and Nutrition Sciences 9(12): 1458-1471.
- Mori, Hiroshi, Sanghyo K (2020) Child height and food consumption in Japan in the past century in comparison with South Korea: Animal protein and other essential nutrients. Global J Medical ResearchVersion 20(1): 1-8.
- Mori, Hiroshi (2020) Secular changes in boys’ height in South Korea: comparison with Japan. particularly with respect to growth velocity. J Food Nutr 4(6): 1-7.
- Cole TJ (2012) The development of growth references and growth charts. Annals of Human Biology 39(5): 382-394.
- Deaton A (2007) Height, health, and development. PNAS 104(33): 13232-13237.
- Prentice A, Ward K, Goldberg C, Jarjou L, Moor S, et al. (2013) Critical windows for nutritional interventions against stunting. Am J Clin Nutr. 97(5): 911-918.
- Cole T, Hiroshi M (2017) Fifty years of child height in Japan and South Korea: Contrasting secular trend patterns analyzed by SITAR, American J Human Biology 30(1): e23054.
- Japanese government, Ministry of Health and Welfare, National Nutrition Survey, on the internet.
- Republic of Korea, Korea Center for Disease Control and Prevention. Korea National Health and Nutrition Examination Survey (KNHANES).
- Japanese government, Ministry of Education, School Health Examination Survey, various issues.
- Republic of Korea, Department of Education, Center for Educational Statistics, Statistical Yearbook of Education, various issues. 9(12): 1.
- FAO of the United Nations. FAOSTAT, Food Balance Sheets, by country and year. online.
- Japanese government, Ministry of Agriculture, Food Balance Sheets, various issues.
- Republic Korea government, KREI, Food Balance Sheets, various issues.
- Mori H (2020) Comparative analysis of height growth velocities of school boys in South Korea and Japan in the past 50 years, Food and Nutrition Sciences 11(7): 859-868.
- (2020) Secular changes in boys’ height in South Korea, comparison with Japan, particularly respect to growth velocity. J Food Nutr 6: 1-7.
- Gao P, Erick S (2020) The growth pattern of British children, 1850 to 1975, The Economic History Review: 1-31.
- Blum M (2013) Cultural and genetic influences on ‘the biological standard of living’. Historical Method 46(1): 19-30.
- (1994) Japanese government, Ministry of Agriculture, Forestry and Fisheries (1995) White Paper on Agriculture Tokyo.
- Tanaka M, Mori H (2003) How will consumption of fresh fruit change in a rapidly aging society of Japan, Agriculture and Horticulture 78(8): 845-850
- Mori H, Stewart H (2011) Cohort analysis: Ability to predict future consumption-The case of fresh fruit in Japan and rice in Korea, Annual Bulletin of Social Science, Senshu University 45: 153-173.
- (1990) Republic of Korea, Statistics Korea, Household Income and Expenditure Survey.
- Mori H (2019) Why did Japanese children cease to grow taller in height in the midst of a booming economy in contrast with South Korean youth? Annual Bulletin of Social Science Senshu University (53): 223-240.
- Dewa T (2013) School lunch programs in practice in South Korea. Ryukoku University Review 481: 26-45 (in Japanese).
- Japanese government, Bureau of Statistics, Family Income and Expenditure Survey.various issues.
- Mori H, Lowe E, Everett G, Dennis L, Clason, et al. (2000) Cohort analysis of food consumption: A case of rapidly changing Japanese consumption. IFAMR 3(2): 189-205.
- Gustavsen GW, Rickertsen K (2013) Consumer cohorts and purchases of non-alcoholic beverages. Empirical Economics.
- Mori H, Inaba T, Dyck J (2016) Accounting for structural changes in demand for foods in the presence of age and cohort effects: the case of fresh fish in Japan. Evolut Inst Econ 13(2): 363: 379.
- Tanaka M, Mori H, Inaba T (2004) “Re-estimating per capita individual consumption by age from household data.” Japanese J Rural Economics 6: 1-11.
- Mori H (2020) Structural changes in food consumption and human height in East Asia, LAMBERT Academic Publishing. Berlin: 1-156.



 We use cookies to ensure you get the best experience on our website.