Research Article 
 Creative Commons, CC-BY
Secular Changes in Relative Height of Children in Japan, South Korea and Taiwan: Is “Genetics” the Key Determinant?
*Corresponding author: Hiroshi Mori, Professor Emeritus, Senshu University, Chiyoda-ku, Tokyo, Japan, Email: the0033@isc. senshu-u.ac.jp
Received: August 13, 2019;Published: August 28, 2019
DOI: 10.34297/AJBSR.2019.04.000857
Abstract
At age 20 years, Korean men were recorded as being 2 cm taller than Japanese but 3 cm shorter than Taiwanese in the beginning of last century [1], when Korea and Taiwan were under Japan’s colonization. These differences could have been attributed mostly to genetics. At the turn of the century, Japan’s economy was the richest and Taiwan was 60% greater than S. Korea in per capita consumption of animal products. Yet Korean males were slightly, by 1-2 cm taller than their Taiwanese peers in height. Genetics was no longer a strong explanation of relative height. Following Blum [2], a high consumption of animal proteins does not result in increasing body height if overall consumption of calories and other essential nutrients is insufficient. This paper tries to identify what essential nutrients may have been insufficient in Japanese and Taiwanese food consumption, particularly among growing children.
Keywords: Child height; Growth pattern; Essential nutrients; Genetics; Japan; South korea; Taiwan
Introduction
In the early 20th century, at age 20 years, Taiwanese men were nearly 3 cm taller in mean height than Koreans, who were 2-3 cm taller than Japanese in turn [1]. Since the mid-last century to the early current century, youth in Japan grew appreciably taller in height, as much as 10 cm but were shorter than South Koreans*1 by 3 cm in the mid-2000s [3,4]. The per capita GDP of S. Korea was approximately 30% lower than that of Japan at that time. Earlier, in the mid-1990s, when S. Korea’s per capita GDP was only one third that of Japan [5], S. Koreans were already 2 cm taller than Japanese. Are these differences in body height between the two countries to be attributed, primarily, to differences in genetics? Intuitively, the answer should be “yes, very likely” [6]. As mentioned above, Koreans were nearly 3 cm shorter than Taiwanese in 1890-1930. However, S. Koreans were, almost the same in height as Taiwanese in 1960-70 and then 1 cm taller than the latter in 1980-1990, as to be described below*1.
With respect to the influence of per capita GDP (in Purchasing Power Parity Value), Taiwan was consistently 20-30% richer than S. Korea in the period of 1960-90 [7]. According to a small-scale longitudinal sample survey of school children in Taipei, Taiwan, from 1994 to 1997, high school male 3rd graders, age 17-18 years, are recorded at 171 cm in mean height in the mid-1990s [8]; this is slightly shorter than their S. Korean peers at that time. It would be misleading to attribute differences in mean height between the nations observed at a given time to genetics alone. Did Taiwan substantially exceed Korea in respect of ‘biological standard of living’ [2] in the beginning of the last century? No reliable direct data are available. The two countries were both under Japan’s colonization at that time. It may be worth noting here that infant mortality rates, which are regarded as one of the key correlates of adult height [9-11], declined from 53-56 per 1,000 in 1960 to 10.2 per 1,000 in 1990 in Taiwan, while they also declined similarly from 60 per 1,000 to 8-10 per 1,000 in S. Korea during the same period[12].
The question to be raised is: What prevented teens in Taiwan from growing another few centimeters taller during the period from the 1960s to the 2000s? This question seems as relevant as to explore the case of Japan vs. S. Korea [3,4,13], because Taiwan-ese youth were a few cm taller than their Korean peers a century ago*2 under Japan’s colonization. According to National Nutrition Surveys [14] by Japanese government, through Ministry of Health and Welfare, men in their 40s in 1949-51 were 159 cm tall and men in their 50s were 158 cm, respectively, in Japan, implying that Japanese men in their 20s in the 1920-30s were slightly shorter than 160 cm, i.e., 1 to 2 cm shorter than their Korean peers at that time. Korean youth were reported to be 161-2 cm in mean height in the 1920-30s, although the surveys were not nation-wide and limited in sample size [15]. It seems plausible that Koreans were 1-3 cm taller in mean height than Japanese in the pre-war era.
In the post-war period, Japanese men at age 20 years in 1960 and 1980, cohorts born in 1940 and 1960, respectively, are reported to be 162.6 and 165.7 cm tall in the data provided by [1] cited above, as compared to 165.1 and 169.6 cm for school boys at age 17-18 years in the corresponding years, as reported in School Health Surveys, based on nationwide samples by Japanese government Ministry of Education [16]. Steckel states, “Stature is a net measure that captures the supply of inputs to health” [17-19]. The author, a food economist, has been tackling the differences in growth patterns of child height in Japan and S. Korea covering the past half century, mainly from the perspective of “supply of inputs to health”, predominantly food consumption.
Foot Note
*1 At the end of WW II, Korea was divided into two countries, the Republic of Korea (South Korea) and Democratic People’s Republic of Korea (North Korea).
*2 According to [18,19] there remains little question that Taiwanese youth at age around 20 years were close to 165 cm tall in mean height in 1920- 1930 under Japan’s occupation.
Data
Japanese government, through Ministry of Health and Welfare has been conducting the National Nutrition Surveys [14], over the entire nation every year, beginning shortly after the end of WW II. The mean height and weight of survey subjects are reported by age groups, 1 to 25 years disaggregated by one-year interval, and age groups, 26-29, 30-39, ---, 60-69, 70~ years. For its part, South Korean government initiated a wide-scale, extensive health and nutrition survey, KNHANES [20], in 1998, followed by the 2nd one in 2001, and the 3rd one in 2005*3. In addition, Japanese government, through Ministry of Education has been conducting the Scholl Health Examination Surveys [16] since the start of the last century, in which the mean height of school children from elementary school 1st graders (6 years+*4) to senior high school 3rd graders(17years+*4) is reported. Likewise, S. Korean government, through Department of Education, has been conducting the similar school health surveys since 1960 [21]. However, these school surveys in neither country cover the ages from 1 to 5 and 18 to 20 years but are based on large nationwide samples. It is widely held in the profession that the first years of life, “1000 days”, are crucial in determining future adult height [22-24].
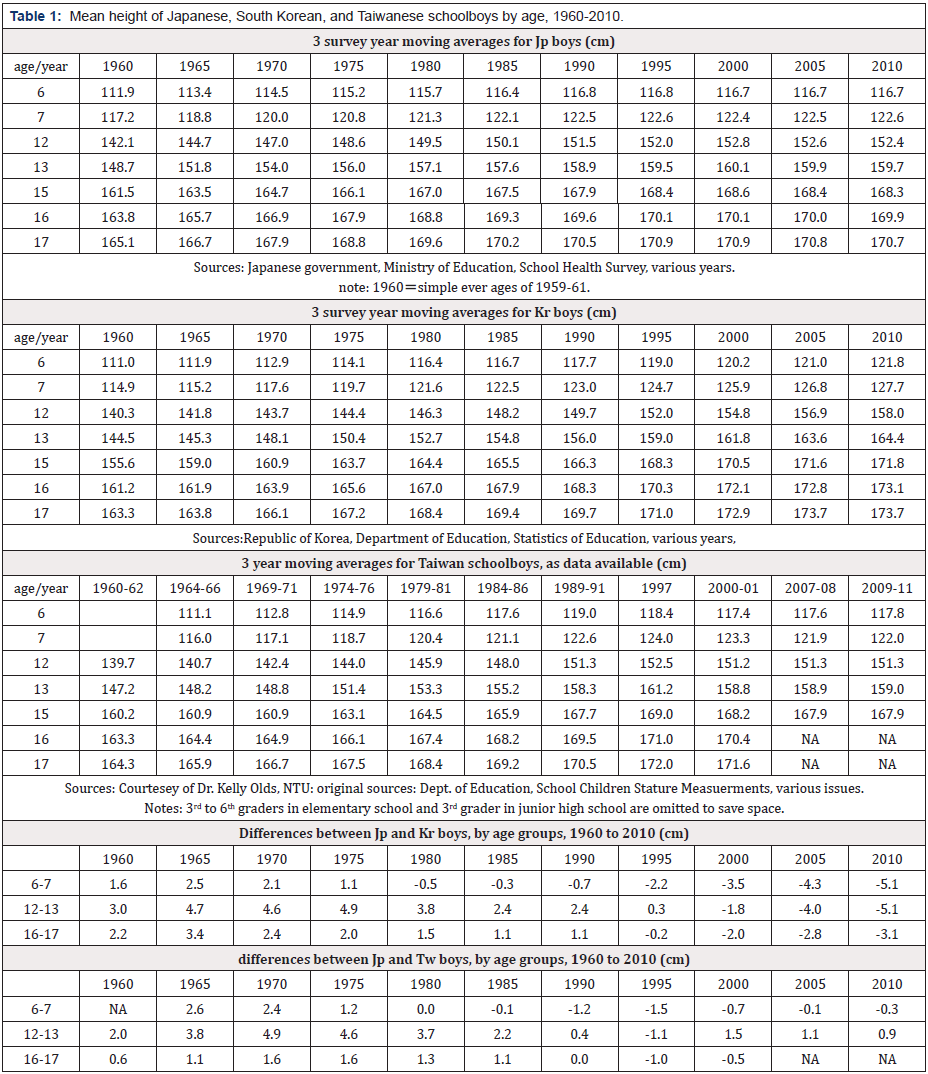
Therefore, school health surveys in both countries have some limitations, which should be kept in mind. Mean height of those in high school in the earlier period of our survey, the 1960s in particular, may not represent the same age groups in the entire population, because the rate of enrollment in senior high school was 58% in 1960, as compared to 92% in 1975 in Japan, whereas the corresponding rate was as low as 20.3% in 1970 but sharply rose to 79.4% in 1990 in S. Korea and 43.2% in 1976 and 72.9% in 1991, respectively in Taiwan [7]. compiles changes in mean height of boys from elementary school 1st graders to high school 3rd graders in Japan, S. Korea and Taiwan from 1960 to 2010 by 5-year intervals. The data are based on the school health surveys mentioned above. In order to smooth the annual fluctuations*5 in the original data (available to the author), simple 3 year moving averages are provided in Table 1(e.g., 1970 = average (1969:1971)). Despite the statistical likelihood that mean height of high school students in S. Korea and Taiwan as well in the earlier years of our investigation, specifically the 1960s and 1970s, could be slightly greater than the national averages then, Japanese school boys at age 17 years were 2-3 cm taller than their S. Korean and Taiwanese peers in the 1960s through the 1970s. It is estimated that the Taiwanese male high school students were slightly taller in mean height than their Korean peers in the 1960s through the 1980s, (refer to Table 1).
Economic growth naturally plays a role. Japan’s economy had recovered to the pre-war level in 1955 [25] and made rapid and steady progress until the “bubble burst” in the beginning of the 1990s. The South Korean economy was devastated by the Korean War (1950-53) but has made a remarkable progress since the beginning of the 1960s to present. The per capita GDP (in 2010 US dollars) of Japan rose from $8,608 in 1960 to $25,489 in 1980, and eventually to $42,170 in 2000. The per capita GDP in S. Korea also increased steadily from $944 to $3,700, and $15,104 over the corresponding period, but still far behind Japan [5]. As mentioned earlier, Taiwan’s economy made steady progress, a decade ahead of S. Korea. As their economies progressed, people’s food consumption improved substantially in both quantity and quality in the two countries. Total caloric intake matters, particularly for the developing economies. Table 2 presents changes in per capita daily caloric intakes, i.e., the grand total from all foods, sub-divided into ‘vegetal products’ and ‘animal products’ in Japan, S. Korea, and Taiwan, plus a few selected countries in Europe as reference. The table is based on Food Balance Sheets, available on internet from 1961 to 2013, FAOSTAT [26]. In Japan, per capita total caloric supply per day increased from 2,525 kcal in 1961, gradually to 2,798 kcal in 1975, 2,861 kcal in 1985, 2,920 kcal in 1995, and then declined to 2,685 kcal in 2010. Total caloric supply in Taiwan increased from 2,526 kcal in 1961 to 3,077 in 1995 and declined to 2,962 in 2010. In contrast, total caloric supply in S. Korea increased more sharply from 2,141 kcal in 1961 to 3,106 kcal, 2,951 kcal, 3,022 kcal, and eventually to 3,281 kcal, over the corresponding period. Since the mid- 1970s, S. Koreans have been consuming 200 to 300 kcal more food calories on national average than Japanese and also Taiwanese.
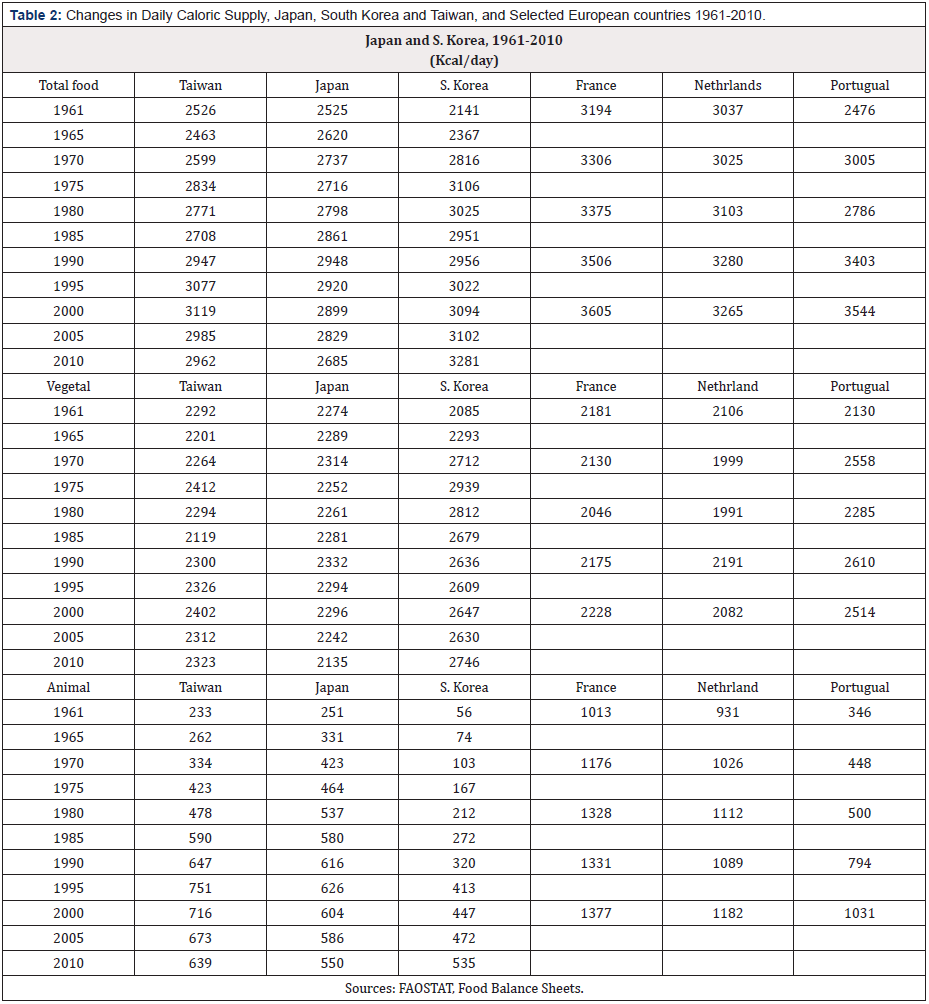
Table 2: Changes in Daily Caloric Supply, Japan, South Korea and Taiwan, and Selected European countries 1961-2010.
The composition of these calories matters as well. Per capita daily supply of calories from animal products has increased appreciably in the three countries, i.e., from 251 kcal and 233 kcal in 1961 in Japan and Taiwan, respectively, to 537 and 478 kcal in 1980 and then to 604 and 716 kcal in 2000 in the two countries, whereas that in S. Korea increased from very low level, 56 kcal in 1961, moderately to 212 kcal in 1980 and very fast to 447 kcal in 2000. We will see in the following sections that Japanese and Taiwanese surpassed S. Koreans in consumption of animal sourced foods, whereas S. Koreans have been eating substantially more ‘vegetal’ products (cereals, potatoes and vegetables) than Japanese and Taiwanese as well over the entire period under consideration. A European comparison may be relevant. In Europe, where the majority of people are supposed to be similar in respect of race, i.e., “Caucasians”, regardless of the countries. The Dutch were nearly 15 cm taller than the Portuguese in 1980 (men at age 20 years or those born in 1960). However, in the middle of 19th century, the Portuguese were 163 cm, only 1 cm shorter than the Dutch and 1 cm taller than the French, who overtook the Portuguese by 5 cm in 1980 (Figure 1). These differences cannot be attributed to genetics. As shown in Table 2, in terms of per capita daily caloric supply (=consumption), the Portuguese took only 346 kcal from animal products in 1961, compared to 931 and 1,013 kcal, respectively by the French and the Dutch in the same year.
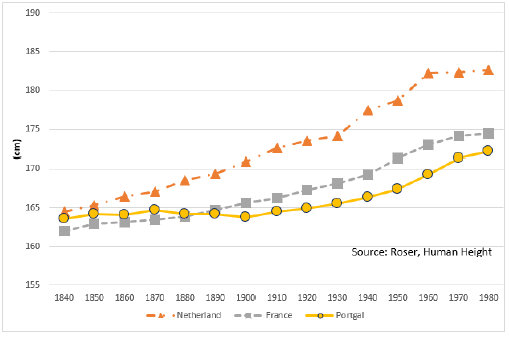
Figure 1: Changes in men’s height by birth years in selected European countries, 1840 to 1980
Sources: University of Tuebingen: Hight datahub (2015)
Foot Note
*3 The author heard only recently that small scale nutrition surveys had been conducted since 1965 to 1995 in South Korea, to which the author has no access, to his regret. Nutrition surveys, in either country, which are based on one day, 24 hour-recall surveys, tend to carry very large SDs (standard deviations) with respect to food intakes, due to quite a few zero answers, particularly in the case of non-staple food-items, such as fish, meat, and fruit. Moreover, reported consumption of fruit and vegetables, in particular, tends to vary according to the seasons, when the surveys are conducted (e.g. spring or fall) and daily climatic conditions. The 2005 KNHANES was conducted in May, while the 1998 and 2001 surveys were conducted in November with attendant differences.
*4 School years start in April in Japan, March in S. Korea and January in Taiwan, respectively. If the survey was conducted in fall in some years, more than half of the elementary school children enrolled in 1st grade should be actually 7 years old.
*5 School Health Surveys in Japan have been conducted lately in April set by the law, whereas the surveys are to be done in April in S. Korea lately but might have been done in other months. Moreover, the annual reports for S. Korea, which the author has obtained, depict the survey results only for the Seoul district in some years and averages of several major districts in other years. At this moment, the author’s knowledge of the Taiwan’s school system is very limited.
Discussions
Comparison of mean height of school children by age from the early 1960s to the 2000s
Japanese male high school 3rd graders, average age 17 years, were 166.7 cm (in mean height) in the mid-1960s. This was 2.9 cm and 1.1 cm taller than their S. Korean and Taiwanese peers, respectively. They grew to 170.2 cm in the mid-1980s, 0.8 cm and 1.1 cm, respectively taller than their S. Korean and Taiwanese peers but they grew very little to 170.9 cm in the mid-1990s, which was 0.1 cm shorter than their S. Korean peers and around 1.0 cm shorter than their Taiwanese peers, respectively. Japanese schoolboys at all ages ceased to grow any taller since then, to be overtaken by their S. Korean peers who still kept growing taller appreciably until the mid-2000s. When high school 3rd graders in the two countries were compared in the mid-2000s, S. Koreans were then 2.9 cm taller than Japanese. When high school 1st graders in Taiwan*6 and S. Korea were compared in the late 2000s, S. Koreans were 3.9 cm taller than their Taiwanese peers. When elementary school 1st to 6th graders were compared, S. Korean children were more than 4 cm taller than their Japanese peers in the mid-2000s (Table 1) and nearly 5 cm taller than their Taiwanese peers in the late 2000s (Table 2). These differences manifest the statistical facts based on nationwide surveys beyond any doubts or discussion.
Cole and Mori [27] concluded that most of the height increment seen in adults had accrued by age 1.5 years, both in Japan and South Korea. This is based on the data on all ages from 1 to 20 years, although the data were limited in years of observations, 1965, 1975, 1984, 1997, and 2005 [28]. A child born in 1960, for example, aged to 1 year old in 1961 and eventually to 20 years old in 1980. In determining child height growth patterns, it may be more desirable to compare a 1 year old in 1961, with 10 years old in 1970 and 20 years old in 1980, by birth cohort, for example, than to compare different ages in the same year, say in 1970 or 1980. Increases in height from 1 year old in 1961 to 20 years old in 1980, however, could have been affected significantly by “period effects” (on the top of “age effects”, [29-31]) over the 20 years, which should not be disregarded particularly in rapidly growing countries, like Japan, S. Korea and Taiwan under our investigation. Cohort analysis (A/P/C) could be applied to this case, with technical difficulties due to the biological phenomena of uneven impacts of period-effects*7 among different ages, on top of common “identification problems” caused by straight linear relations between the three variables, age, period and cohort effects, not easy to overcome to the author’ satisfaction in this case[32].
As a practical compromise, we will compare the average height of elementary 1st and 2nd graders, 6.5 years old in 1960 to that of high school 2nd and 3rd graders, 16.5 years old in 1970, for example, in order to minimize the period effects involved. Fig. 2 demonstrate the growth velocity in height from the average of elementary 1st and 2nd graders, age 6.5 years in 1960 to the average of high school 2nd and 3rd graders, age 16.5 years in 1970, for example, in Japan, S. Korea and Taiwan, respectively from 1960 to 1970, from 1965 to 1975, ---, from 2000 to 2010, in turn*8. Japanese male high school 2nd and 3rd graders on average increased from 164.5 cm in 1960, to 169.2 cm in 1980 and 170.1 cm in 1990 and 170.3 cm in 2010, respectively, whereas their S. Korean peers increased much more sharply from 162.2, to 167.7, 169.0, and 173.4 over the correspond ing period. When height growth velocities from 6.5 years to 16.5 years in the three countries are measured, the velocities proved practically the same, with a slightly downward trend of 1-2 cm in magnitude at around 52 cm over the period from 1960 to 2010 in the three countries (Figure 2).
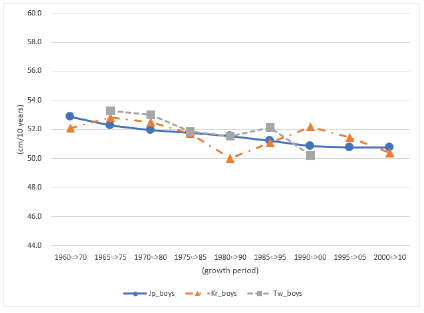
Figure 2: Changes in average height of schoolboys at 1st -2nd grades in elementary school in Japan, S. Korea and Taiwan
On the other hand, when the average heights of elementary 1st and 2nd graders in the three countries are compared, Japanese boys were more or less 2 cm taller than their S. Korean and Taiwanese peers in the 1960s and the 1970s, about the same in the 1980s but both S. Korean and Taiwanese young school boys were approximately 2 cm taller than their Japanese peers in the mid-1990s. And then, S. Koreans were nearly 4 cm taller than their Japanese and Taiwanese peers in the mid and late-2000s (Figure 2). To reprise Cole and Mori [28], most of the height increment seen in high school 2nd and 3rd graders had already accrued by elementary school 1st and 2nd graders, almost equally in Japan and S. Korea over the half century from 1960 to 2010. The fundamental questions to be raised here now seem to be what factors gave rise to a clear-cut reversal in mean height of children in the earlier grades of elementary school between Japan and S. Korea, whereby Korean children increasingly overtook Japanese children in an around the 1980s and onward? When Taiwan added, why Taiwanese schoolboys became appreciably shorter than their Korean peers in the 2000s?
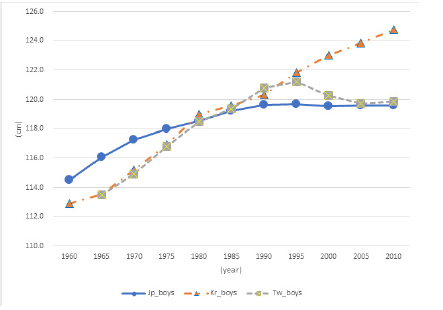
Figure 3: Changes in average height of schoolboys at 1st -2nd grades in elementary school to 2nd -3rd grades in high school in Japanese S. Korea.
In the capacity of food economist, with no biological/medical background, the author will focus on food supply, as one of the key components of “inputs to health” [17], in the subsequent sections, to try to answer even partially the above questions.
Comparison of per capita consumption of selected food products between Japan, South Korea and Taiwan from the early 1960s to the 2000s.
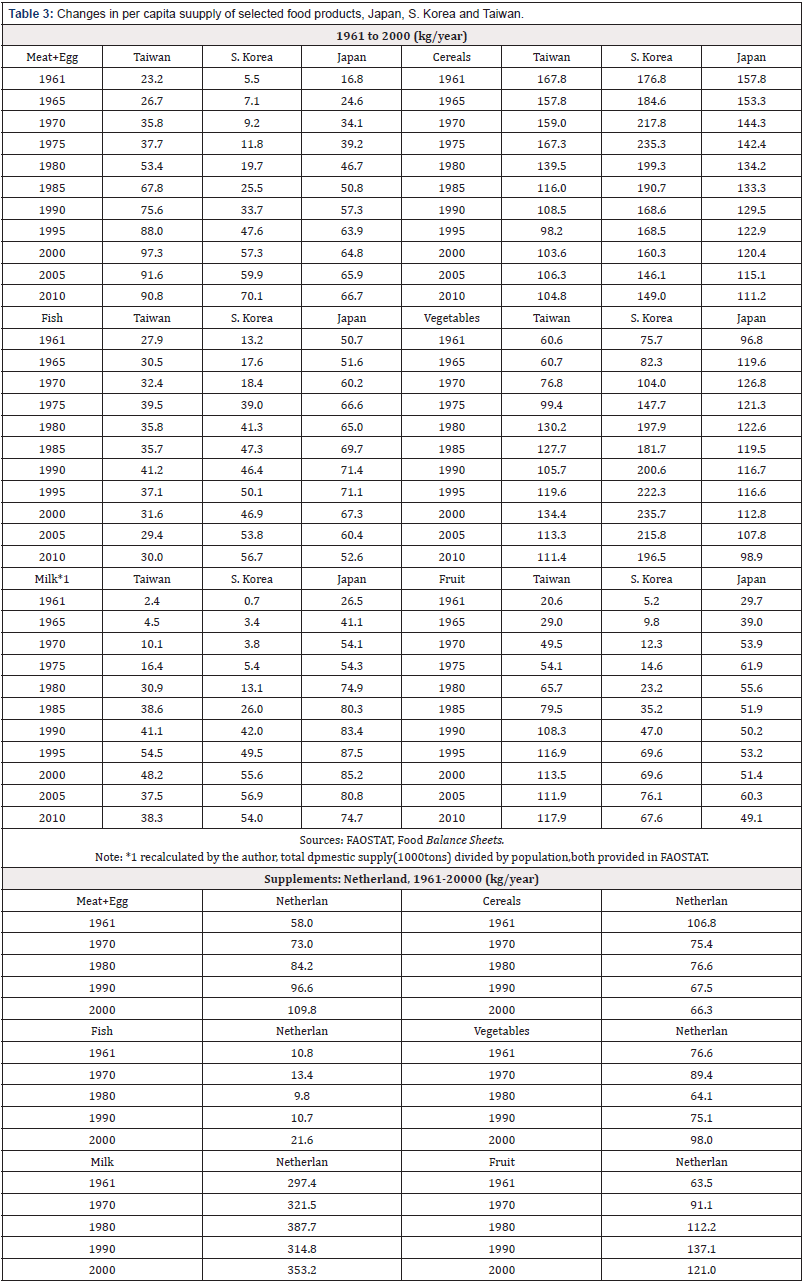
As briefly mentioned in the previous section, South Koreans have been consuming consistently larger total food calories, say 200-300 kcal/capita/day more, than Japanese since the early 1970s and onward. As compared with Taiwan, S. Korea has been 200 kcal greater since the mid-1990s. S. Koreans, however, have been consuming considerably fewer calories from animal sourced foods than Japanese and Taiwanese. In particular, milk consumption* 9 in S. Korea has been substantially less than in Japan. On the other hand, per capita consumption of vegetables, excluding potatoes, has been increasing steadily since the early 1960s to the mid-2000s in S. Korea, whereas that in Japan and Taiwan has been gradually declining since the early 1980s. As of the mid-2000s, S. Koreans, on average, consumed nearly twice as much vegetables as Japanese and Taiwanese, as well (Table 3). South Koreans, however, did not eat much fruit in the earlier period of our investigation. For example, per capita net supply (=consumption) of fruit in S. Korea was meager at 5.2 kg/year in the early 1960s, as compared to 29.7 kg in Japan and 20.6 kg in Taiwan and 63.5 kg in Netherlands, at the same time.
The Netherlands is introduced here as an example of a high income non-Asian example. S. Korea’s fruit consumption, however, rapidly increased to 35.2 kg in the mid-1980s and eventually to 76.1 kg in the mid-2000s, whereas that in Japan declined from 61.9 kg in the peak period, the mid-1970s, to 51.4 kg in 2000, when the Taiwanese and the Dutch consumed 113.5 kg and 121.0 kg of fruit per capita/year, respectively, by way of reference (Table 3). Men reach their maturity in height at or before their age of 20 years under normal conditions. Food consumption in any amount or variety after this age of maturity rarely affects men’s physical height. In discussing or analyzing development of men’s height, either between the countries or over time, mere per capita consumption of the entire population could be misleading, especially in the presence of sizable age and cohort effects in food consumption [33-37]. National Nutrition Surveys, Japanese government, through Ministry of Health and Welfare, started in 1995 to publish daily per capita intakes of various food groups, by age groups, 1-6 years, 7-14 years, 15-19 years, 20-29 years, 30-39 years, --, whereas KNHNES[21] was first published in 1998, followed by the 2nd one in 2001, and the 3rd one 2005.
We are analyzing secular changes in relative height of children in Japan, South Korea and Taiwan from 1960 to 2010 and as already mentioned, the reversal in relative child height between Japan and S. Korea seems to have taken place in the mid-1980s. Unfortunately, we have no official data available to identify the changes and differences in nutritional intakes specifically by infants and adolescents, over the long run, i.e. from 1960 to 2010. Family Income and Expenditure Survey [38], of the Japanese Bureau of Statistics, started to publish household purchases of various commodity groups classified by age groups of household head (HH) in 1979. Mori and his research associates designed a practical approach to derive individual consumption by age groups of family members, in place of simply dividing household purchases by the number of family members contained in households classified by HH age groups [39- 40]. FIES covers eating-out, only in such a form as expenditures on school lunch, expenditures in Sushi restaurants, etc. Nevertheless, FIES could be counted for detecting the changes in per capita consumption of various food products by age groups, infants, adolescents, young adults, middle aged adults over the period from 1979 to present.
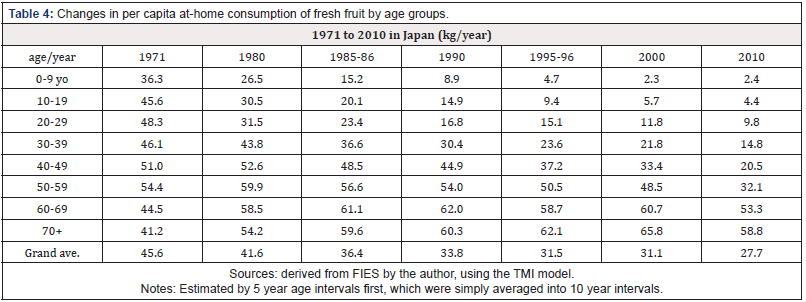
The 1994 White Paper on Agriculture [41], demonstrated wide spread tendencies of wakamono no kudamono banare (steering away from fruit by the young) by displaying declining tendencies in household purchases of fresh fruit by households headed by the younger adults in the 1980s. Table 4 provides changes in per capita consumption (=purchases) of fresh fruit by age groups by 10 year intervals, of individual family members from 1971*10 to 2010, estimated by the author, using the TMI model [40]. A reserved concern on “steering away from fruit by Japanese youth” raised by the White Paper on Agriculture, 25 years ago has come true on unexpectedly extensive scales since then. It is clearly demonstrated that children in Japan, on per capita basis, consumed nearly the same amount of fresh fruit, some 40 kg at home as adults in their middle age in the early 1970s but reduced their consumption to 20 kg in the mid- 1980s and further down to 5 kg in the early 2000s. In contrast, those in their 50s and 60s increased their fresh fruit consumption, on per capita basis, from 40-50 kg to 60 kg and kept their consumption at the high level over the corresponding period. As of 2010, at-home per capita consumption of fresh fruit by children and young adults was nearly one 10th that of those in their 60s and 70s in Japan.
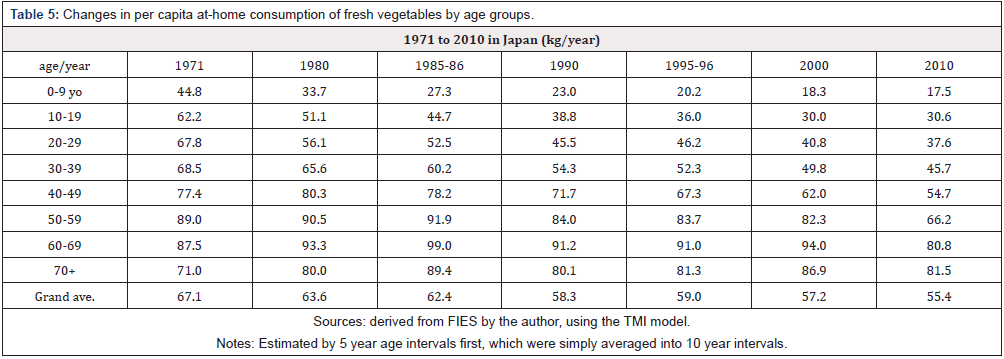
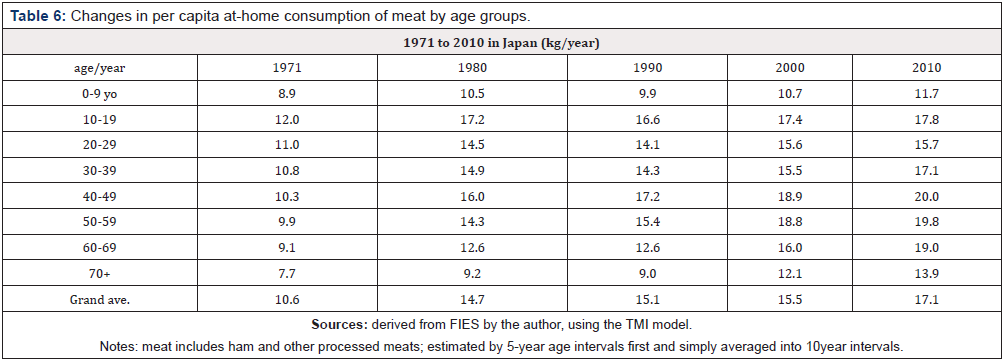
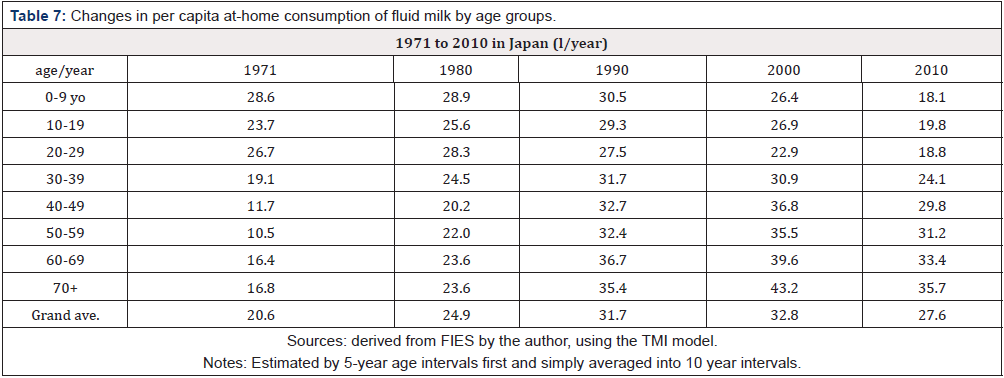
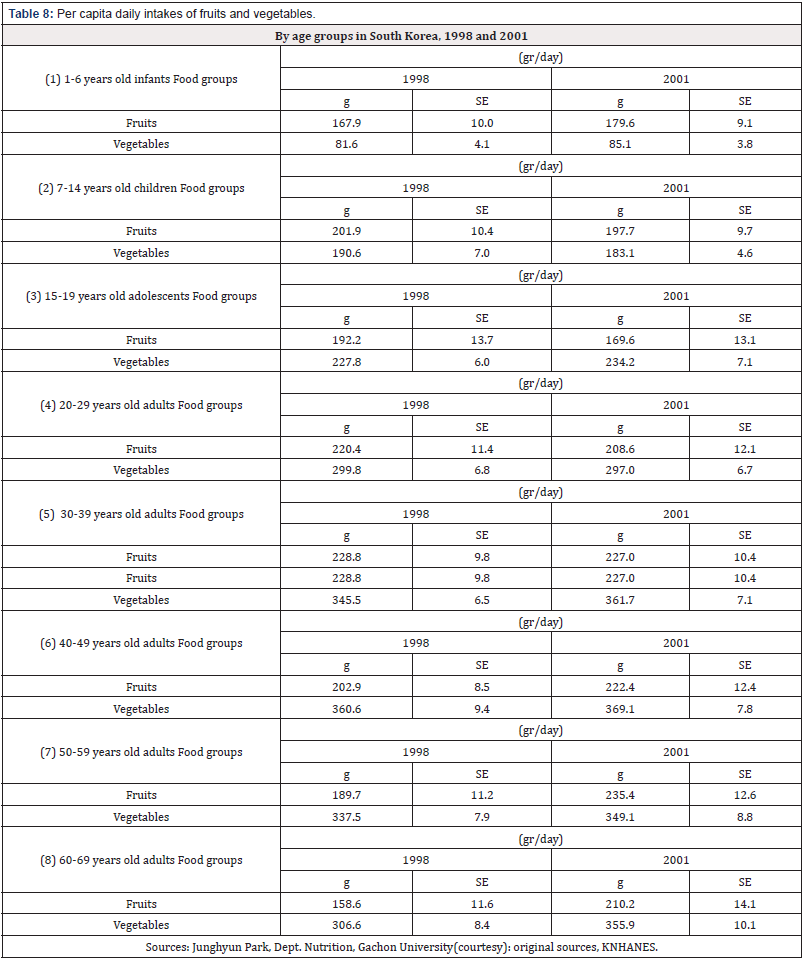
Table 5 provides changes in per capita at-home consumption of fresh vegetables, including fresh potatoes by age groups of family members, estimated by the author. Although not to the extent of fresh fruit, per capita consumption of fresh vegetables by Japanese youth has declined considerably, as compared to that in their 50s and 60s over the period from the mid-1970s to the early 2000s. As to meat, the younger members of household, including children, have increased their at-home consumption considerably from the early 1970s to the early 2000s, whereas the younger individuals have kept their at-home consumption of fluid milk at the same level since the early 1970s to the early 2000s. As regards meat and fluid milk, the older adults in their 50s and 60s have more than doubled their at-home consumption over the period in question, which may have little to do with the development of child height under our consideration (Table 6 and 7). To the author’s regret, he has no direct access to household expenditure surveys in S. Korea and Taiwan, comparable to FIES, Japan. Estimates of per capita daily intakes of fruit and vegetables by age groups, including infants, derived from KNHANES, 1998 and 2001, are provided in Table 8 [42].
It looks certain that South Korean youth have not steered away from vegetables and fruit in their daily food consumption, unlike their Japanese peers in the 1980s through the early 2000s. The author has not obtained detailed data on food consumption, particularly by age groups in Taiwan, to his regret.
Foot Note
*6 The author obtained the data pertaining to mean height of Taiwanese school children for the years from 2007 to 2016, only for the age ranges from 6 to 15 years [33].
*7 In the ordinary A/P/C model, the impacts of period, say, changes in prices, incomes, for example, are assumed to be uniform over the different age and cohort groups in the same period. The cohort analysis of Taiwan’s saving by Deaton and Paxson [30] captures only annual fluctuations, explicitly disregarding “the rising tide”, as rightly pointed by Skinner [31].
*8 Due to the lack of data, the periods from 1960 to 1970 and 1995 to 2005 and 2000 to 2010 were not attempted for Taiwan.
*9 Per capita net supply of milk, excluding butter, seems conspicuously under-calculated for Republic of Korea (South Korea) for the period after 1985 onwards in FAOSTAT Food Balance Sheets. The author recalculated per capita net supply of milk, for three countries, Japan, S. Korea and Taiwan, by dividing total net supply of milk (in 1000 tons) by total population, both as reported in the same data sources, to derive per capita net supply in kg/ year for respective countries.
*10 The author discovered only recently that 1971 annual report, FIES, contains household purchase data classified by HH age groups, exactly in the same format as annual reports for 1979 and onwards.
Conclusion
Should one eat more, with physical activities kept unchanged, one will get bigger. If children before maturity eat more, with or without more physical activities, they tend to grow bigger, either in height or weight, or in both. Especially, if they eat more animal sourced foods, particularly milk, they will grow taller in height. There is little question about this [43-45]. After the mid-1950s, when Japan’s economy had recovered to its pre-war level, Japanese began to eat more foods, in terms of total caloric intakes, and better foods, i.e., more animal sourced foods and fruit, in particular. Japanese youth in their early 20s, who spent their early years of childhood in starvation during the war and soon after the war period, grew taller in height than those who were born before the war with reasonable amount of food supply but spent their late childhood during the severe food shortage period [46]. The same thing happened in S. Korea, which was under Japan’s colonization until the end of WW II and whose economy was devastated by the Korean War, 1950-53, but began to grow very rapidly after the early or mid-1960s.
Taiwan, which was under Japan’s colonization, like Korea, began to grow economically some 10 years earlier than S. Korea. In the late 1990s, Taiwanese youth were nearly the same in height as S. Koreans, at 171-72 cm, and both 0.5-1 cm taller than their Japanese peers. Taiwanese youth ceased to grow any taller since then, whereas S. Korean youth kept growing further in height to overtake their Taiwanese peers by 2 cm and their Japanese peers by 3 cm in the mid-2000s. With respect to per capita GDP, Taiwan was considerably richer, and Japan was substantially richer than S. Korea at that time. With respect to per capita caloric supply from animal products, meat, fish and milk in the 1980s and 1990s, Taiwan and Japan were similar and consumed as much as at least 40% more than S. Korea. As mentioned earlier, at age 20 years, young men in Taiwan were 2-3 cm taller than their Korean peers in 1900 to1930 under Japan’ colonization. Per capita net supply of ‘meat+ egg’ in S. Korea increased very fast and steadily from 19.7 kg in 1980 to 47.6 kg in 1995 and 59.9 kg in 2005, whereas that in Taiwan also increased from 53.4 kg in 1980 to 91.6 kg in 2005.
As regards per capita net supply of milk, in which Japan has persistently exceeded the two countries, Taiwan was 30.9 kg in 1980 and 54.5 kg in 1995, respectively but decreased to 37.5 kg in 2005, whereas S. Korea increased very sharply from 13.1 kg in 1980 to 49.5 kg in 1995 and further up to 56.9 kg in 2005 (Table 3). Consumption of animal proteins is highly effective in explaining increments in child height in South Korea alone but does not seem to be highly successful in identifying differences in child height development between the three countries, Japan and S. Korea with Taiwan added where data are available. Japan has steadily decreased per capita consumption of fruit since the mid-1970s, whereas S. Korea rapidly increased it, to exceed Japan by 30% in 2000. The author provided his own estimates of radical tendencies of “steering away from fresh fruit” among Japanese youth since the mid-1970s. Taiwan, however, exceeded Japan in respect of per capita supply (=consumption) of fruit in 1980 and consumed twice as much fruit as Japan and 60% more fruit than S. Korea in 2000.
On the other hand, per capita supply of vegetables in Taiwan has been nearly the same as that in Japan, but nearly one half that in S. Korea since 1980 and this applies to the case of per capita consumption of cereals, e.g., per capita consumption of cereals in Taiwan was 103.6kg in 2000, as compared to 160.3 kg in South Korea in the same year. Blum states succinctly: “Populations consuming larger amount of animal protein reach higher average height than countries with less animal protein consumption. However, a high consumption of animal proteins alone does not result in increasing body height, if the overall consumption of calories and other essential nutrients is insufficient” [2]. With little background in nutrition sciences, the author cannot pinpoint consumption of what ‘essential nutrients’ should have been insufficient in the case of Japan and Taiwan, in comparison with South Korea. This may need interdisciplinary investigations. The author has tried, in the foregoing papers, to appeal to readers possible nutritional contributions of fruit and vegetables to bone mineral accruals for children, including fetus, by referring to the longitudinal case studies of Mikkabi-machi residents by a small group of researchers at The National Fruit Tree Research Institute, in collaboration with the Hamamatsu University of Medicine for the past 10 years [4,47,48].
Appendix: Brief Notes on Data Sources
Stature
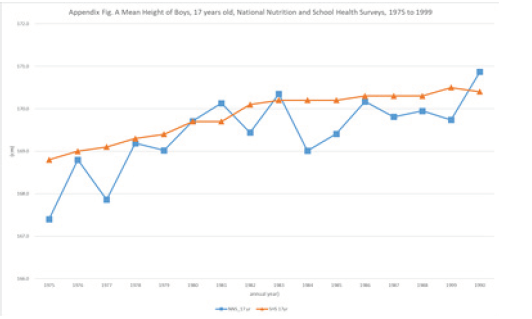
Take the case of Japan. National Nutrition Survey [14] conducted every year since soon after the end of WW II, carries data on mean height of males and females by age groups, 1 to 25 years by one-year age interval, 26-29, 30-39, --60-69, 70-. School Health Examination Surveys [16] conducted every year on all schools over the country report mean height of children, both sexes, from 1st graders in elementary school to 3rd graders in high school. The size of survey subjects, by each age group from 1 to 25 years old, by NNS, is limited as compared to SHES. This may be the reason why annual data classified by age everyone year are not stable, as compared with SHES, as shown in Appendix Figure A. When analyzing changes over time and differences between countries in mean height in the order of 1 to 2 cm, SHES seems to excel NNS.
Consumption
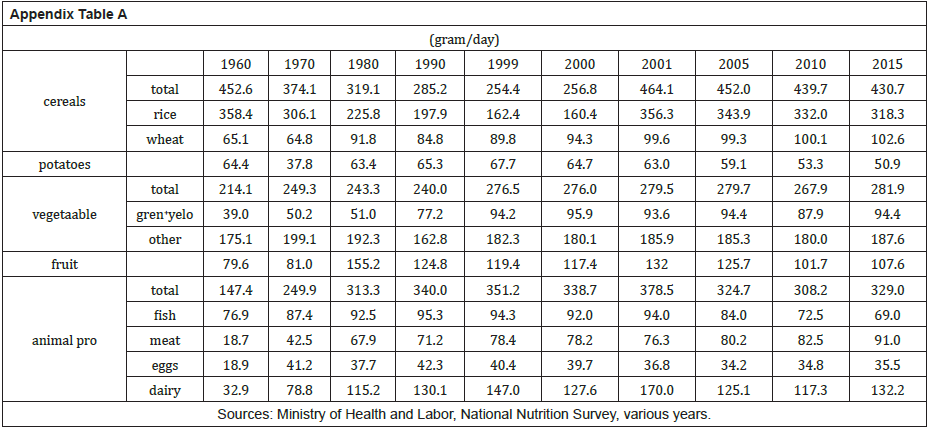
National Nutrition Surveys [15] report daily per capita intakes by major food products based on nationwide 24-hour recall surveys conducted on any one day, except holidays in November every year in Japan. Survey results are reported by age groups, starting 1995 in Japan. The nationwide comprehensive nutrition surveys were conducted first in1998 followed by the second ones in 2001, and the third ones in 2005 in South Korea [20]. The author has not heard that the similar surveys have been conducted regularly every year in Taiwan. The author found only very recently that per capita daily intakes of rice, accordingly total cereals rose abruptly 160.4 and 256.8 gr, respectively in 2000 to 356.3 and 464.1 gr, respectively in 2001 and kept these higher levels since then (Appendix Table A). Both in Japan and South Korea, family income and expenditure surveys, based on monthly diary type surveys have been done, which cover ever increasing eating out, in such categories as school lunch expenditures, expenditure in sushi-restaurants.
Food balance sheets provide annual per capita supply, not consumption, by major food products from very early years in most countries and FAO provides food balance sheets for Japan, South Korea, and Taiwan every year since 1961 to 2013. Supply is not the same as consumption but could be taken as a proxy for consumption.
Acknowledgment
The author is deeply grateful to Dr. Howard Elliot, former Deputy Director General, ISNAR, The Hague, for valuable and affirmative comments and thorough editing of the manuscript. The author is also dearly appreciative to Dr. Kelly Olds, Professor at National Taiwan University, who collected official stature data on school children in Taiwan since the beginning of the 1960s for this project.
References
- Tuebingen University, Human Height.
- Matthias B (2013) Cultural and genetic influences on the ‘biological standard of living’. Historical Method 46(1): 19-30.
- Hiroshi M (2017) Stature: Key determinants of positive height trends― the cases of Japan and South Korea, The Monthly Bulletin of Social Science 644: 21-40.
- Hiroshi M (2018a) Why Koreans became taller than Japanese? Annual Bulletin of Social Science, Senshu University 177-195.
- Federal Reserve Bank of St. Louis. Federal Reserve Economic Data.
- Kang, He-yong (2018) Korea Times.
- Kim H, Heo Uk (2017) Comparative analysis of economic development in South Korea and Taiwan: Lessons for other developing countries. Department of Political Science, University of Wisconsin-Milwaukee and Kyung Hee University, Milwaukee 1-32.
- Lee TS, Chao TH, Tang RB, Hsieh CC, Chen SJ, et al. (2004) A longitudinal study of growth patterns in school children in Taipei Area I: Growth curve and height velocity curve. J Chinese Medical Association 67(2): 67-72.
- Robert WF (1994) Economic growth, population theory, and physiology: the bearing of long-term process on making of economic policy. The American Economic Review 84(3): 369-395.
- Reidpath DD, Allotey P (2003) Infant mortality rate as an indicator of population health. J. Epidemiol Community Health, 57(5): 344-346.
- Timothy JH (2013) How have Europeans grown so tall? Oxford Economic Papers, Oxford University Press 1-24.
- McGuire, James W (2010) The quality of infant mortality data in East Asia and Latin American societies 1-47.
- Hiroshi M (2016) Secular changes in body height and weight of population in Japan since the end of WW II in comparison with South Korea. The Monthly Bulletin of Social Science 636: 13-25.
- Japanese Government, Ministry of Health, Labor and Welfare. National Nutrition Survey in Japan, Tokyo.
- Kimura, Mitsuhiko (2018) Korea under Japan’s Colonization, Tokyo, Chuokoron-shinsha, pp: 224.
- Japanese Government. Ministry of Education. School Health Examination Survey, Tokyo.
- Steckel RH (1995) Stature and the standard of living. Journal of Economic Literature 33: 4.
- Olds KB (2003) The biological standard of living in Taiwan under Japanese occupation. Economics and Human Biology 1:187-206.
- Morgan SL, Liu S (2008) Was Japanese colonialism good for the welfare of Taiwanese? Statue and the standard of living. The China Quarterly.
- Republic of Korea, Korea Centers for Disease Control and Prevention. Korea National Health and Nutrition Examination Surveys.
- Republic of Korea. Department of Education, Center for Educational Statistics. Statistical Yearbook of Education, Seoul.
- Cole TJ (2003) The secular trend in human physical growth: A biological view. Economics and Human Biology 1: 161-168.
- Deaton A (2007) Height, health, and development. PNAS 104(33): 13232-13237.
- Prentice AM, Ward AK, Goldberg GR. Jarjou LM, Moor SE, et al. (2013) Critical windows for nutritional interventions against stunting. Am J Clin Nutr 97: 911-18.
- Japanese Government, Economic Planning Agency (1956) White Paper on Economy, Tokyo,
- FAO of the United Nations. FAOSTAT. Food Balance Sheets, by country and year.
- Cole TJ, Mori H (2017) Fifty years of child height and weight in Japan and South Korea: Contrasting secular trend patterns analyzed by SITAR. Am J Hum Biol 30(1).
- Kim JY, Oh IH, Lee EY, Choi KS, Choe BK, et al. (2008) Anthropometric changes in children and adolescents from 1965 to 2005 in Korea. American Journal of Physical Anthropology 136(2).
- Glen, Norval D (1977) Cohort Analysis, Sage Publications, Beverly Hills, CA.
- Deaton A and Paxson C (1994) Saving, growth, and aging in Taiwan, Studies in the Economics of Aging, eds. by D.A. Wise, Chicago, the University of Chicago Press 331-357.
- Skinner, Jonathan (1994) Comment on Deaton and Paxson, Saving in Taiwan, the Economics of Aging, ibid 358-361
- Mori H, Dyck J (2018) Secular trends in human height: application of cohort analysis—The case of post-war Japan, Economic Bulletin of Senshu University, 52(3): 183-196.
- Kubota, Ai (2019) Library, Senshu University, Kawaski, courtesy.
- Hiroshi M (2014) Cohort Analysis for Social Sciences, Tokyo, Center for Academic Publications, pp: 252.
- Mori H, Clason D (2004) A cohort approach for predicting future eating habits: The case of at-home consumption of fresh fish and meat in an aging Japanese society. International Food and Agribusiness Management Review 7(1): 22041.
- Mori H, and Saegusa Y (2010) Cohort effects in food consumption: what they are and how they are formed. Evolutionary and Institutional Economics Review 7(1): 43-63.
- Mori H, Inaba T, Dyck J (2016) Accounting for structural changes in demand for foods in the presence of age and cohort effects: The case of fresh fish in Japan. Evolult Inst Econ Rev 13: 363–379.
- Japanese Government, Ministry of General Affaires, Bureau of Statistics. Annual Report of Family Income and Expenditure Survey, various issues, Tokyo.
- Mori H, Inaba T (1997) Estimating individual fresh fruit consumption by age from household data, 1979 to 1994. Journal of Rural Economics, 69(3): 175-85.
- Tanaka M, Mori H, Inaba T (2004) Re-estimating per capita individual consumption by age from household data. Japanese Journal of Rural Economics 6: 20-30.
- Japanese Government, Ministry of Agriculture, Forestry and Fisheries (1995) White Paper on Agriculture-1994, Tokyo.
- Park, Junghyun (2018) Dept. of Nutrition, Gachon University, courtesy.
- Silventoinen K (2003) Determinants of variation in adult body height. Journal of Biosocial Science, Cambridge University Press, 266-285.
- Beer, Hans de (2012) Dairy products and physical statue: A systematic review and meta-analysis of controlled trials. Economics and Human Biology 10: 299-309.
- Headey D, Hirvonen K, Hoddinott J (2018) Animal sourced foods and child stunting. Am J Ag Economics 100(5): 1302-1319.
- Mori, Hiroshi (2018b) Secular trends in childhood in post-war Japan: Nutrition throughout childhood, Recent Advances in Food Sciences 2(1): 75-84.
- Mori, Hiroshi (2017) Stature: Key determinants of positive height trend---the case of Japan and South Korea, The Monthly Bulletin of Social Science, Senshu University.
- Hiroshi M (2018b) “Why did Japanese children cease to grow taller in height in the midst of a booming economy in contrast with South Korea?” Annual Bulletin of Social Science, Senshu University 53: 223-240.



 We use cookies to ensure you get the best experience on our website.